specific latent heat
1/9
There's no tags or description
Looks like no tags are added yet.
Name | Mastery | Learn | Test | Matching | Spaced |
|---|
No study sessions yet.
10 Terms
specific latent heat
If a system is heated and increases in temperature, the amount it increases by depends on the mass, material and energy input of the system
equation for specific heat capacity
ΔE=mcΔθ
ΔE is the change in thermal energy in joules (J)
m is the mass in kilograms (kg)
c is the specific heat capacity in Joules per kilogram per degree Celsius (J/kg°C)
what’s specific heat capacity
is the amount of energy needed to increase the temperature of 1 kg of the substance by 1°C
when is latent heat required
when changing of state
in latent heat only the state changes not the
temperature
calculating specific latent heat
E=mL
E is the energy needed or released in Joules (J)
m is the mass of the substance in kilograms (kg)
L is the specific latent heat of a substance in Joules per kilogram (J/kg)
Specific latent heat of fusion
the specific latent heat for a change from a solid to a liquid.
Specific latent heat of vaporisation
the specific latent heat for a change from a liquid to a vapour (gas).

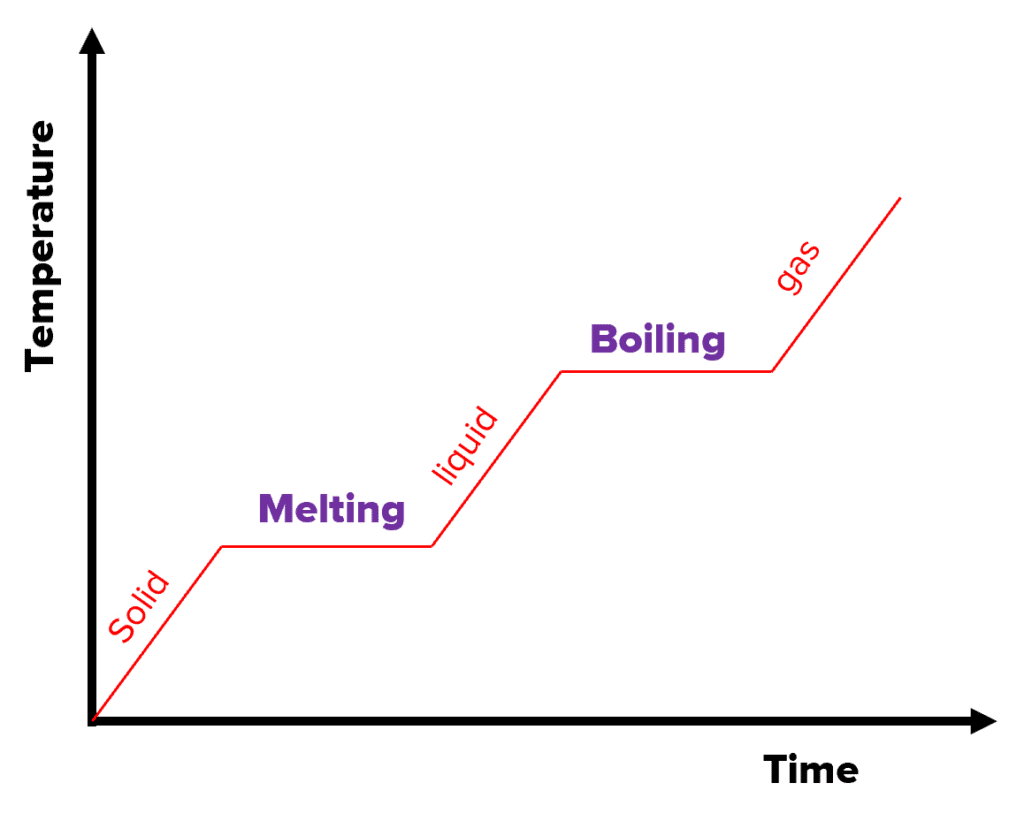
heating graph
The graph on the right is a heating graph. As the substance is heated over time, the temperature increases. However, notice the flat sections of the graph. This is where the substance is changing state.
As mentioned, when changing state, latent heat is involved and hence the temperature stays constant. The internal energy increases because there is an energy input into the system, but no energy is used to raise the temperature.
cooling graph
The graph on the right is a cooling graph. As the substance is cooled over time, the temperature decreases. The flat sections again show where the substance is changing state at a constant temperature. The internal energy decreases because energy is being released during cooling.
