standard deviation and whatnot
0.0(0)
Card Sorting
1/4
There's no tags or description
Looks like no tags are added yet.
Study Analytics
Name | Mastery | Learn | Test | Matching | Spaced |
|---|
No study sessions yet.
5 Terms
1
New cards
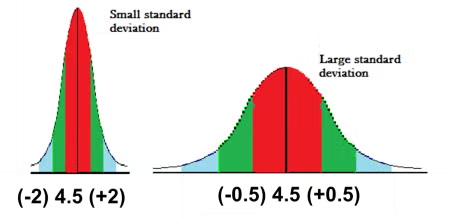
standard deviation
(often reported as ±) shows how much variation there is from the mean/avg
2
New cards
data points of smaller/larger standard deviations
data points close together → smaller deviation
data points spread out → larger deviation
3
New cards
what is standard error of the mean (SEM) used to represent
represents uncertainty in an estimation of mean & accounts for both sample size & variability
4
New cards
as standard error grow smaller…
smaller SEM → increased accuracy (accurate estimation of the population
5
New cards
what does the length of the error bars mean?
spread around the mean, shorter bars = less variability from the mean