Lecture 7- Describing variation & central tendency
1/29
There's no tags or description
Looks like no tags are added yet.
Name | Mastery | Learn | Test | Matching | Spaced | Call with Kai |
|---|
No analytics yet
Send a link to your students to track their progress
30 Terms
What are the traits called that you visible and are either present or not present?
Qualitative, Discontinuous
Qualitative: Physical Trait
Discontinuous: Exists are 2 or more distinct categories (no in between)
What are some examples of qualitative, discontinuous traits?
Attached vs detached earlobe, widows peak or no widows peak
What are the scale of measurements commonly used in statistics?
Nominal: Qualitative characteristics w/o value, order, or rank (ex: male v. female)
Ordinal: Describes categories but difference in rank exists (ex: poor, average, good)
Interval: Numerical data with inherent ordering (300-850 credit score- spaces between the numbers equal, but 0 value is arbitrary, 0 does not mean nothing exists)
Ratio Data: Ordered and numerical distance is rank and can be measured (weight, height, length) (0 means weightless)
Which measurement scales are continuous and which are discontinuous?
Interval and ratio are continuous and nominal and ordinal are discontinuous (categorical).
Which scale of measurement is used to determine qualitative, discontinuous attributes?
Nominal: categories don't have inherent rank and they are qualitative!
What kind of scale of measurement can height be described under?
Quantitative and continuous (numerical with in between values existing)
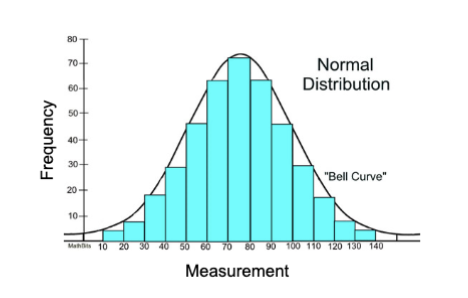
What is the central limit theorem?
If N is large enough (i.e., ≥ 30), then
Mean of the sample of measurements (height) should approximate the mean of the population
Distribution of measurements should be normal (clustered around the mean with no bias to the left or right
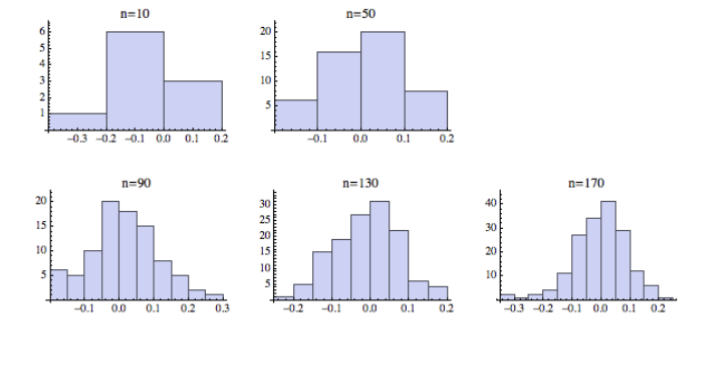
What is often the case when the n value is large?
The larger the n value, the better a scatter plot can approximate a normal distribution
What is the mean, median, and mode referred to as?
Measures of central tendency
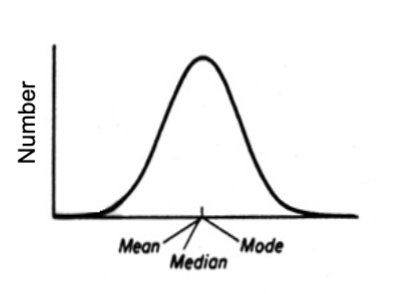
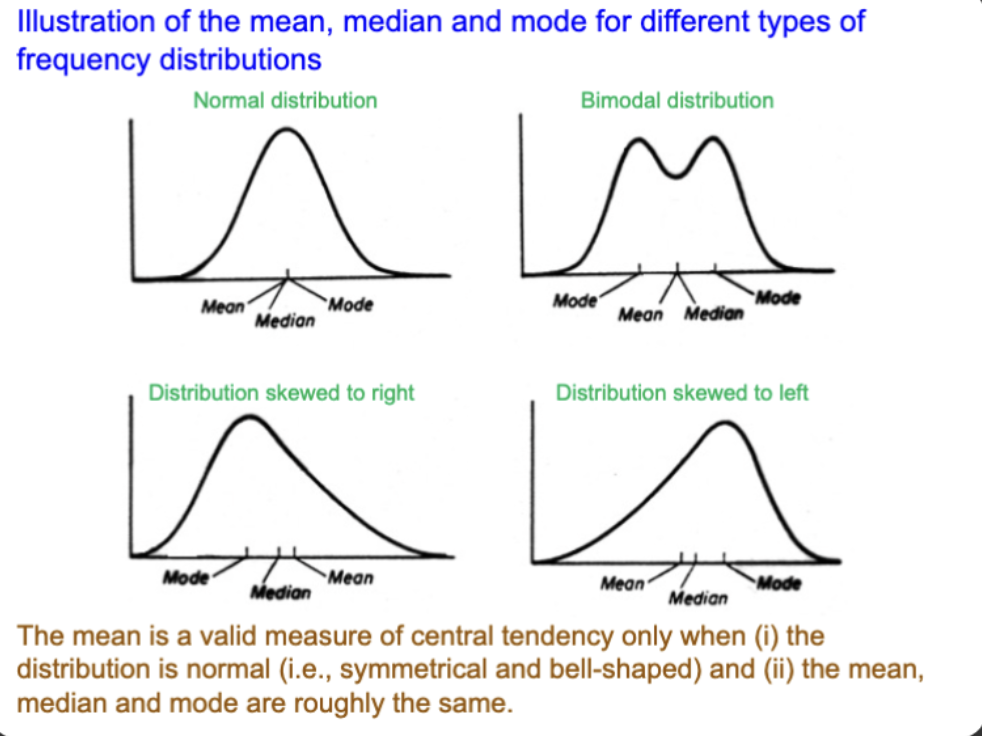
What happens to the mean, median, and mode when your frequency distribution is normally distributed
The mean, median, and mode will be similar
How do you calculate mean, median, and mode
Mean: Sum of numbers / total numbers
Median: Sort the numbers from smallest to largest and find the middle number (if two numbers in the middle, find the average of the two)
Mode: Value that appears the most frequently in a data set
What is the Law of Large Numbers?
As you increase n, parameters describing the sample (mean) are less likely to be affected by random variables.
Fluctuations in the data and outliers will cancel out if you have a larger n value
Shows that importance of having a large sample size
What is the measure of central tendency that is less vulnerable to outliers?
The median- even if an outlier value exists, the value of the median will remain the same. The mean is at risk of changing because of the outliers.
When is the mean a valid measure of central tendency?
1) Distribution is normal (symmetrical, bell shaped)
2) Median and mode are roughly the same
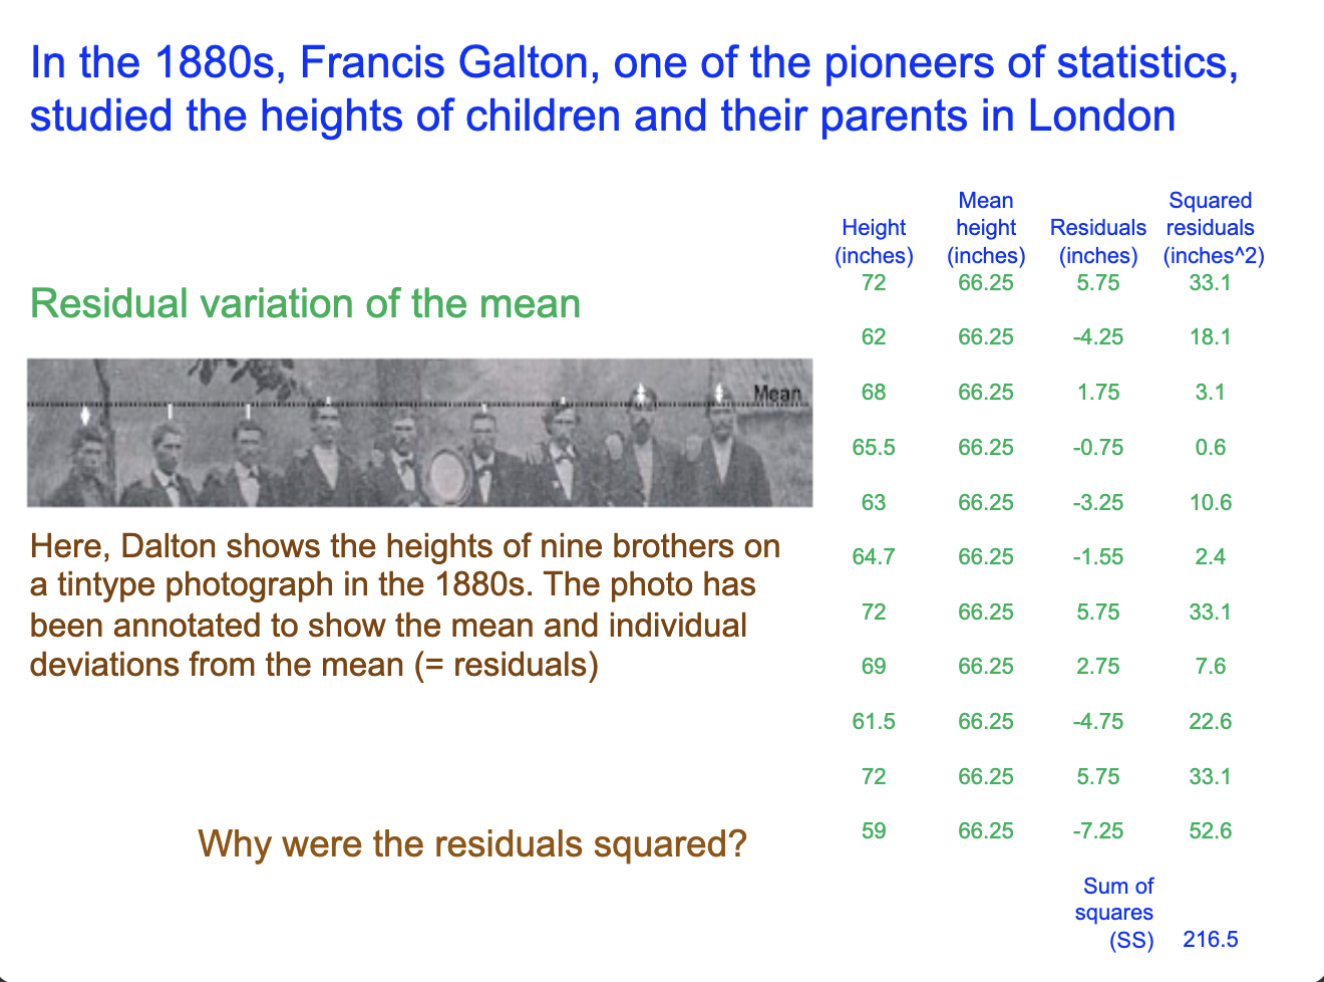
How do you find residual variation of the mean?
1) (Reported- mean height of all reported) = residual
2) Residuals² = (residual)²
3) Sum of Squares= sum of all (residual)²
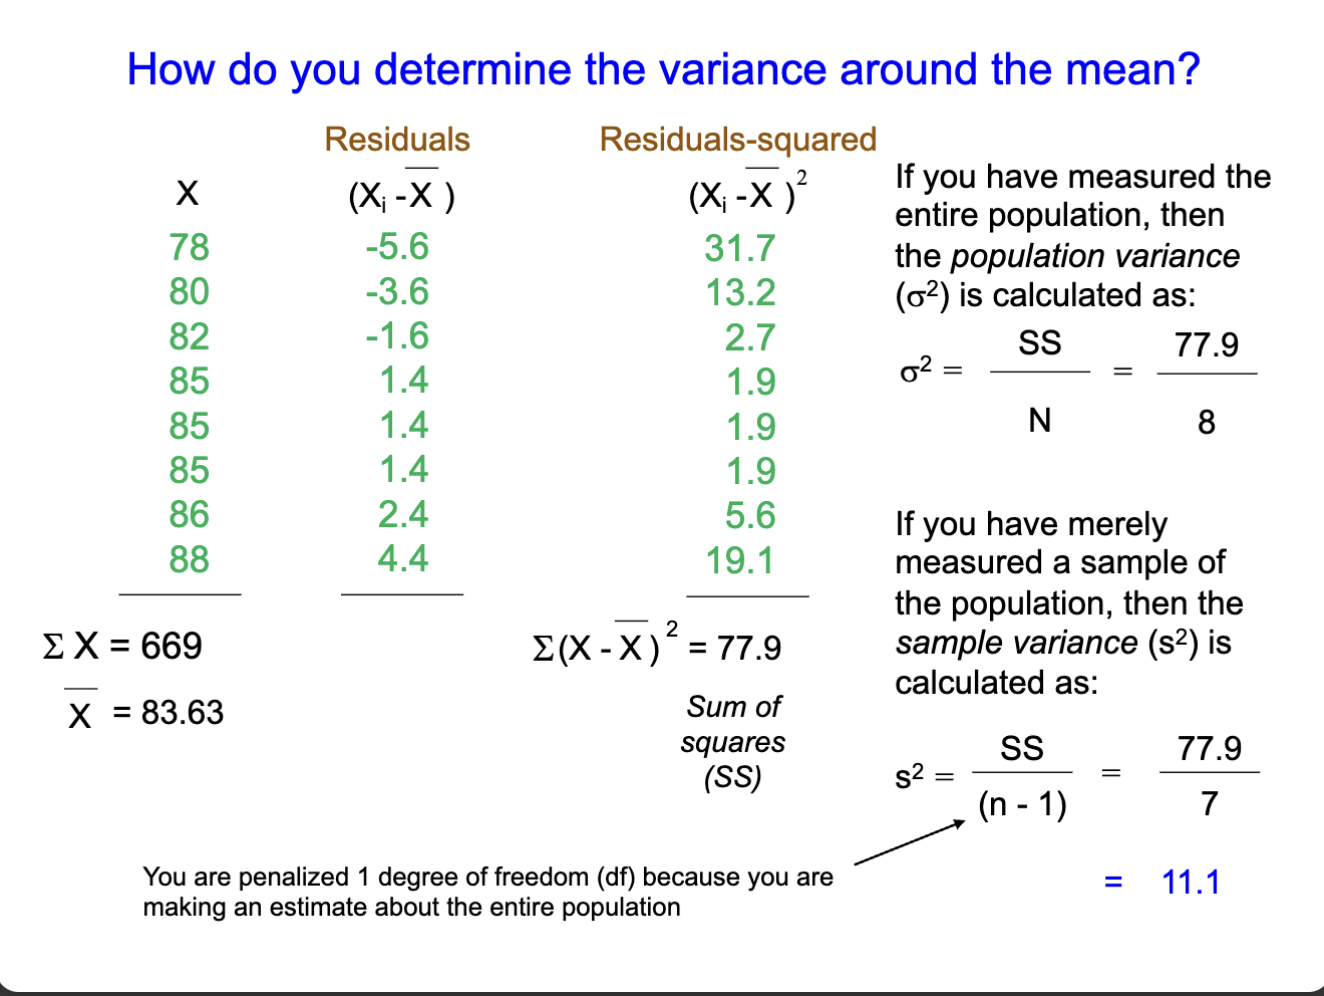
How do you calculate population variance around the mean?
(σ²) = SS/ n (if you measure the ENTIRE population)
σ² = Population Variance
SS = Sum of Squares
n = population
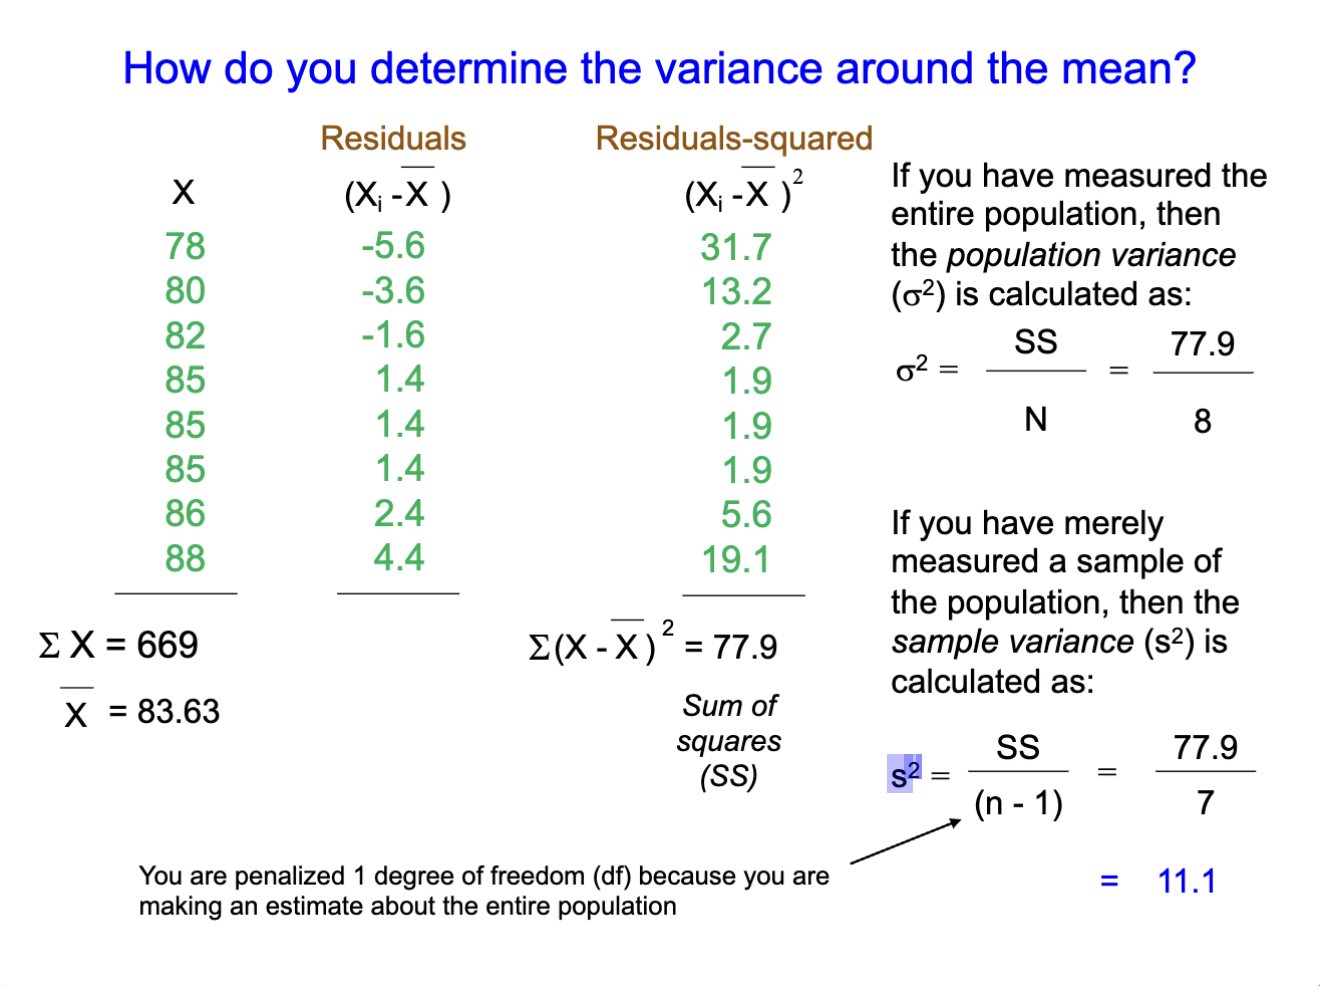
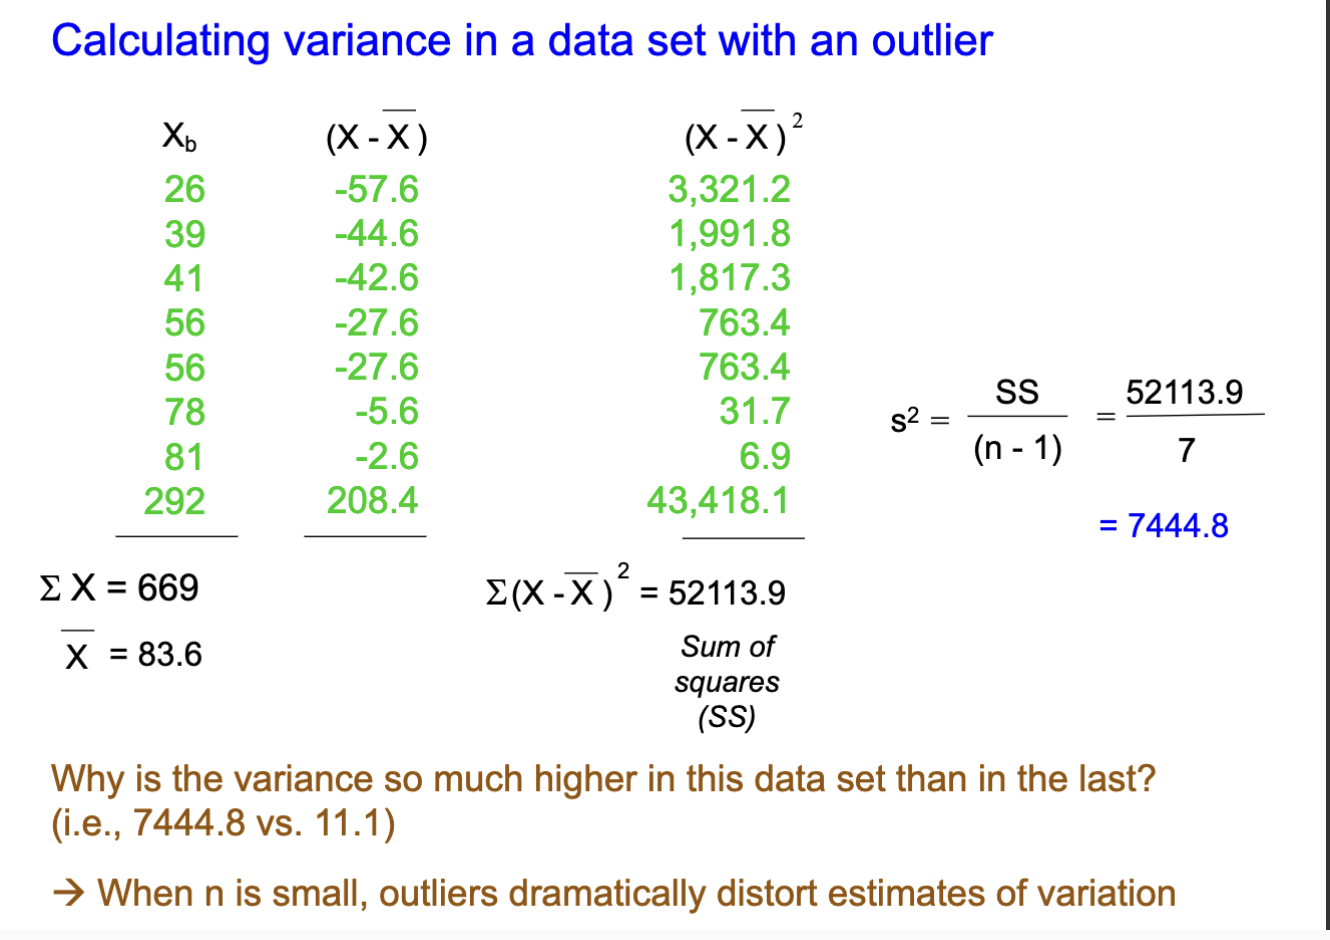
How do you measure sample variance around the mean?
s² = SS/ (n-1) {1 degree of freedom is taken away because you are making an ESTIMATE for the entire population}
s² = Sample Variance
SS = Sum of Squares
n = population
How do you calculate sample variance with an outlier in the data set?
Same as you would calculate it for a sample variance , just keep in mind that when n is small, the outliers can dramtically distort the estimates of variation.
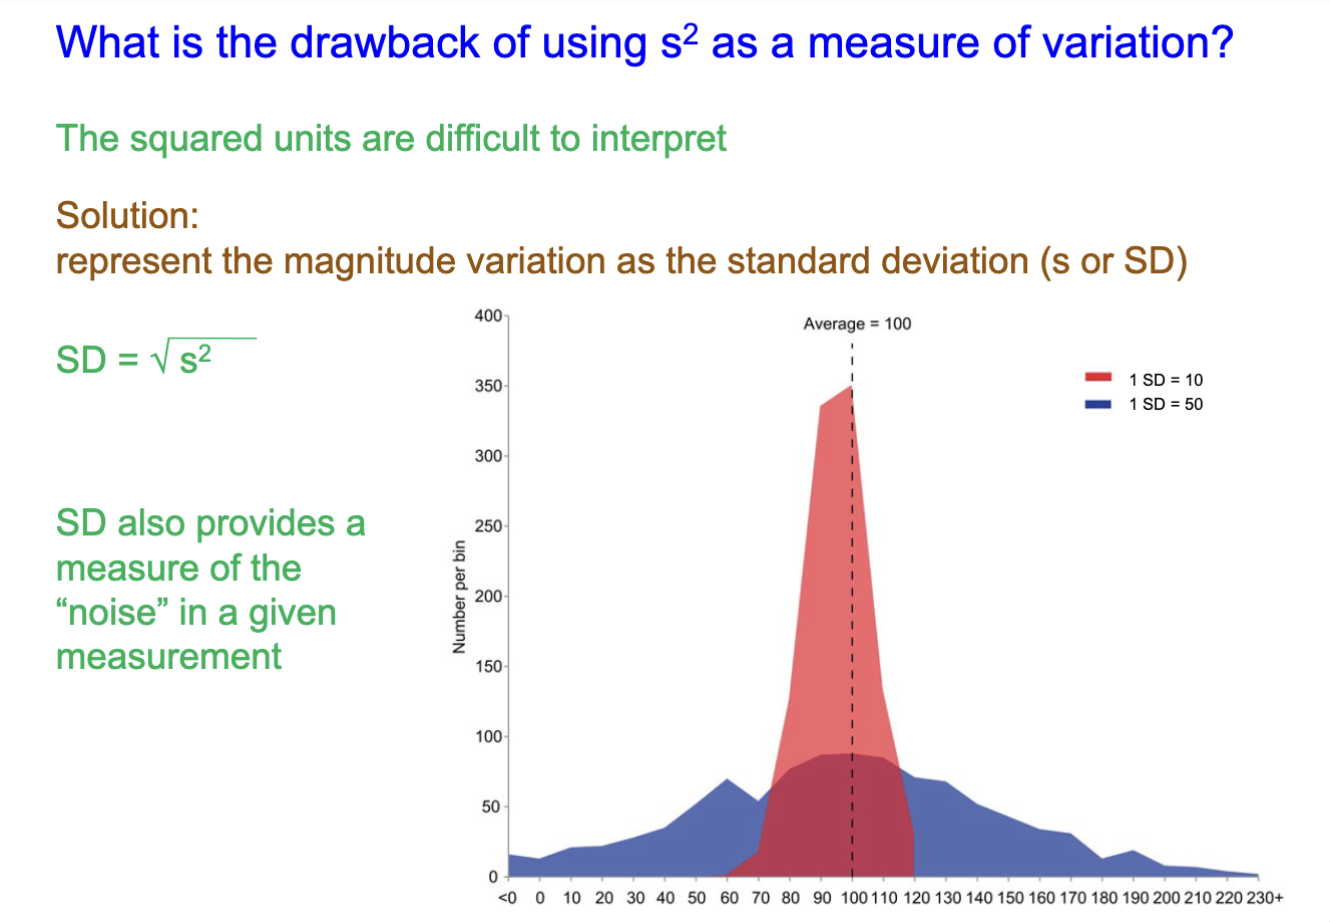
What is the drawback to using S² as a measure of variation?
Squared units can be difficult to interpret, so the solution is to represent the variation in magnitude as SD.
SD= √s²
SD/ s = Standard Deviations
s² = Sample Variance
SD can give a measure of the noise in a given measurement
What are the characteristics of SE or SEM that make it more preferable?
1) SE is smaller than SD
2) SE decreases with increasingly sample size
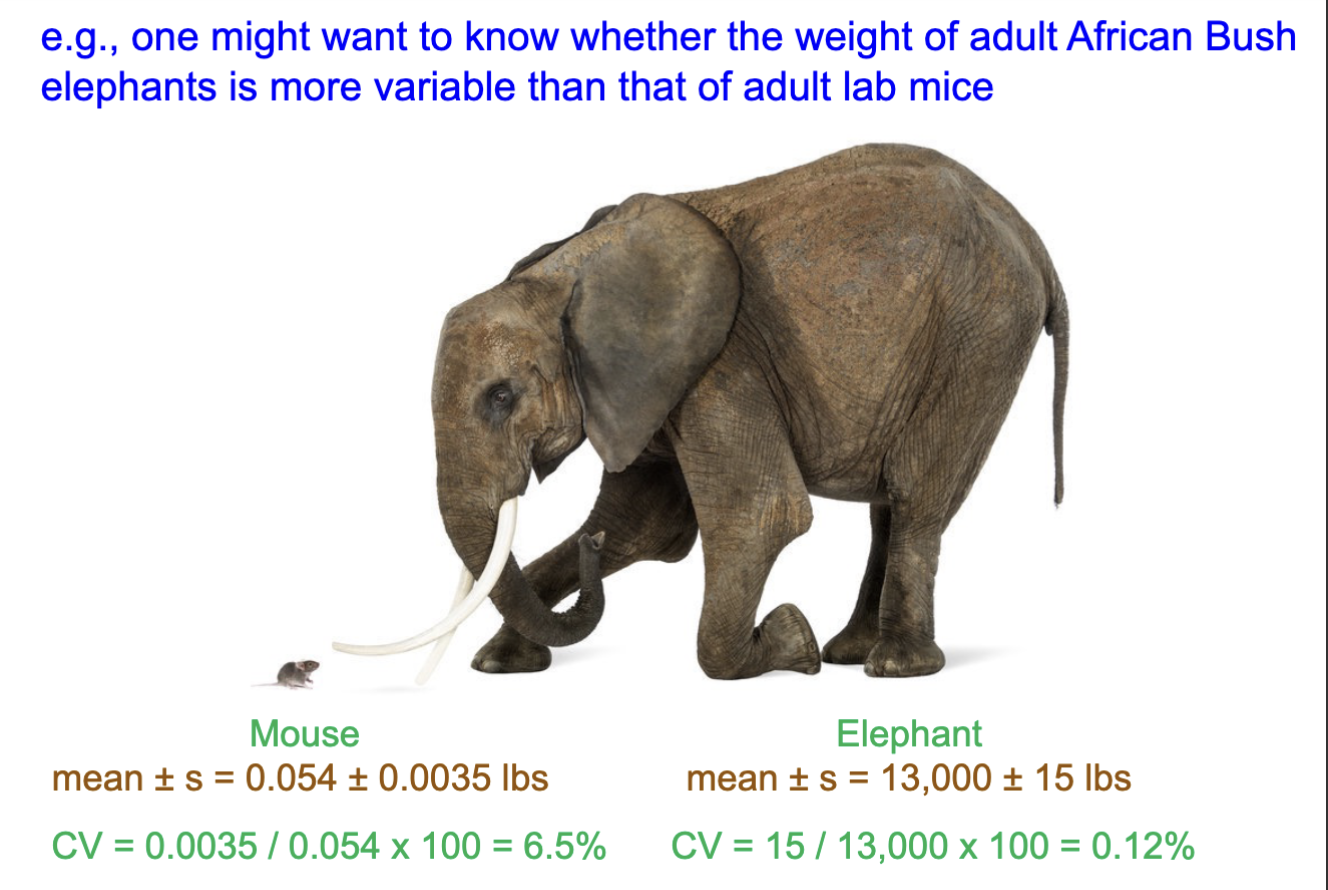
What is the problem with both SE or SEM (standard error) and SD/s (standard deviation) and how can you fix it
They tend to increase with the size of the mean. You can fix this by dividing the the SD (or s) by the mean to get:
CV= ( s / X ) (100)
CV= Relative Variation
s= Standard Deviation
X= mean
What is another way to write Standard Deviation (SD)?
s (lowercase)
What is another way to write Standard Error (SE)
SEM (Standard Error of Means)
What is the confidence Interval (CI) and what are the benefits to using it?
Range of values that contain the true value of an unknown population parameter
Virtue: Bars can directly illustrate if the two means differ significantly
Downside: Bars are large and make data look noisy
How do you find 95% CI?
95% CI = (Z score) (standard error)
What are some commonly used z scores for confidence intervals?
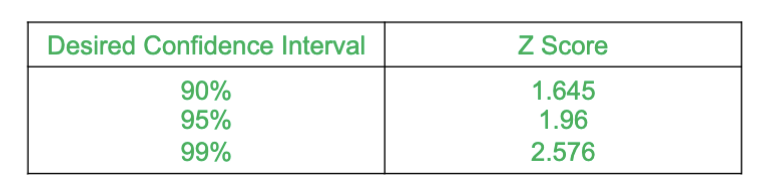
95% CI = (Z score) (standard error)
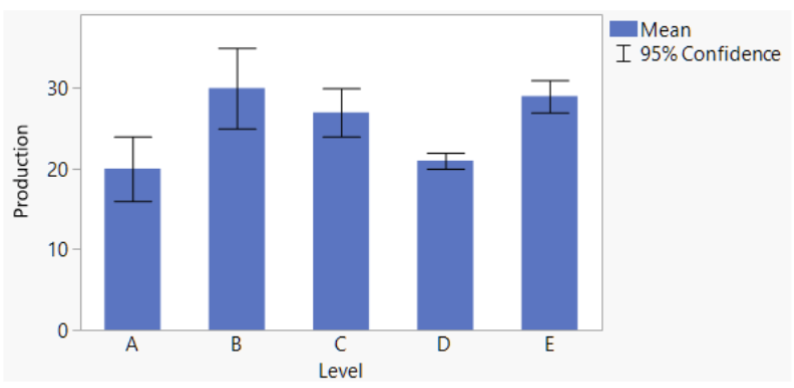
Which means differ significantly from one another?
No overlap of error bars = significant difference
D with B, C, and E with A
A vs B → significant
A vs E → significant
D vs B → significant
D vs E → significant
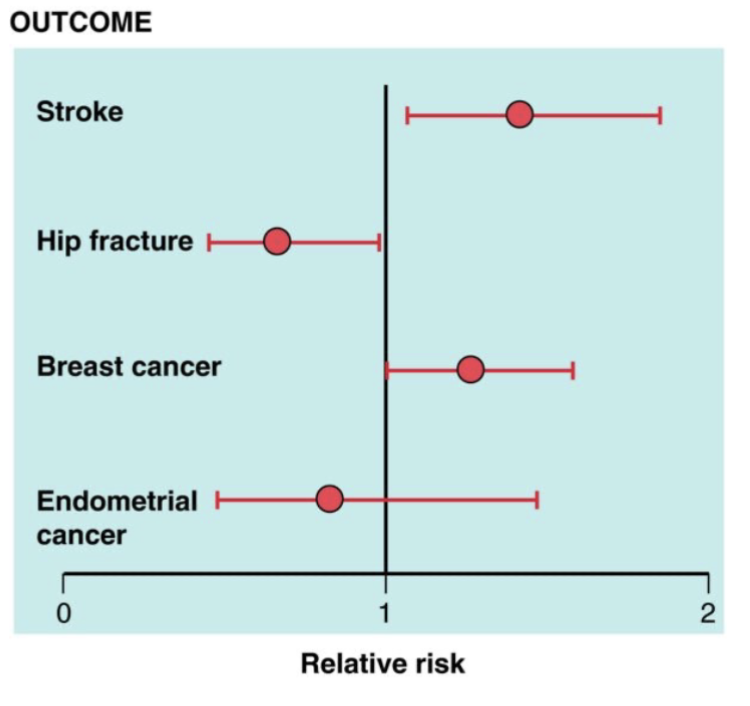
Which outcomes differ significantly at the 0.05 level from 1?
The baseline is 1
Stroke is significant because it is above 1
Break Cancer is significant because it is above 1
Hip Fracture is significant because it is below 1
Endometrial Cancer is not significant because it crosses. 1 (no effect line)
What is used to represent data that lacks normal distribution of scores?
Box and Whisker Plot (numerical data with the median interquartiles and min max values)
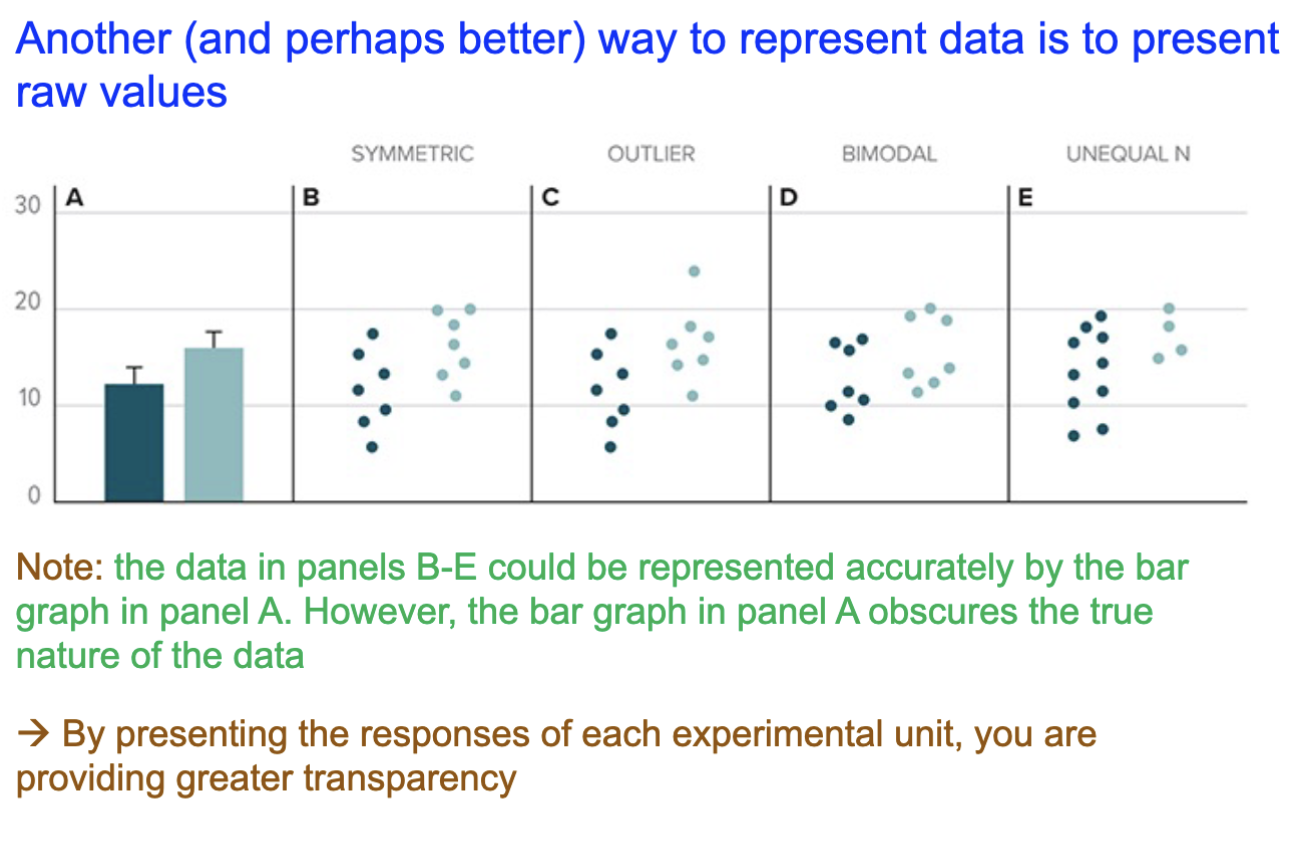
What is a better way to represent data values?
Present the raw values, turning into a bar graph obscures that nature of the data. Also, presenting the responses for each experimental unit as is provides greater transparency.