5. Visualization Design
1/29
There's no tags or description
Looks like no tags are added yet.
Name | Mastery | Learn | Test | Matching | Spaced | Call with Kai |
|---|
No analytics yet
Send a link to your students to track their progress
30 Terms
What is the purpose of visualization design?
To move systematically from a visualization problem to a visualization solution by understanding data, tasks, constraints, and iterating through structured design processes.
What is the DIKW hierarchy and why is it relevant?
It describes the progression from Data → Information → Knowledge → Wisdom. Visualizations often aim not to show raw data but to help extract information from it.
What is the difference between visualizing data vs. visualizing information?
Raw data visualizations (e.g., plain parallel coordinates) often overplot and hide structure, whereas information visualizations apply transformations (e.g., bundling) to reveal patterns.
What is the purpose of data abstraction?
To describe data independently of domain.
This enables expressive visualizations that show the data and only the data (e.g., no interpolating categorical data).
It also lets designers look up known visualization techniques, reuse solutions across domains, and reason systematically about design choices.
What is the difference between data context and data content?
Data context = reference space/independent variables (e.g., location, time)
Data content = measured values/dependent variables (e.g., temperature, wind)
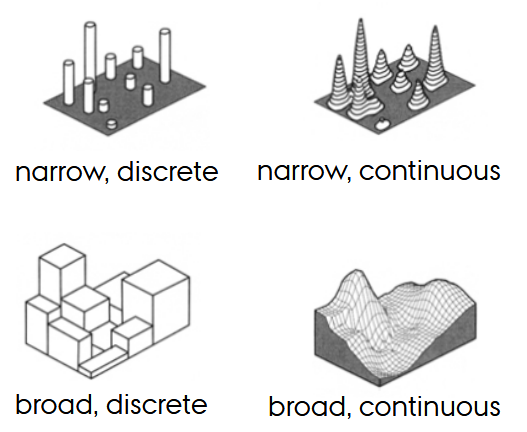
What is the “extent of validity” in the data context?
How far a measured value remains valid (point, narrow local, broad local, global) and whether interpolation is meaningful.
What is Shepard’s method (inverse distance weighting)?
An interpolation method that estimates unknown values by weighting nearby observations inversely by distance, controlled by parameter p.
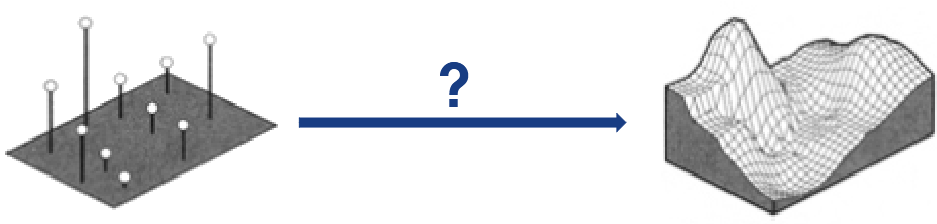
How does the power parameter p influence interpolation in inverse distance weighting?
The power parameter p controls how strongly distance influences the weights:
low p yields smooth, globally averaged interpolation
high p emphasizes nearest neighbors and produces sharp, localized boundaries
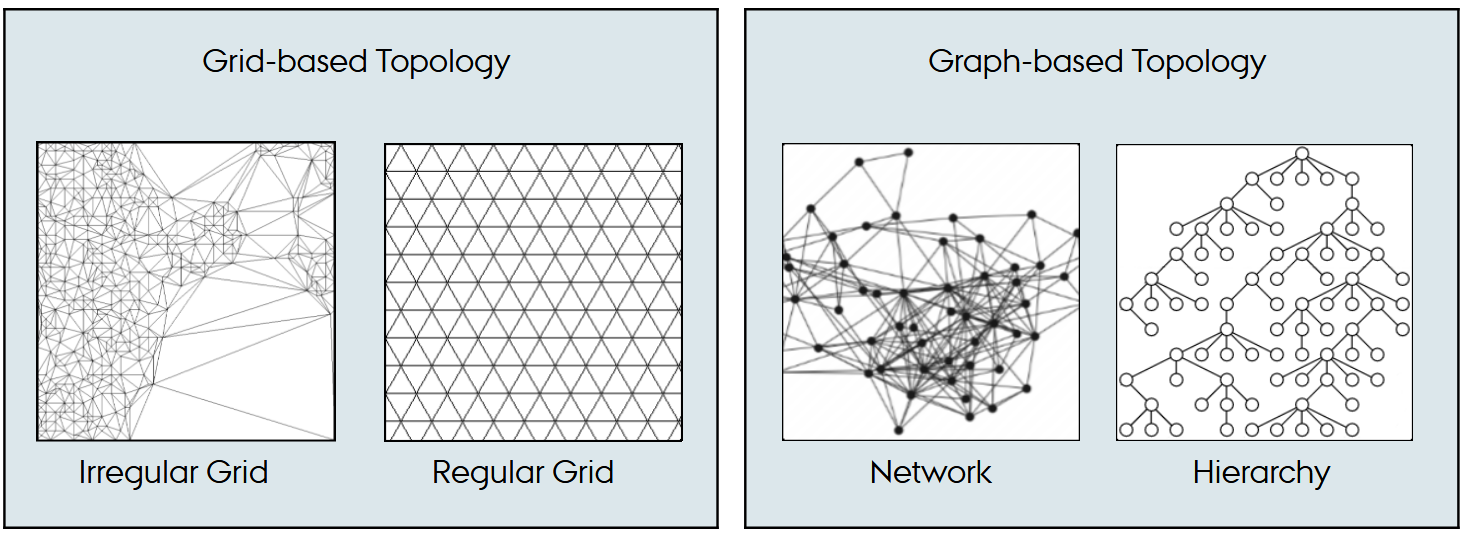
What is data topology, and what topology types can data be organized in?
Data topology describes how data items are connected in space - so it determines which operations are valid.
Grids allow interpolation and spatial reasoning; graphs allow traversal and connectivity reasoning.
What are scalar, vector, and tensor data?
These terms describe how many values are produced by one observation and how they relate to each other.
Scalar = one magnitude (e.g., color)
Vector = magnitude + direction (e.g. wind = speed + direction)
Tensor = multiple magnitudes/directions (e.g., MRI, multiple flow directions at each location); requires specialized visualization
Why do we perform task abstraction?
To understand what users want to do with the data - independent of domain details or specific interactions (trend? comparison? outliers?)
Enables the design of effective visualizations.
What is a task in the visualization context?
A mid-level abstraction between goal (why) and interaction actions (how) - e.g., “overview”, “zoom/filter”, “details-on-demand”.
What is the difference between unipolar and bipolar tasks?
Unipolar tasks have no natural opposite (e.g., validate); bipolar tasks come in oppositional pairs (add/remove, locate/identify, undo/redo).
What is the difference between identify and locate tasks?
Identify = given a position, find the value
Locate = given a value, find where it occurs
What are synoptic tasks?
Tasks that describe sets of items (e.g., trends, distributions), rather than individual data points - basically, they’re extensions of elementary tasks.
Give an example of synoptic lookup vs. elementary lookup.
Elementary: “What was the value on this date?” (data)
Synoptic: “What was the trend during this interval?” (information)
What is a relation-seeking task?
A task where the user seeks pairs/sets of items satisfying a specified relation (e.g., “When did the price triple?”)
What do we gain by combining data and task abstraction?
A full definition of the visualization problem that is domain-independent and enables both expressiveness and effectiveness.
What is the Design Activity Framework?
A four-stage process: Understand → Ideate → Make → Deploy, guiding the entire visualization design workflow.
What is the purpose of the “Understand” stage in the Design Activity Framework? What happens if it’s done incorrectly?
To derive visualization requirements by studying users, data, tasks, constraints.
Outcome: a clear visualization problem specification.
If the visualization problem is misunderstood or poorly defined, the visualization will solve the wrong problem.
What is the purpose of the “Ideate” stage in the Design Activity Framework?
To generate many externalized visualization ideas (sketches, mockups) that satisfy the requirements.
What is the purpose of the “Make” stage in the Design Activity Framework?
To turn promising visualization ideas into tangible, testable prototypes.
Previous stages focused on understanding the problem and ideating solutions, so now we focus on concretizing ideas so we can evaluate them with users before full implementation.
What is the purpose of the “Deploy” stage in the Design Activity Framework?
To create a fully functional visualization system that works with real data in real settings using software engineering practices.
What is the 5 Design Sheet Method used for?
For ideation - systematically developing, combining, and selecting visual ideas across 5 structured sheets.
What happens on Sheet 1 of the 5DS method?
Brainstorm 15-20 ideas, filter them, cluster similar ideas, combine/refine across clusters, then choose 3 to continue with.
What do Sheets 2-4 contain in the 5DS method?
Three detailed alternative designs, each with: information section, layout sketch, interactions, focus point, pros/cons.
What is Sheet 5 in the 5DS method?
Sheet 5 in the 5 Design Sheet method is the Design Realization sheet, where the final chosen idea is detailed in terms of algorithms, dependencies, requirements, and estimated implementation effort.
It moves us from ideate to make in the design activity framework.
What are the four guiding design principles?
Functional design: first create something useful, then make it beautiful.
Deliberate design: do not include any visual feature without justification.
Intuitive design: the visualization should not be more complex than the underlying data.
Ethical design: do not visualize to deceive the reader or viewer.
Together, these ensure usefulness, purpose, simplicity, and honesty.
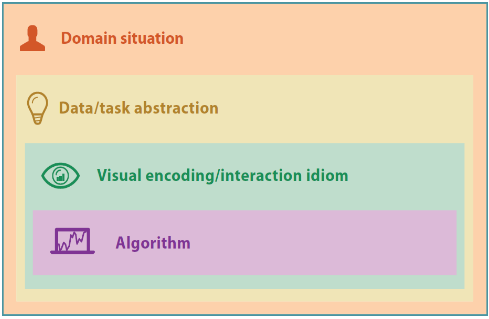
What is Munzner’s Nested Model?
A model describing four design levels (domain problem, data/task abstraction, encoding idiom, algorithm) and how to evaluate issues at each level.
What evaluation methods correspond to the Nested Model levels?
Domain situation: interviews, field studies - does the visualization actually address user needs, and do they use it?
If users don’t use the system, the problem is likely at this level.
Data/task abstraction: check task/data alignment - does the chosen data abstraction match the domain, and do the tasks support the users’ goals?
Wrong visualization?
Visual encoding / interaction idiom: user studies - is the visualization design effective for the tasks?
Most common level for visualization evaluation.
Algorithm: performance benchmarks, complexity analysis - does the system run efficiently and correctly?
Performance issues belong here - not at the design level