Module 6 - Correlation & Regression
0.0(0)
Studied by 12 peopleCard Sorting
1/44
Earn XP
Description and Tags
Last updated 10:40 PM on 12/11/22
Name | Mastery | Learn | Test | Matching | Spaced | Call with Kai |
|---|
No analytics yet
Send a link to your students to track their progress
45 Terms
1
New cards
Correlation
relationship between two continuous variables, measure degree data points cluster around regression line
2
New cards
Line of Best Fit
show general pattern of relationship between dependent & independent variable
3
New cards
Correlation Coefficients
measure direction & magnitude of relationship between independent & dependent variable
4
New cards
Magnitude of Association
Numerical value of correlation coefficient, show strength of association, 0 = no linear association, -/+ 1 = perfect linear association
5
New cards
Direction of Association
If correlation coefficient positive or negative, show directionality of relationship (pos or neg correlation)
6
New cards
Pearson Correlation
measure degree of relationship between linear related variables
7
New cards
Assumptions of Pearson Correlation
scale measurements, normal distribution, 2 variables = paired, no outliers, linearity, homoscedasticity
8
New cards
Linearity
straight line relationship between 2 variables, as x increase -> y increase/decrease, check with scatter plot visualization
9
New cards
Homoscedasticity
equal spread of data around line of best fit, data = homoscedastic or heteroscedastic, check with scatter plot
10
New cards
r
correlation coefficient
11
New cards
Spearman's Rank Order Correlation
Non-parametric Pearson's correlation, ranks data to explore relationship between 2 variables
12
New cards
Assumptions of Spearman's Rank Order Correlation
scale/ordinal data, any distribution, linear relationship between variables
13
New cards
Intraclass Correlation Coefficient (ICC)
used to evaluate inter-rate reliability, test-retest reliability & intra-rater reliability; for data structured as groups (not pairs)
14
New cards
Inter-Rater Reliability
variation between >=2 raters, measuring same event
15
New cards
Test-Retest Reliability
variation in 2 measurements under same conditions
16
New cards
Intra-Rater Reliability
variation within 1 rater across >= 2 trails
17
New cards
Factors Impacting Correlations
Restricting Data Range (can sometimes be good), Heterogenous Samples, Outliers (alter correlation)
18
New cards
Clinical use of correlation
reliability to clinical assessments tools, impact medical decision making
19
New cards
Regression
also explore relationship between variables, how explanatory variable impact response variable
20
New cards
Response variable
variable you are predicting, outcome/dependent/y variable
21
New cards
explanatory variable
variable you use to predict, x/independent variable
22
New cards
residuals
distance observed y lies from regression line
23
New cards
epsilon
error term, represent residual
24
New cards
beta 0
y-intercept
25
New cards
beta 1
slope of regression line
26
New cards
Least Squares Method
regression - chooses values of y-intercept & slope that minimize sum of squared residuals
27
New cards
what does a lower squares value mean?
smaller difference between data points & line of best fit
28
New cards
Regression Assumptions
scale data, residuals of regression line are normally distributed, no outliers, linear relationship between 2 variables, data = homoscedastic
29
New cards
Least Squares Regression Model
Sum of residuals = 0, line of best fit passes through mean of x & mean of y
30
New cards
R square
coefficient of determination, amount of variation in y explained by x
31
New cards
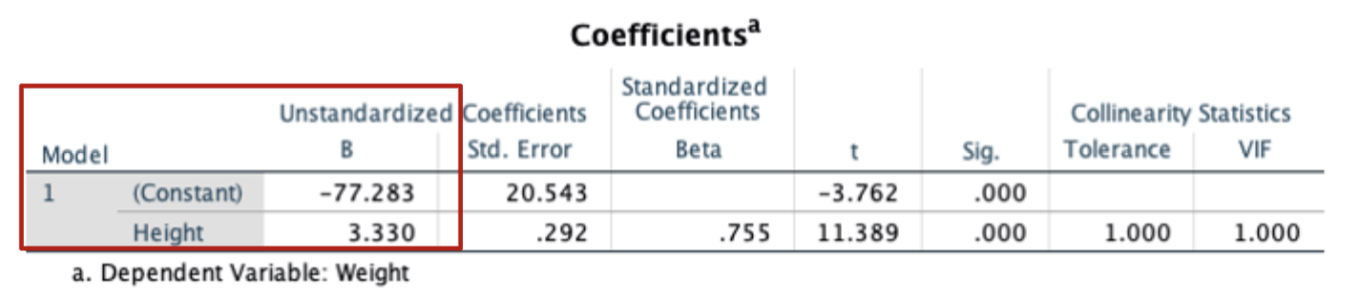
interpret image coefficients
y-intercept = -77.283, slope = 3.33
32
New cards
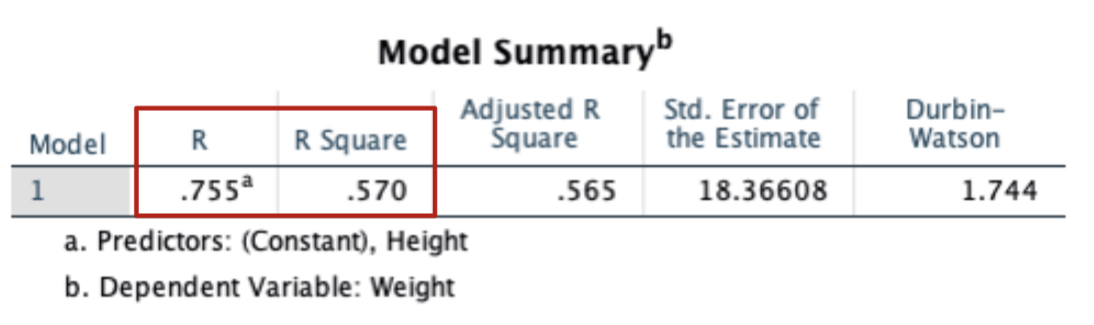
Interpret model summary
R = simple correlation between variables, 57% of variation of y is explained by X
33
New cards
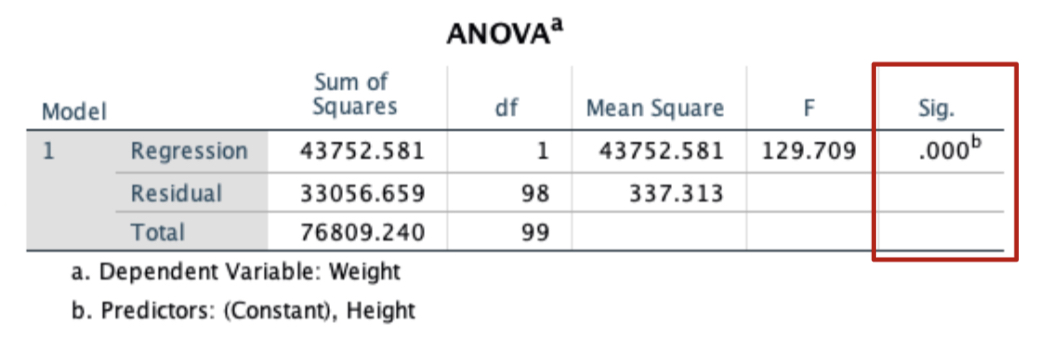
Interpret ANOVA results
model significantly predicts y
34
New cards
r squared characteristics
always positive, as approached 0 = low variation in Y determined by x, max = 1 (all variability in y is determined by x
35
New cards
Linear Regression
1 explanatory & 1 response variable, scale measurements
36
New cards
Multiple Linear Regressions
1 response variable, >1 explanatory variable, scale measurements
37
New cards
Logistic Regression
1 explanatory variable, 1 response variable (dichotomous)
38
New cards
statistical significance
probability of event occurring due to random chance
39
New cards
clinical significance
event/difference is meaningful for a clinical reason
40
New cards
biological significance
whether finding has biological relevance
41
New cards
Data reproducibility
ability to reproduce/replicate findings
42
New cards
Replication crisis
our current inability to reproduce scientific results
43
New cards
causes for replication crisis
publication bias, bad study design & power, questionable research practices
44
New cards
Questionable Research Practices
p-hacking, selective reporting, sampling bias, HARKing ( Hypothesis After Result is Known)
45
New cards
Solutions to replicability crisis
preregistration of studies, replication studies, open science, alternative statistical approaches, education