POPULATION DYNAMICS
1/57
Earn XP
Description and Tags
Chapter 11 and 12
Name | Mastery | Learn | Test | Matching | Spaced | Call with Kai |
|---|
No analytics yet
Send a link to your students to track their progress
58 Terms
Population size (N)
The number of individuals of the same species living within a specific geographical area
Population density (Dp)
# of individuals per unit of volume or area
Crude Density
Number of individuals of the same species per total unit area or volume.
Ecological Density
Number of individuals of the same species per unit area or volume actually used by the individuals
ESTIMATING POPULATION SIZE AND DENSITY
1. Transects: population is sampled along a long rectangular area or line. Width dependent on whether organism is sessile (stationary) or mobile. Useful for low density species, or if organisms are very large.
2. Quadrats: quadrats of a known size are placed at random sites in an area and the number of individuals within the boundaries are counted. Good for sessile or organisms that move very little.
3. Mark-Recapture: animals are trapped, marked/tagged, released and at a later date the same traps/nets are set and a comparison is made on the proportion of marked to unmarked animals.
Pop. Size (N) = (# of originally marked) X (# individuals in recapture) / (marked individuals in recapture)
ESTIMATING POPULATION SIZE USING QUADRATS
Dp = N/A
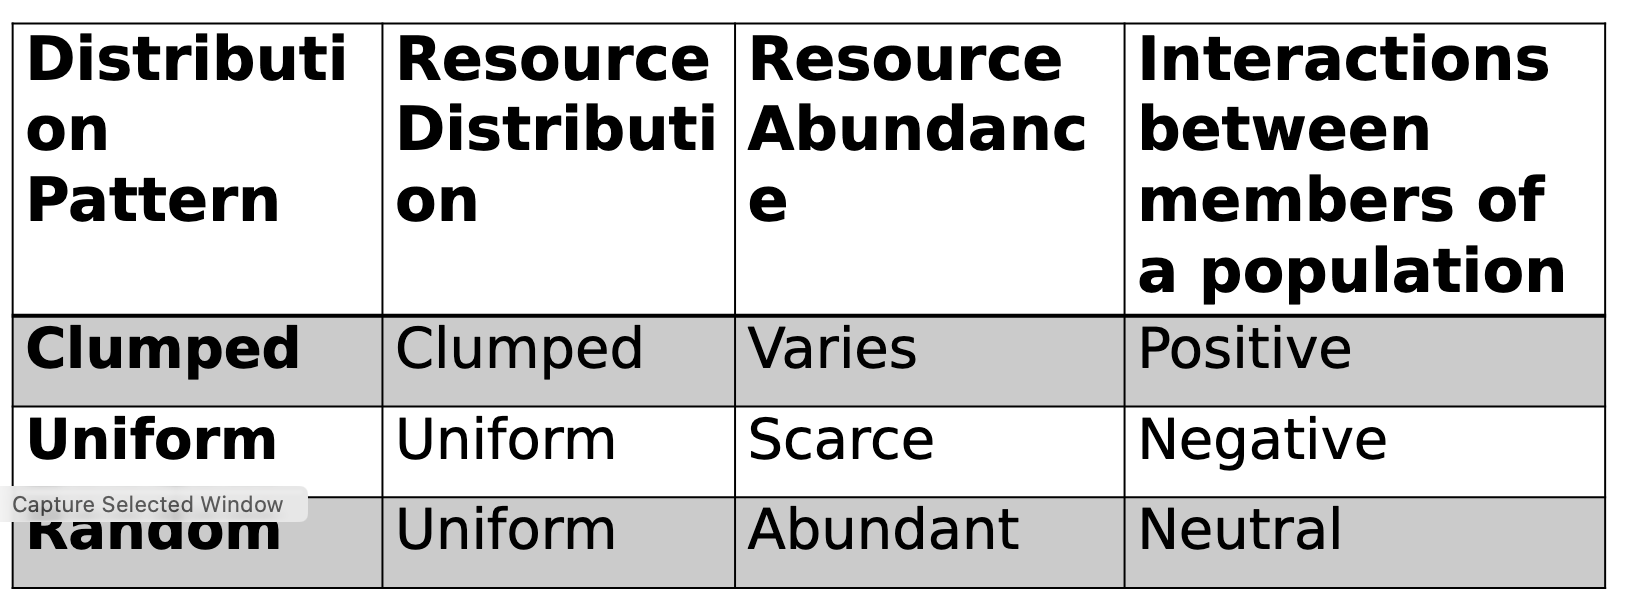
POPULATION DISTRIBUTION:
• influenced by the distribution of resources and the interactions among members of a population or community.
a) Uniform dispersion (competition causes territories to be set up) or farmers fields, orchards, etc.
b) Random dispersion (pattern less)
c) Clumped dispersion (most populations)
POPULATION DISTRIBUTION
POPULATION DISTRIBUTION
• Distribution Patterns are fluid and can change with the seasons or even during the course of a day. Patterns change due to complex interactions between behaviours and other characteristics that increase each individual’s chances of reproduction and survival.
• Life History: The survivorship and reproductive patterns shown by individuals in a population. Life histories include age of sexual maturation, how often it reproduces, # of offspring it produces, life span
TWO MAIN MEASURES TO DESCRIBE LIFE HISTORY
1. Fecundity: Average # of offspring produced by a female over her lifetime. Usually the # of offspring is inversely related to the amount of care parents provide.
TWO MAIN MEASURES TO DESCRIBE LIFE
HISTORY:
2. Survivorship: the proportion/percentage of individuals in a population that survives to a given age. Scientists use a cohort to study this.
-Type I survivorship: high rate of juvenile survival, individuals live until sexual maturity and beyond. E.g. Human
-Type III survivorship: most individuals die as juveniles, only a few live long enough to produce offspring however these will produce many offspring. E.g. oyster
-Type II survivorship: Between Type I & III-the risk of mortality is constant throughout an individual’s lifetime
WHY DO CHANGES IN POPULATION SIZE OCCUR?
Humans tend to move more than most species, so when ecologists study population sizes in non-human populations, immigration and emigration are estimated to be roughly equal.
Change in Pop. Size = # of births — # of
deaths
∆N = B – D
If immigration & emigration are included:
∆N = [B + I] – [D + E]
RATE OF POPULATION GROWTH
• important to study so it can help ecologists make management decisions (whether increasing or decreasing).
gr = ∆N/∆t (∆N = N2 – N1)
• Per capita growth rate (cgr):
cgr = ∆N/N
POPULATION GROWTH MODELS
Biotic Potential: the highest possible per capita growth rate for a population determined by:
• # of offspring per reproductive cycle
• # of offspring that survive long enough to reproduce
• Age of reproductive maturity
• # of times the individuals reproduce in a life span
• The life span of the individuals
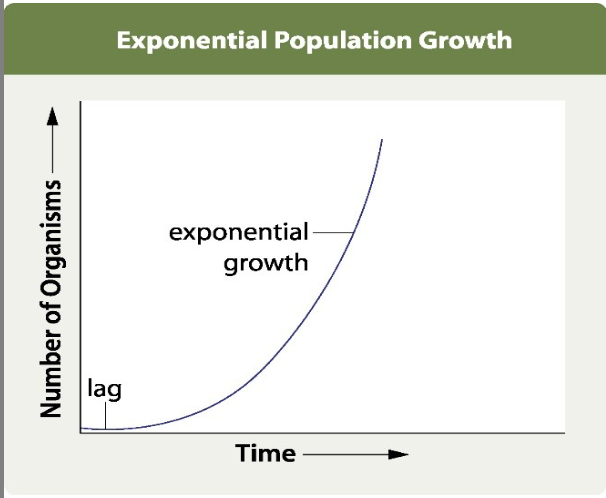
Exponential Growth:
growth pattern exhibited by a population growing at its biotic potential, has characteristic J-shaped growth curve
ex. bacteria, micro organisms, small invertebrates, plants
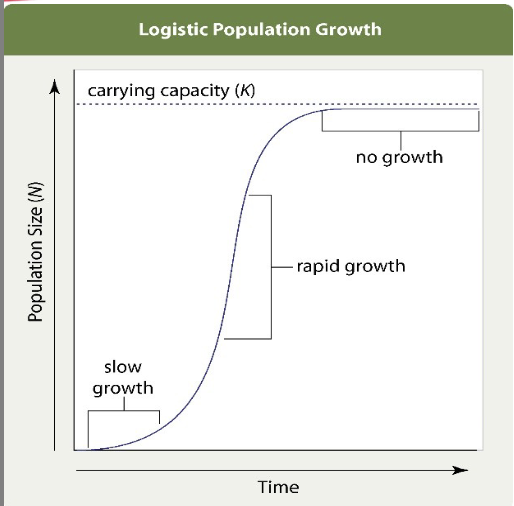
Logistic Growth
Limited resources, slow initial growth, rapid growth, then stabilizing population as the carrying capacity of the population is reached
LIFE STRATEGIES
When an organism makes trade-offs to maximize the number of offspring that survive. Ecologists have identified two types of life- strategies:
r-selected strategy
K-selected strategy
LIFE STRATEGIES
r-selected strategy: olive close to their biotic potential (r) and therefore these organisms usually have a short life span
become sexually mature at a young age
produce large broods of offspring
provide little or no parental care to their offspring
ex. insects, plants, algae
LIFE STRATEGIES
K-selected strategy:
live close to the carrying capacity (K) of their habitats and therefore these organisms have a relatively long-life span
become sexually mature later in life
produce few offspring per reproductive cycle
provide a high level of parental care
ex. mammals, birds
DENSITY-INDEPENDENT FACTORS
abiotic factors that change population growth without regard to population density.
e.g. weather changes, human intervention, floods, droughts, hurricanes
DENSITY-DEPENDENT FACTORS
biotic factors that limit population growth and intensifies as the population increases in size.
DENSITY-DEPENDENT FACTORS
• Intraspecific competition: individuals of the same species or population compete for the same resources.
- e.g. if a forest has a carrying capacity of 85, and if pop. greater, results in competition & stronger deer will be able to obtain food, and weaker deer will die or move away.
• Interspecific competition: 2 or more populations compete for limited resources. Competitive Exclusion Principle states that two species with overlapping niches cannot coexist.
-driving force of evolutionary change
-may result in resource partitioning (using different resources within a habitat)
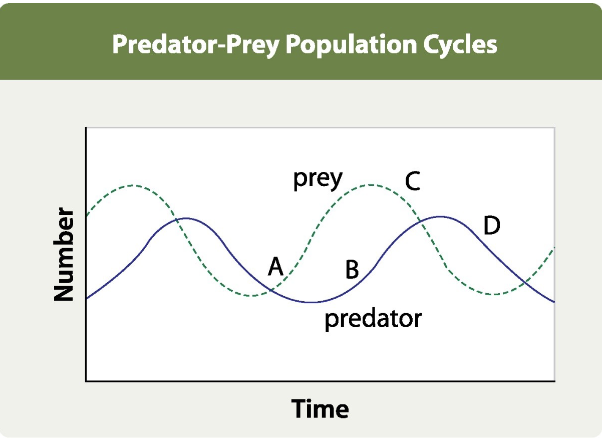
POPULATION CYCLES:
Predator-prey interactions that result in altering periods of large and small population sizes. Sinusoidal growth.
An increase in prey increases the resources that are available to predators (A), so the predator population increases (B). This leads to a reduction in the prey population (C), followed by a reduction in the predator population (D). The cycle repeats itself over time.
DEFENSE MECHANISMS
For protection against predators some species have evolved protective colouration:
o Camouflage
o Warning Colouration
o Mimicry:
• Batesian mimicry: palatable or harmless organisms mimics an unpalatable or harmful organism. i.e. moths, butterflies
• Müllerian mimicry: unrelated species that resemble one another and are both poisonous or
SYMBIOSIS (“LIVING TOGETHER”):
• an ecological relationship between two species living in direct contact, the symbiont (which lives or feeds in or on another organism-the host).
• There are 3 forms of symbiosis:
1. Parasitism
2. Mutualism
3. Commensalism
Parasitism
symbiont (the parasite) benefits at the expense of the host. E.g. Mistletoe, viruses etc.
Mutualism
both organisms benefit, neither harmed.
• E.g. Lichens (alga + fungi), hermit crab & sea anemone
• bacteria in guts of cows, deer (forms of obligatory mutualism where neither could grow/live without the other)
Commensalism
one organism benefits, and the other is
unaffected.
• i.e. lemon shark & remora, cattle egret & large mammals-
What type of life strategy do humans exhibit
K-selected species. Humans have a small number of o"spring, begin reproduction later in life, and provide a great deal of parental care to their o"spring.
demography
The study of statistics related to human populations, such as population size, density, distribution, movement, births, and deaths
Describe human population growth over time
The human population was relatively stable until recent times. Then, starting around the 1700s, the population began to grow at an exponential rate. Population size and growth were regulated by factors that affect other populations, such as food availability, disease, and predators. The slight dip in the population from 1347 to 1350 shows the decrease in the population due to bubonic plague. The plague killed an estimated one third of the population of Europe. A short time after the plague, the population started to grow exponentially. This explosive growth was due to a variety of technological factors.
Factors that affect human population growth
Advancements in technology (from stone age to industrial revolution)
- 1700s → improved agricultural methods
- 1800s-1900s → Advancements in medicine treated
people for illnesses
Improvements to shelter, food storage, and quality of life has led to an increase in carrying capacity for humans
Doubling time
The time it takes for a population to double in number
Ex: Human population took ~200 years from 1650 to double in size from 500 million to 1 billion
Between 1930 and 1975, the population doubled from 2 to 4 billion.
Developed countries (Canada, US, Western Europe, etc.) are growing in population slowly.
Developing countries (Mexico, Honduras, Congo, etc.) are growing in population faster.
Population pyramids
A type of bar graph that shows the age distribution in a population, which demographers use to study a population
Kenya’s triangular population pyramid shows a large young population and high fertility, meaning rapid future growth, with nearly half the population under 15. In contrast, Sweden’s rectangular pyramid shows a stable population, with only 16% under 15 and a much lower fertility rate.
Triangle Shape (More young than old people)
- Future of explosive growth
- Large population portion will enter their reproductive years at the same time.
- Indicates decreased lifespan as graph reaches top.
Rectangle Shape (Mix of ages)
- Population is widely distributed across various ages.
- Lower fertility rate and lower number of offspring (on average) Population Pyramid
Inverted Triangle
- Shrinking population size (More deaths than births).
- Large number of individuals past their reproductive years
Ecological footprint
The amount of productive land that is required for each person in a defined area, such as a country, for food, water, transportation, housing, waste management, and other requirements
Canada has a higher footprint because we are industrialized, have a large population, use lots of energy and land.
Carrying capacity
The carrying capacity of the earth is referred to as the available biocapacity – the amount of humans sustained including the factors of cropland, grazing land, fishing grounds, forest, carbon-absorption areas, and building area.
Comparing ecological footprint of population on Earth to its biocapacity reveals that ecological demand exceeds the supply
Humans exceed the biocapacity of the world and are depleting many resources.
Effect humans might have on resources over time if they continue to exceed the biocapacity of Earth
Resource depletion: Non-renewable resources (like fossil fuels and minerals) will run out, and renewable resources (forests, fish, freshwater) will be used faster than they can recover.
Ecosystem damage: Overuse of land, water, and forests can lead to deforestation, soil degradation, desertification, and loss of biodiversity.
Food and water shortages: Declining soil quality, reduced fish populations, and water scarcity can make it harder to produce enough food and clean water.
Increased pollution and climate change: Excessive resource use increases waste, greenhouse gas emissions, and pollution, worsening climate change and environmental health.
Lower quality of life: As resources become scarce, costs rise, conflicts may increase, and future generations may have fewer resources available to meet their needs.
Why does certain coal burning continue to be the main source of electricity?
Burning coal remains a very effective source of electricity production to this day – it’s very abundant (made from carbon) and costs are relatively inexpensive compared to other energy production methods (renewable, water, nuclear)
Why is the environmental cost of burning coal significant?
The environmental cost for burning coal is very significant as it releases greenhouse gases (primarily carbon dioxide, sulfur dioxides and nitrogen oxides)
Can cause toxic side effects in the environment and in organisms
Damaging ecosystem
Why is mercury so toxic when it enters ecosystems?
• Inside ecosystems, mercury is a very toxic substance as it enters an ecosystem, going into waterways or the atmosphere
• Methylmercury accumulates up a food chain to the top consumers (such as humans)
• Smaller low-level microorganisms can absorb the mercury, and larger high-level organisms (fish, larger fish, etc.) consume the mercury through a food chain.
• This leads to biomagnification – process where a substance increases its concentration in a food chain and is not broken down by environmental processes
biomagnification
The increase in concentration of a substance, such as methylmercury or DDT, that occurs in a food chain and is not broken down by environmental processes.
What is the solution to reducing the effects of burning fossil fuels?
Solutions to reducing the effects of burning fossil fuels include
• Increasing the use of other forms of energy – renewable sources such as wind, solar, geothermal and hydroelectric.
• Becoming energy aware and managing carbon footprint at individual and larger scale
• Reducing harmful pollutants through anthropogenic factor
What is deforestation?
The cutting, clearing, or removal of trees so land can be used as pastureland or cropland.
• Issues of deforestation include:
• Loss of habitat for organisms (less biodiversity!)
• Increase in atmospheric carbon dioxide
• Soil erosion and loss of nutrients
• Disruption of water cycle
Sustainable harvesting
Sustainable Harvesting – Harvesting and using resources (food, energy, wood) acquired from environment at a rate that does not exhaust (deplete) the supply or cause ecological damage.
• How do you think this can help with food security
The issue of over-harvesting fish
Harvesting resources at a rate faster than which it can be replenished. Leads to an overall decrease in the resource, puts the material at risk of depletion.
• Issues with overharvesting fish include…
• Population decline due to industrialized fishing techniques
• Disrupting food webs and aquatic ecosystem biodiversity
• Bycatching (unwanted fish) and trawling
• Can lead to environmental or economic issues for communities
Sustainable methods for providing food
• Providing Foods Using Sustainable Methods
• Making the public aware – using campaigns
• Reducing unregulated harvesting
• Growing , harvesting, and transporting goods sustainably
The issue of oceans being a site for waste disposal
Oceans are a site for waste disposal
• Most of the pollution in waters comes from plastics – human made products that take years to break down.
• Plastic, fishing nets, microplastics contaminate the water, and the debris collects in large patches.
• Sources include cargo, passenger ships, oil platforms, runoff from rivers.
• Plastic is the most dangerous of all contaminants.
Sources of waste
cargo and passenger ships, oil platforms, and runoff from rivers, forms of waste found in the sea, plastic is the most dangerous. This includes plastic such as water bottles and shopping bags as well as fishing line and abandoned fishing nets.
Solution to waste problem
• Increased awareness, behaviour changes, and technology.
• Personal choices in plastic use, new laws can control accumulation of garbage in oceans, clean up of large bodies of water
land disposal
Land Waste Disposal
• Landfills are being filled up with trash
• Reducing the amount of garbage that goes into landfills will help improve the longevity of landfills from being overcrowded.
Accomplished through recycling.
• Purchasing devices that have long lifespan – built to last, will save money and prevent further waste.
• Public awareness
Declining biodiveristy issue
• Biodiversity is the richness of species diversity, as well as the genetic diversity that exists with these species and the diversity of ecosystems.
• Biodiversity stabilizes ecosystems, and helps them bounce back from devastation. Without biodiversity, there is serious risks for ecosystem sustainability.
• Natural events can harm biodiversity.
Importance:
• Life depends on diversity of organisms, since we depend on the services ecosystems provide.
• Water purification, habitat, carbon absorption, regulating climate, etc.
Relationship between biodiversity and spiritual benefits
• Protecting nature/biodiversity provides us with aesthetic, spiritual and psychological benefits.
• Rich in diversity, rich in resources for us to use!
• Emotional linkage between nature and happiness, sense of peace and tranquility, nature provides a sense of comfort for us.
• Cities often include green spaces/parks as peaceful settings → indirect and direct values to maintaining diversity and well-being
Purpose of monocultures
• Specific type of crop grown in a specific area – only one type.
• Growing monocultures will result in a higher crop yield per unit area, but they are very vulnerable to changes (infestation, resistance to pesticides)
• Dependence on only one type of crop can have significant impacts.
• Ex: Irish Potato Famine – fungal disease wiped out the singular crop of potato grown, about 25% of human population starved
Threats to biodiversity and habitat loss
Destruction (Deforestation), Fragmentation, Degradation
• Filling of wetlands, dredging of rivers, mowing of fields
• Habitat fragmentation – construction of roads or water diversions cut into habitat
• Pollution destroys habitats
• Invasive species can out-compete native species to the point where they can be eliminated from the habitat.
Over exploitation
Overexploitation – The excessive harvesting or killing of a species until it no longer exists or is reduced to a very small population
• Fish, Buffalo, Carolina Parakeet
• Slaughtering and destroying populations of species leads to loss of biodiversity
Risks with overexploitation:
1) Extinction of a species – disappearance of all members of a species on earth
2) Reduction below minimum viable population size – the lowest number of individuals that can sustain a population in the wild for a long period of time
Invasive species impact biodiversity
non-native species that relocate to an area and outcompete the native species for resources. No predators means they can reproduce in large numbers. Once established, it’s difficult to remove them, and they can harm ecosystems and economy
Pollutants impacts on biodiversity
Pollutants harm ecosystems and kill off large amounts of organisms. DDT, PCBs, Dioxins threaten biodiversity as they enter food chains and biomagnify – do not decompose
Disease impacts on biodiversity
Genetic biodiversity is threatened when infections and diseases enter an ecosystem.