Success in Jesus Name Fin 411
1/44
There's no tags or description
Looks like no tags are added yet.
Name | Mastery | Learn | Test | Matching | Spaced | Call with Kai |
|---|
No analytics yet
Send a link to your students to track their progress
45 Terms
Market to Book Ratio (aka Price to Book Ratio)
A financial metric used to assess a company's market value compared to its book value. It is calculated by dividing the market price per share by the book value per share,
It tells how much investors are willing to pay for each dollar of the company's assets.
(Also equal to Market capitalization/ total book value)
CML (capital market line)
Is the Capital Allocation Line (CAL) when the tangency portfolio is the market portfolio. So you’re seeing the risk return trade off of a portfolio consisting of a risk free asset and the market portfolio
All the portfolios on the Capital Market Line are a combination of the risk free asset and market portfolio and are perfectly related.
CAL (capital allocation line)
represents the risk return trade offs of a portfolio consisting of a risky asset and a risk free asset. It shows the best combinations of risk and return based on how an investor chooses to proportion their investment in the assets
Sharpe Ratio
The slope of the capital allocation line
It shows the return per unit of risk.
(the higher the sharpe ratio the more return per unit of risk)
SML (security market line)
Is a graphical representation of CAPM and shows the relationship between expected return of an asset and its systematic risk (beta)
if p-value is less than 0.1 you then reject the null hypothesis (alpha=0)
Meaning that the data is statistically significant (meaning alpha is different from 0 and suggesting CAPM mispriced)
αi (alpha)
Intercept (excess returned unexplained by CAPM in regression)
ei (error term)
Idiosyncractic risk (firm specific risk or diversfiable risk)
R Squared
Percentage of variance explained by independent variable in regression
When the M/B is greater than 1
then the firm is a growth firm
When M/B ratio is less than 1
then firm is a value firm (like utilities little growth opportunties)
You should invest in projects that have a ROE>K
Because this means their is attractive profit opporotunties in the project that will enhance the value of a firm
The Basic Assumptions of CAPM
Every market is competitive
We are dealing with a common single period investment horizon
All transactions are tradable
No transaction costs
Investors are rational (meaning they are risk averse and mean-variance optimizers)
All investors face the same frontier and choose the same risk free asset and risky asset (homogeneous expectations)
Make SURE TO
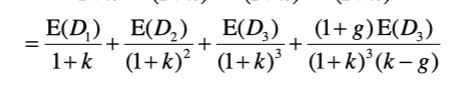
Discount the present value of stage ll dividends by k (just like you did for stage 1 dividends)
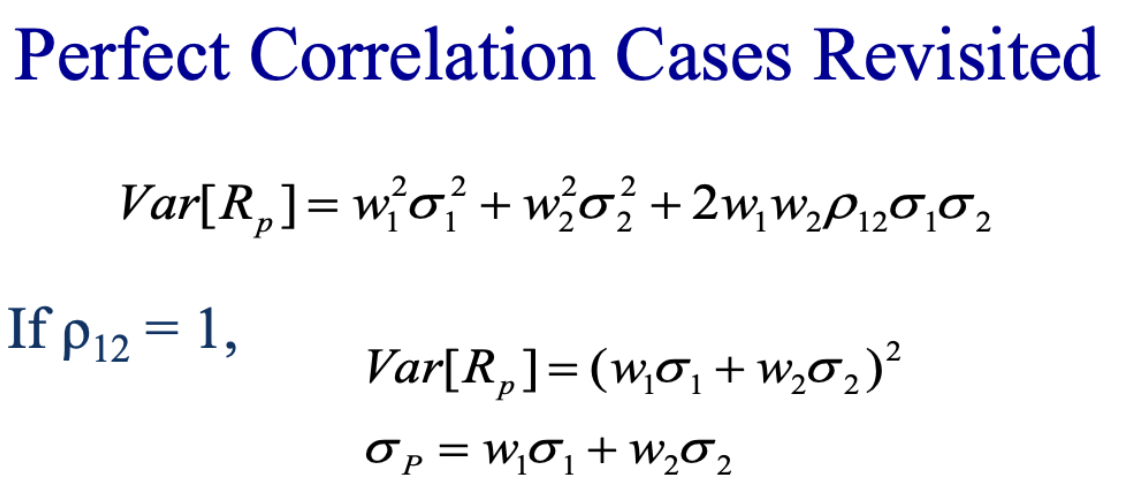
Covariance of I and J
BiBJ*O2m
An efficient portfolio
is a portfolio that has the highest expected return for a given standard deviation
Minimum variance portfolio
is the portfolio that provides the lowest variance (meaning it has the lowest standard deviation) among possible portfolios of risky assets
A portfolio is inefficient (or can be reffered to as being dominated)
if another portfolio combination yields a higher average return with the same standard deviation of returns
Yesu Mukama
sharpe ratio
= risk premium / STD
= (portfolio return - risk free rate) / (portfolio std deviation)
Indifference curves
represent combinations of risk and expected return that give the investor the same level of satification
Optimal portfolio
is one that is along the efficient frontier and tangent (touches) to the indifference curve
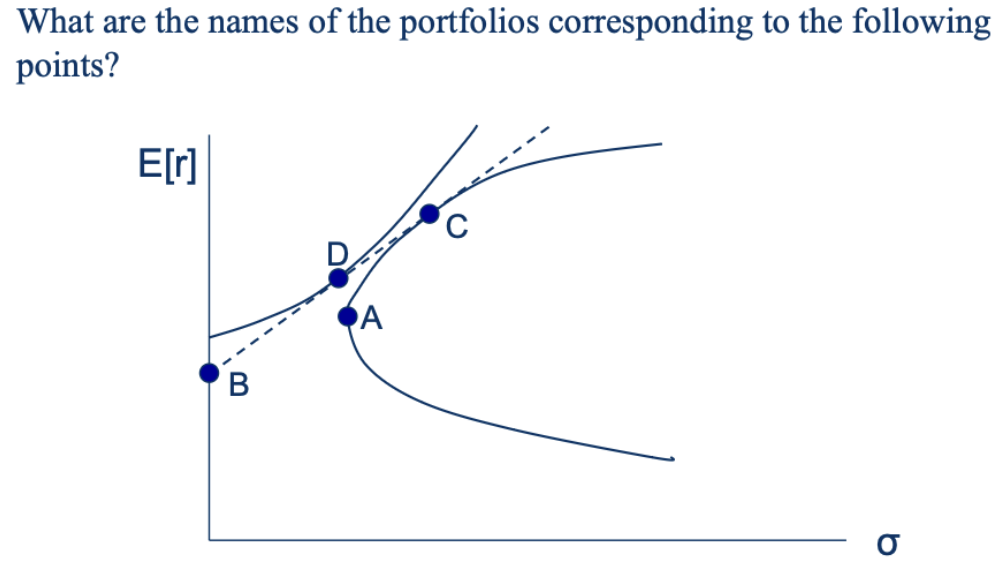
Point B: Risk free portfolio or portfolio completely composed of risk free asset
Point D: Optimal Complete Portfolio (a portfolio client choose given the indifference curve)
Point A: Global Minimum Variance Portfolio
Point C: Mean variance efficiency portfolio (tangency portfolio)
Investors are mean-variance optimizers (a CAPM assumption)
Investors make portfolios having in mind to maximize expected return for a given level of risk (variance)
CAPM assumptions
market is in competitive equilibrium
common single period investment horizon
Investors are rational mean variance optimizers
No transaction costs, no taxes
All assets are tradable
Homogeneous expectations across investors
CAPM vs Single Index Model
The CAPM is for expected returns while the Single Index Model is for realized Returns
The CAPM predicts that alpha will be zero
Effective Annual Yield (EAY)
Takes into consideration the compounding effect period
EAY = (1+r/n)n-1
YTM and Bond Price
have a inverse relationship
Expectations hypothesis
Assumes investors are risk neutral
meaning that investors choose the maturity of their bonds to maximize HPR
forward rates of the year n is equal to the expected future 1 year interest rate in year n
usually flat curve (if changes in interest rates are small)
Liquidity Preference Theory
Assumes that forward rate exceeds the expected future short term interest rate (otherwise short term investors would not be willing to hold long term bonds due to added risk and lower liquidity)
Segmented market Theory
Assumes investors trade either short terms bonds or long term bonds, and interests rate are determined by supply and demand among these 2 difference segments of investors
Longer the time to maturity and the smaller the coupon
then the higher the price sensitivity to changes in interest rates (higher duration)
An increase in a bond’s YTM results in a smaller price decline than the price gain associated with a decrease of equal magnitude in the YTM
because of convexity
low coupon bonds
are more sensitive to changes in the interest rates than higher-coupon bonds (lower coupon bonds have a higher duraiton)
In expectations hypothesis (EH)
the Liquidity premium is zero so forward rate is equal to future short term interest rate
predicts flat yield curve if future interest rates stay constant
In Liquidity premium theory (LP)
the forward rate is larger than future short interest rates
predicts upward slopign yield curve even if future rates stay constant
Two-Stage Dividend Discount Model
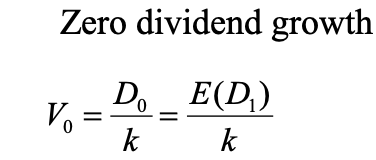
Zero dividend growth model
Forwards rates
weak form market efficiency
stock prices reflect all past information
Only fundamental analysis is helpful (TA not useful)
but arbitrage is possible
semi-strong form
stock prices reflect all publicly available information
arbitrage is not possible (except by private information/insider)
FA analysis is not useful nor Technical
Strong form market effiency
stock prices reflect all public and private information
no abnormal returns even by insider information
Price goes up on average
after takeover annoucnments
value anomaly (violation of EMH)
value firms (those with low b/m ratio) have higher abnormal returns than growth stocksJ
January/small firm anamoly (violaiton of EMH)
There is abnormal returns if you buy small firm stocks on dec 31st and sell them on Jan 31