Introduction to Finance
1/36
There's no tags or description
Looks like no tags are added yet.
Name | Mastery | Learn | Test | Matching | Spaced | Call with Kai |
|---|
No analytics yet
Send a link to your students to track their progress
37 Terms
Perpetuity (Definition + Formula)
A stream of equal cash flows that occurs at regular intervals and lasts forever. The first payment is given at the end of the first period and provides a bond payment of C.

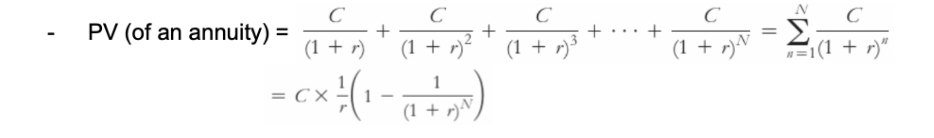
Annuity (Definition and Formula)
A stream of equal cash flows paid at regular intervals for a fixed number of payments. The first payment is given at the end of the first term.
Arbitrage (opportunity)
Buying and selling equivalent goods in different markets to take advantage of a price difference.
Short sale
A transaction in which an investor borrows shares and ‘sells’ them, expecting to buy them back later at a lower price to return to the lender. The dividends earned by the original owner must be paid by the short seller.
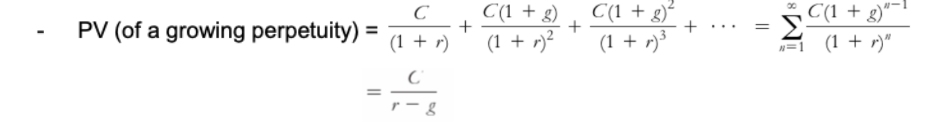
PV of a growing perpetuity
The first payment of the perpetuity occurs at period 1, however growth begins at period 2. g < r otherwise the sum to infinity becomes infinite.
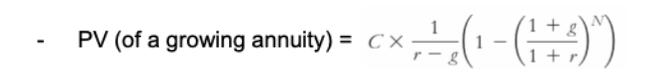
PV of a growing annuity
The first payment of the annuity occurs at period 1, however growth begins at period 2. r < g
IRR
The interest rate that sets the NPV of a CF equal to zero.
Term structure
The relationship between interest rates or bond yields and different maturities of debt securities. It reflects the market's expectations of future interest rates and economic conditions.
Yeild curve
A graphical representation of the term structure of interest rates, showing the relationship between bond yields and different maturities. An increasing yield curve indicates that longer-term securities have higher yields than short-term ones which indicates expectations of rising interest rates and higher economic growth. A decreasing yield curve indicates the opposite, suggesting lower yields for longer maturities and expectations of economic slowdown.
Discount
Bonds may offer a price less that their FV. YTM > CPN rate
Premium
Bonds may offer a price greater than their FV. YTM < CPN rate
Par
Bonds which offer a price equal to their FV. YTM = CPN rate
Duration
A measure of the sensitivity of a bond's price to changes in interest rates, reflecting the weighted average time until cash flows are received.
Payback investment rule
You should only accept a project if its CFs pay back its initial investment with a pre-specified period.
Issues with the IRR
Delayed Investments- negative CFs occurring after initial positive CFs
Multiple IRRs- when CFs fluctuate from positive to negative (the discount rate may be plotted against the NPV resulting in a parabolic share with multiple roots indicating a negative NPV between some values)
Nonexistent IRR- when the NPV is positive for any discount rate
Cannot determine the scale of investment or compare projects with different scales.
Differences in timings- ignored the time value of money
Issues with the NPV
Ignores the projects cost of capital and the time value of money
Ignores CFs after the payback period
Assumes constant discount rates - Does not account for different risk profiles of cash flows
Equity cost of capital
The expected return of other investments available in the market with equivalent risk to the firms shares.
Idiosyncratic risk (firm specific)
fluctuation of a stocks return due to firm specific news are independent risks.
Systematic risk
Fluctuations of a stocks return due to market wide net represent common risk.
Efficient portfolio
A portfolio that contains only systematic risk. There is no way to reduce the volatility of this portfolio without lowering its expected return.
Beta of a security
The expected percentage change in its return given a 1% change in the return of the market portfolio (market wide risk).
Sharpe ratio
The reward to volatility produced by a portfolio as a tangent of the efficient frontier (the tangent portfolio cuts the y-axis at the risk free rate).
Assumptions of the CAPM (potential issues)
Investors can buy and sell all securities at competitive market prices (without incurring taxes or transaction costs) and can borrow and lend at the risk free interest rate.
Investors hold only efficient portfolios of traded securities, portfolios that yield the maximum expected return for a given level of volatility.
Investors have homogeneous expectations regarding the volatilities, correlations, and expected returns of securities
Capital market line
Shows the risk-return trade-off for efficient portfolios (only those that combine the risk-free asset and the market portfolio).
Alpha of a security
The distance of a stock from the security market line. The alpha suggests to buy stocks with positive alphas and sell stocks with negative alphas.
Positive alpha of a stock
If a stock has a positive alpha, investors will surge to buy shares resulting in the stock price rising. Based on dividend yields, as stock prices increase, the dividend yield decreases resulting in the expected return lowering. This occurs until the stocks return to the security market line.
Behaviour of individual investors
Familiarity bias- investors favour investments in companies they are familiar with
Relative wealth concerns- investors care more about the performance of their portfolios relative to their peers
Excessive trading- most trading occurs each day, while according to the CAPM, investors should hold risk-free assets in combination with the market portfolio of all risky securities
Overconfidence bias- investors believe they can pick winners and losersS
Sensation seeking- an individual's desire for novel and intense risk-taking experiences
Under Diversification- few companies in the same industry or geographically close
Systematic trading biases
Disposition effect- investors hold on to stocks that have lost their value and sell stocks that have risen in value since the time of purchase
Investor attention- individuals are more likely to buy stocks that have recently been in the news, engaged in advertising, experiences exceptionally high trading volume or have had extreme returns
Mood- studies have found that stock returns tend to be higher when it is a sunny day at the location of the stock exchange
Experiences- investors overestimate their experiences rather than considering historical evidence
Herd behaviour- investors make similar trading errors as they are actively trying to follow each others behaviour
Informational cascade effects- traders ignore their own information hoping to profit from the information of others
Security market line
Shows the expected return of an individual security or portfolio as a function of its systematic risk (beta) based on the CAPM. The market risk premium represents the coefficient of beta plotted against the market expected return.
Converting APR to EAR
1 + EAR = (1 + (APR / n))n
Price (PV) of a zero coupon bond
PV = FV / (1 + YTMn)n
Price (PV) of a coupon bond
PV = (CPN / YTM)(1 - (1 / (1 + YTM)n)) + FV / (1 + YTM)n
The formula represents the sum to n of the coupon plus the FV discounted for the term rate.
Profitability index
= Value created (NPV) / resources consumed
Dividend yield (Definiton + Formula)
The percentage return the investor expects to earn from the dividend.
= Div1 / P0
Capital gain (Definiton + Formula)
The amount an investor will earn by selling a share.
(%) = (P1 - P0) / P0
Total expected return (rE)
= Dividend yield + Capital gain rate
Dividend discount model
Dividends are discounted for n periods then the FV is discounted for n by 1 + total expected return
