HTHSCI 2S03 - Hypothesis Testing for One Sample Mean
1/42
There's no tags or description
Looks like no tags are added yet.
Name | Mastery | Learn | Test | Matching | Spaced | Call with Kai |
|---|
No analytics yet
Send a link to your students to track their progress
43 Terms
Hypothesis Testing - Introduction
t
- Not normally distributed
- Variance is unknown
z
- Known variance
- Normal distribution
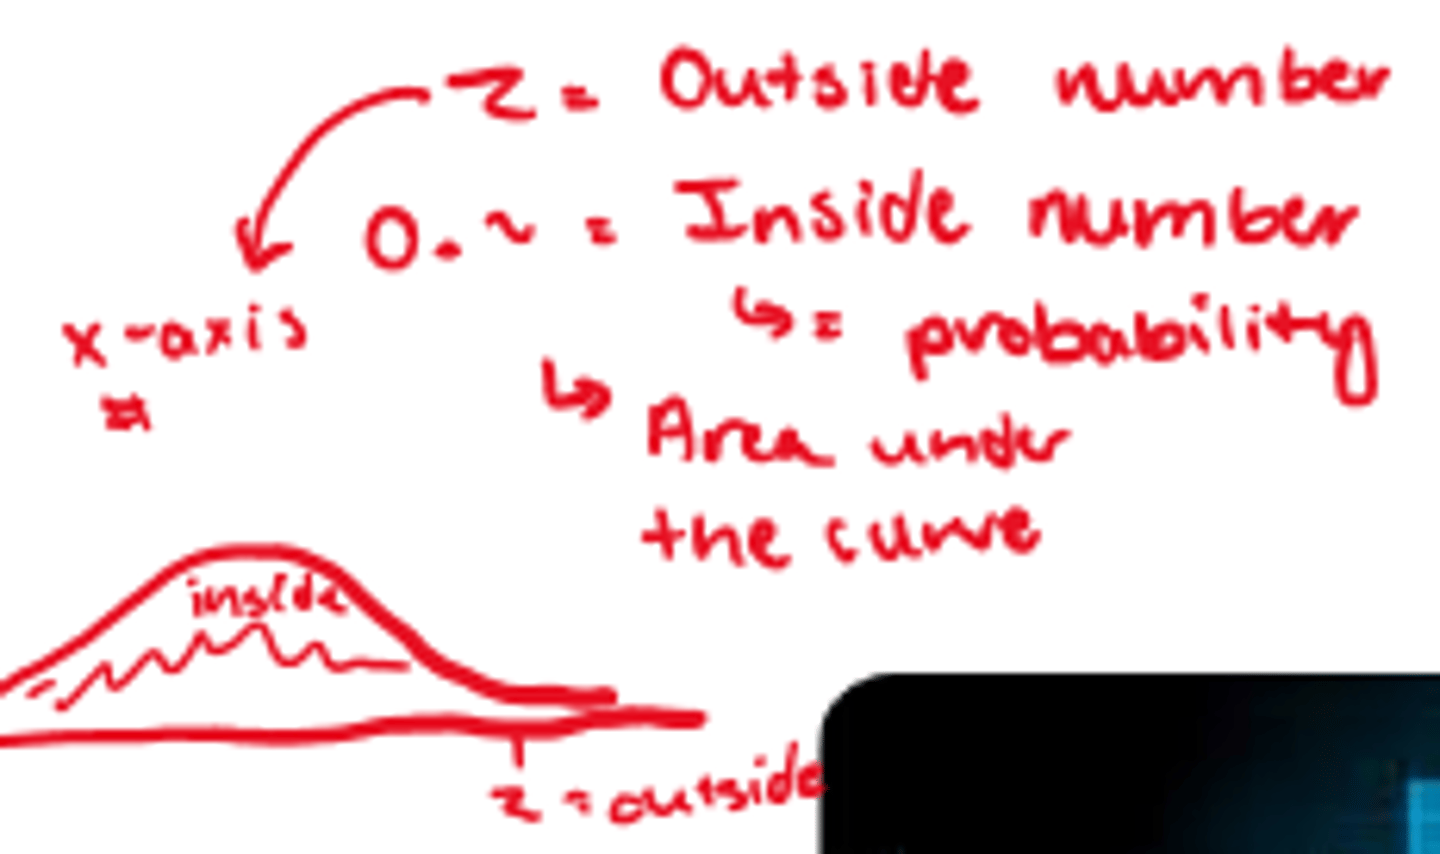
Outside vs. Inside Numbers
Hypothesis
- A claim or statement about one or more populations
Types of Hypotheses
- Null Hypothesis
- Alternative Hypothesis
Null Hypothesis (Ho)
- States that a population parameter is equal to a certain value (often based on existing evidence)
Alternative Hypothesis (Ha)
- A hypothesis that contradicts H0 (often what you hope to show with research study)
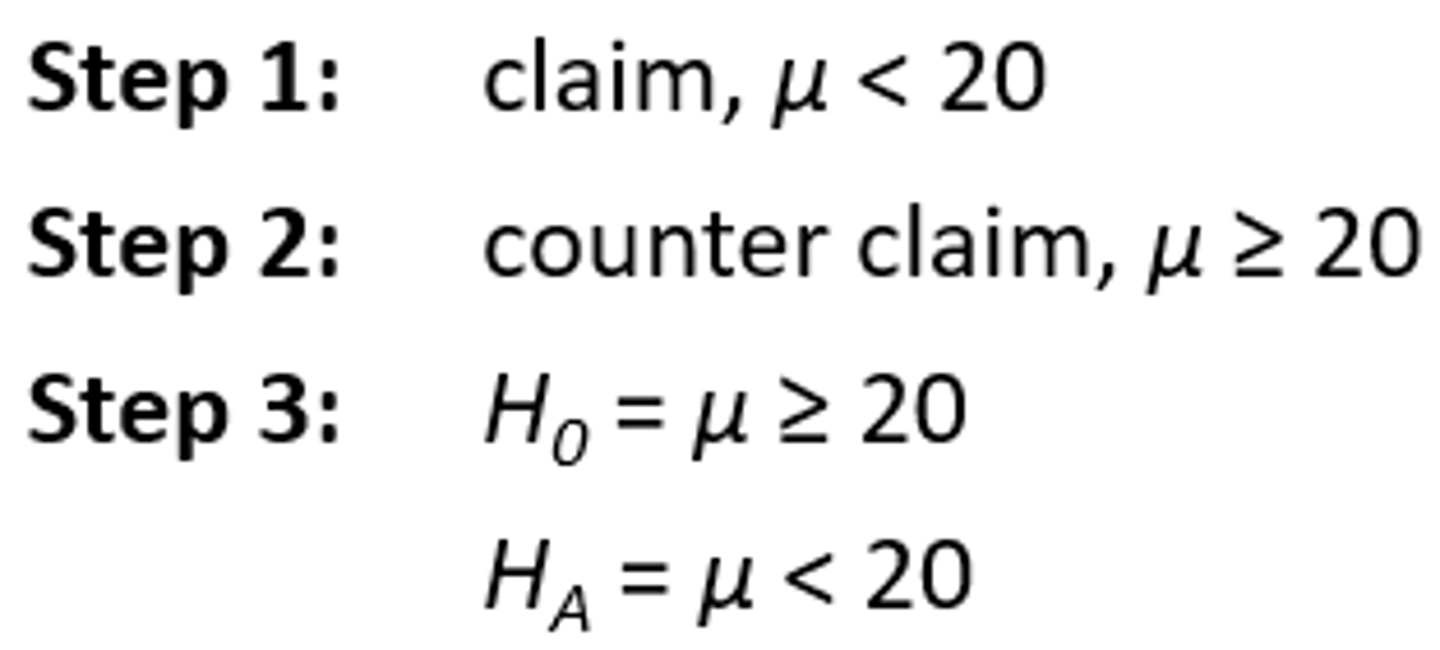
Fisher Method - Determining H0 and HA
1. State the claim (or claim in question).
2. State the counter claim (everything other than the claim).
3. Assign the claim with the equality to H0 and the remaining claim to HA
*Step 3 results in H0 containing either =, ≥ or ≤ as per rule of thumb
Fisher Method Example
Is the mean age of drinking in Ontario less than 20 years?
Let α = 0.05
**Equal = Always null hypotheses (greater than or equal to; less than or equal to)
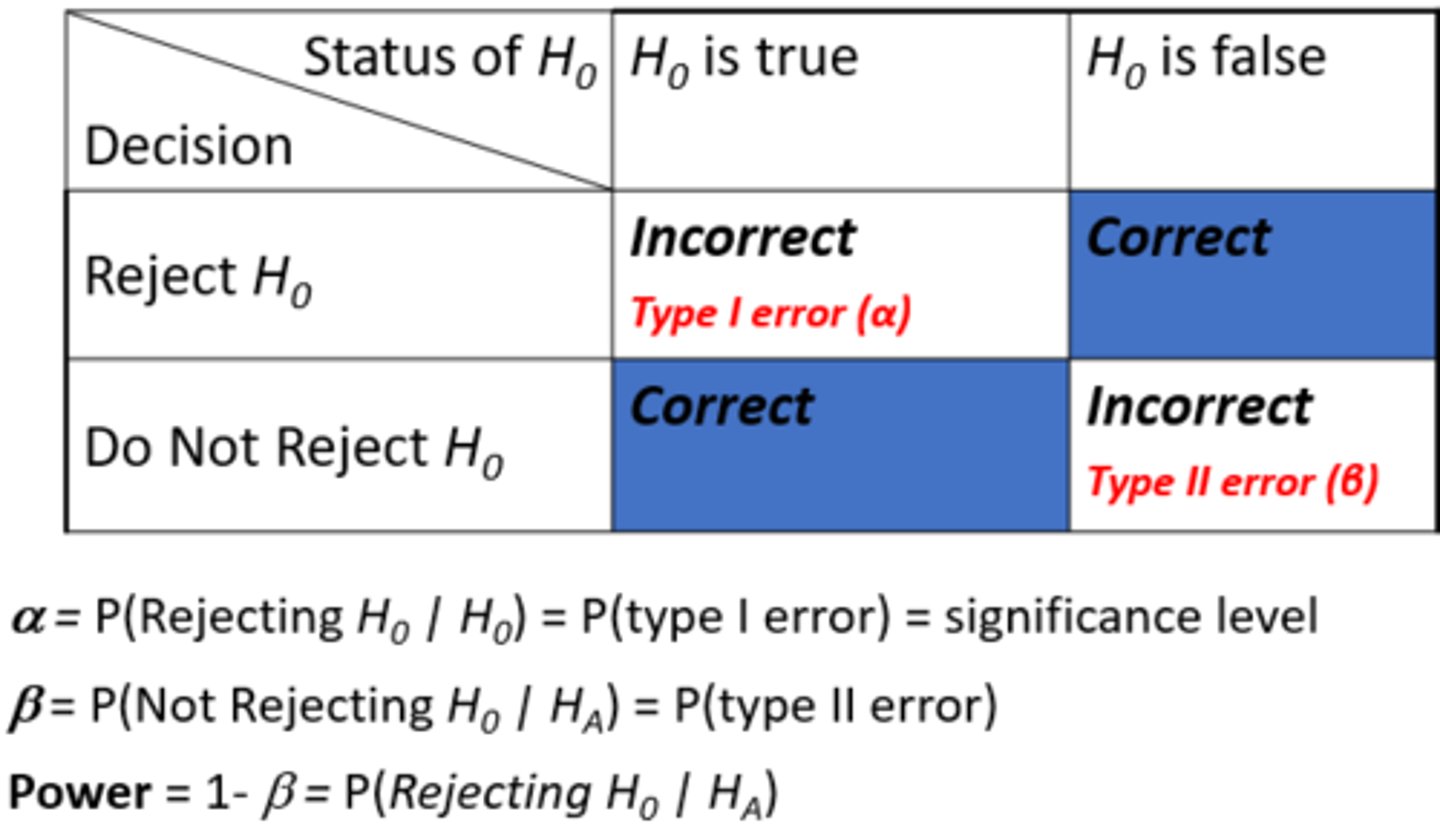
Hypothesis Testing Definitions
- Decision = Based on data
- Hypothesis Testing = Never know the final answer
- *Want to keep the probability of incorrect answers low
- Power of the test = If Null hypothesis is false, then want to reject with high probability
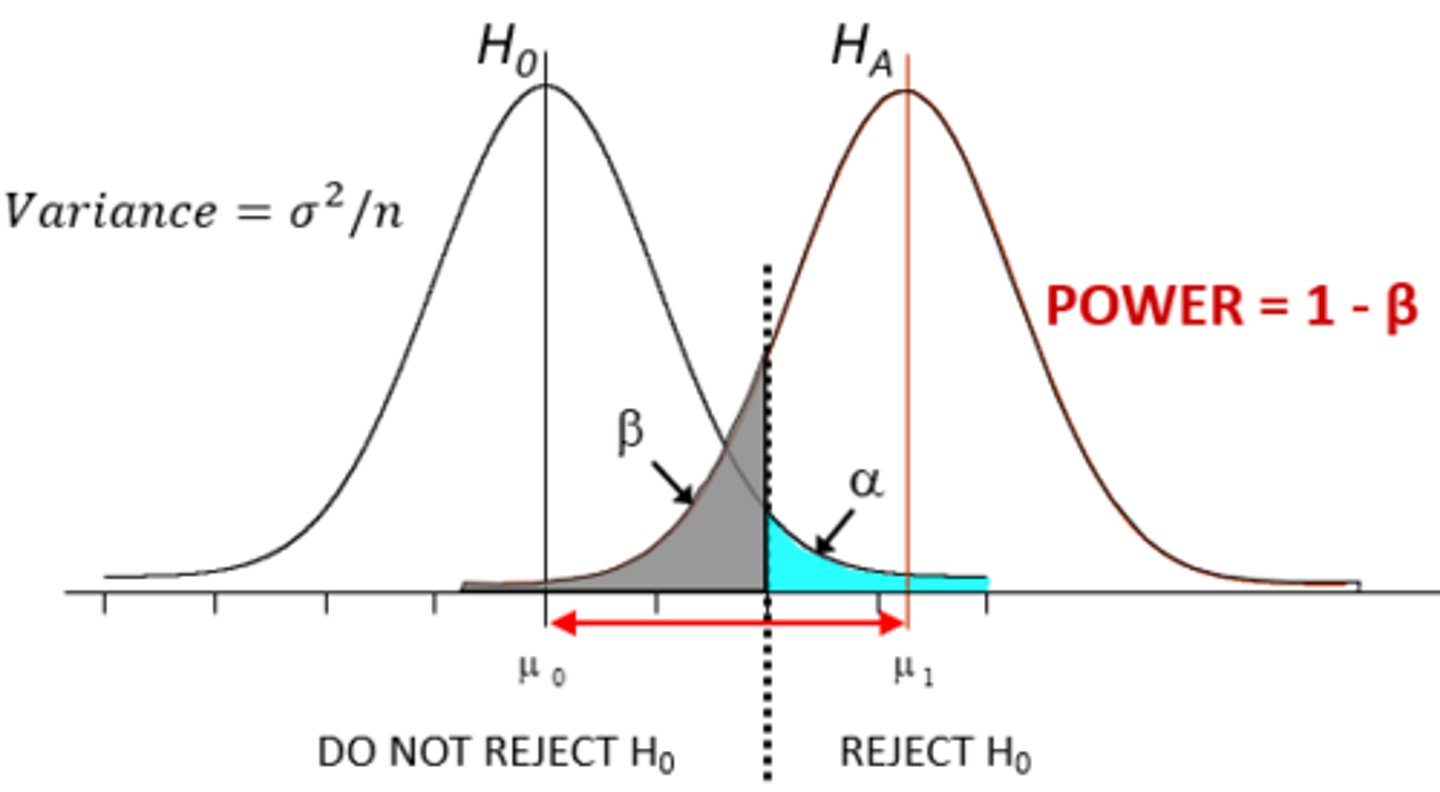
Hypothesis Testing - Visual
- Dotted line = Moving cutt-off point will determine the size of alpha and beta components
Example #1
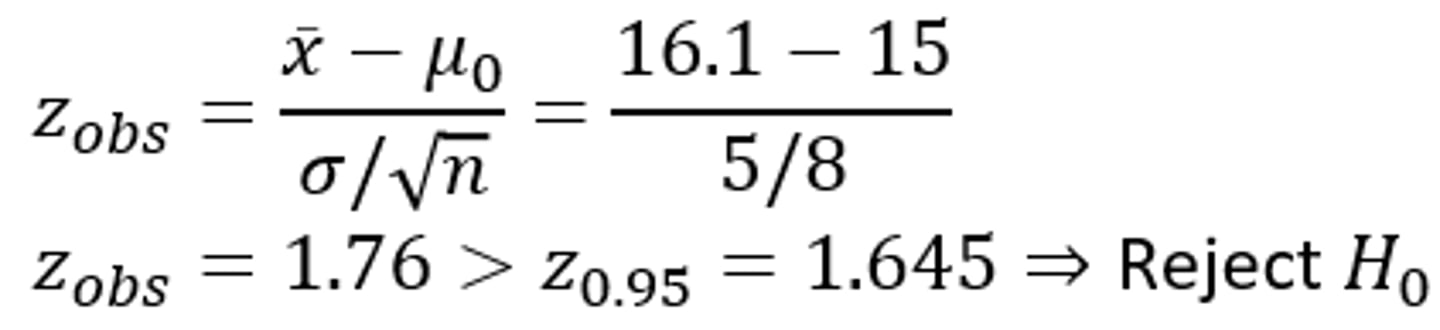
- The sample is from a normal population, σ is known
- These data show the age of 9 patients with cystic fibrosis:
- 8, 19, 19, 20, 13, 8, 16, 19, 23
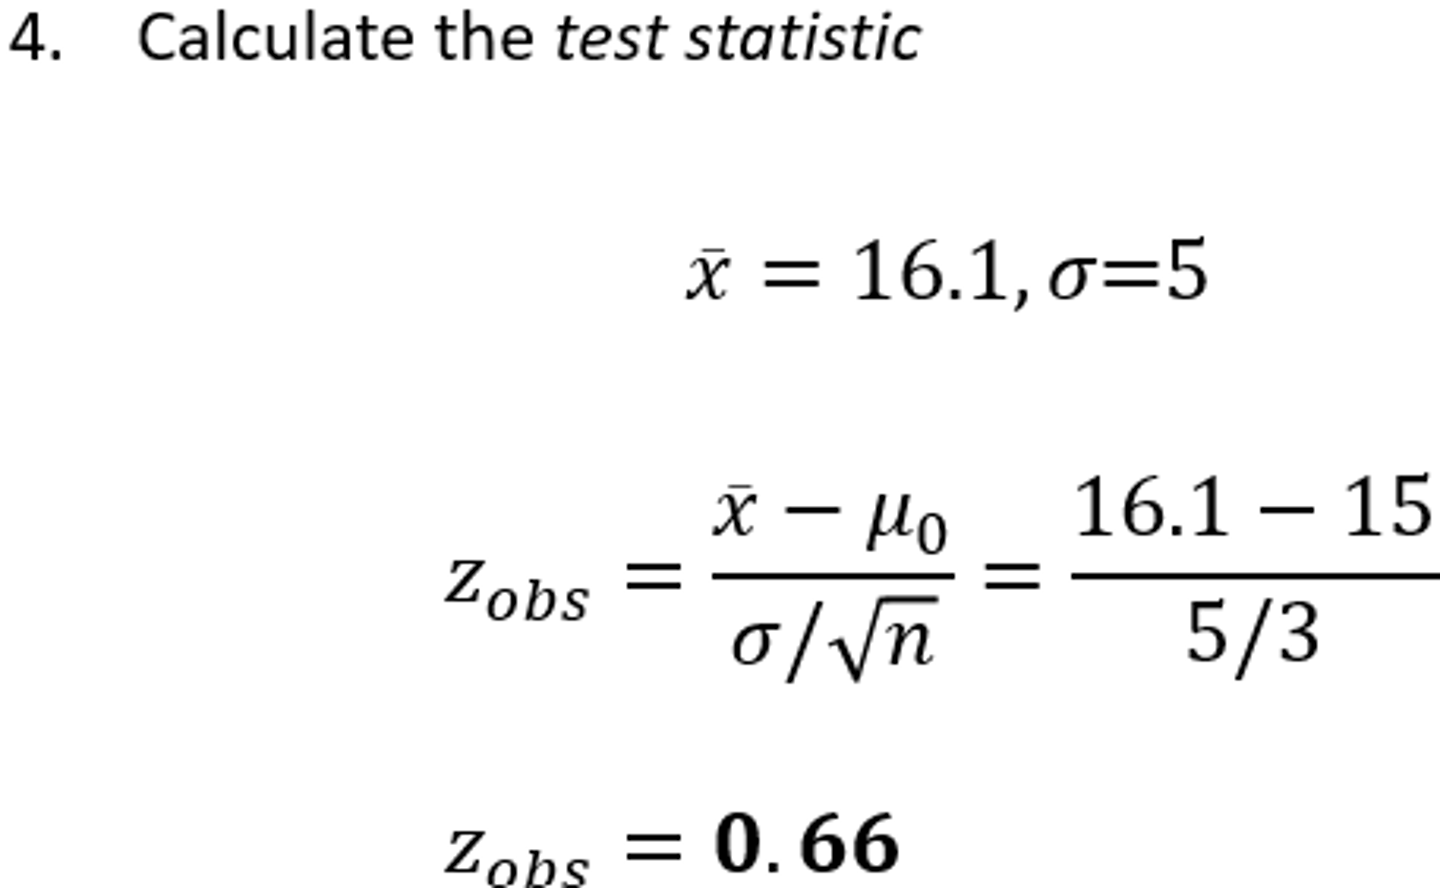
- x ̅ = 145/9 = 16.1 years, and σ=5
Question: Can we conclude that the mean age of the cystic fibrosis patients is greater than 15 years? Let α = 0.05.
Hypothesis Testing Steps #1 & 2 - Z-Test
2 = Creates observation amount
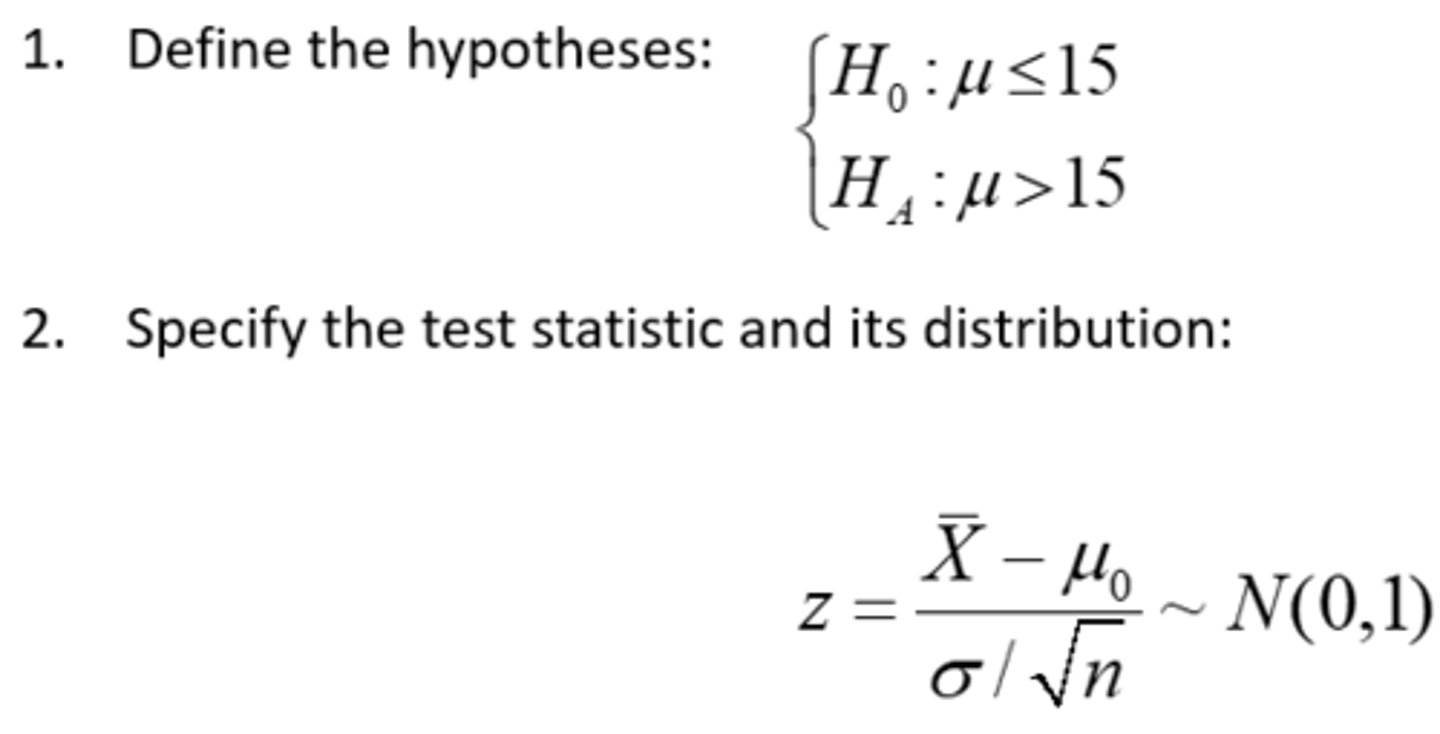
Hypothesis Testing Steps #3 - Z-Test
zobs = Observation
Larger x bar = Larger z (on right side of graph curve)
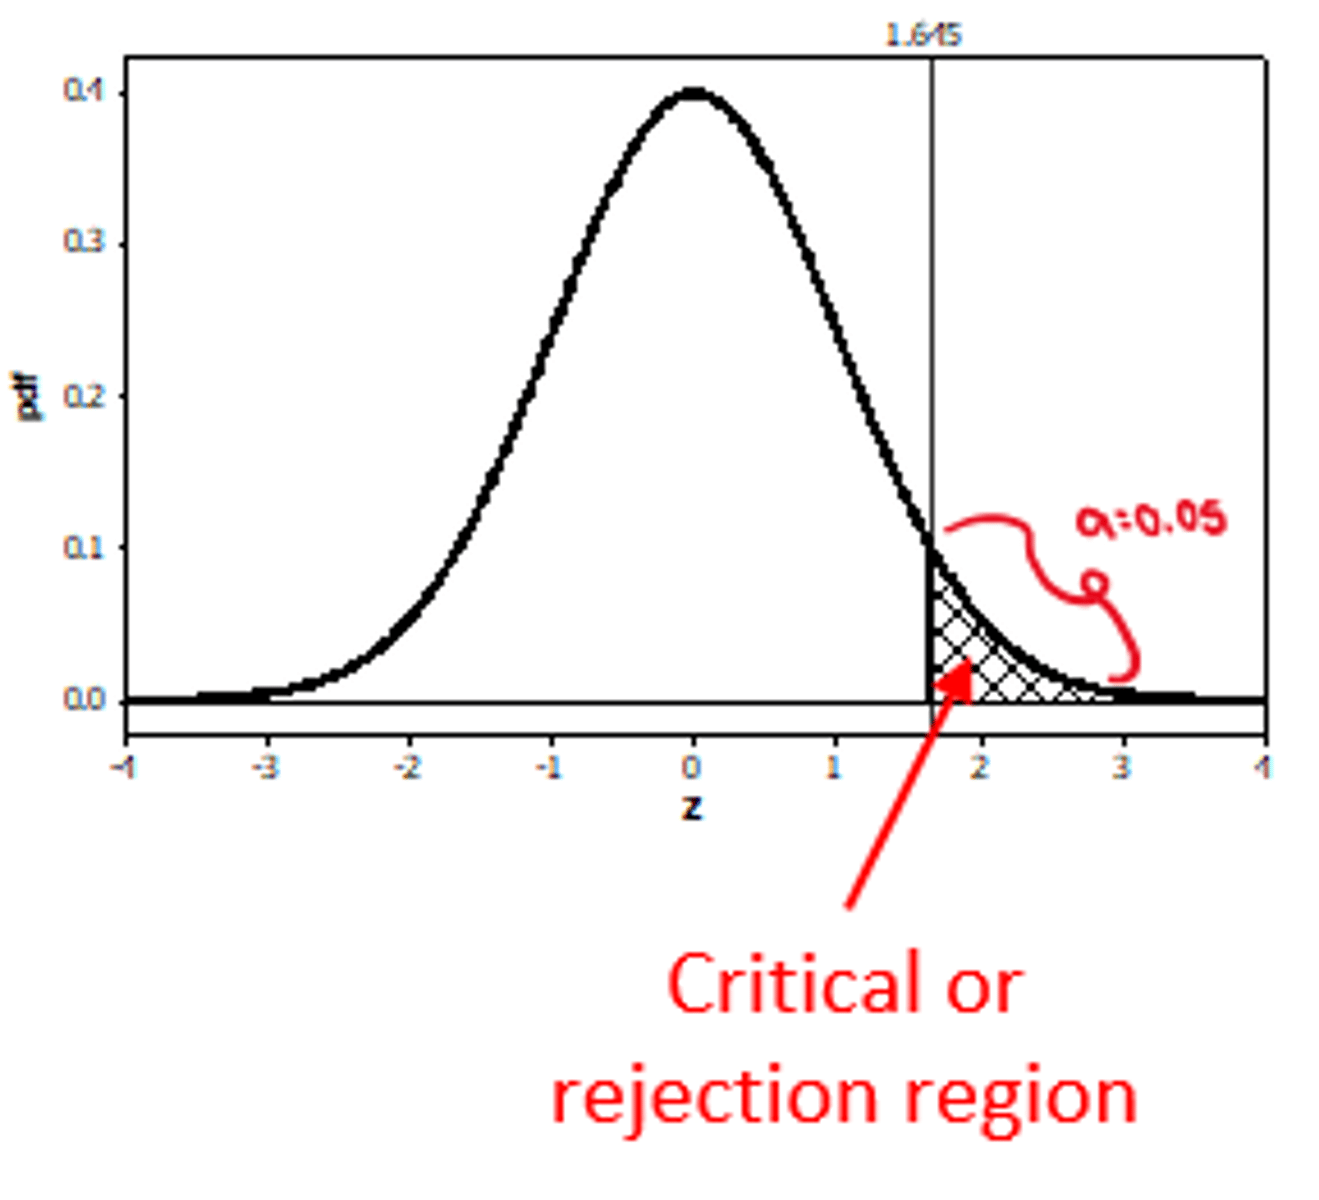
Directional Hypothesis Testing
- One-tailed test
- Hypothesis employs terms such as “greater than” or “less than” in the hypothesis statements
- This results in a single critical value that defines the rejection region for HO (where α lies under the Null hypothesis)
- Tail should α reside: Look to the direction of the alternative hypothesis - Greater than (right side), Less than (left side)
Non-Directional Hypothesis Testing
- Two-tailed test
- Employs terms such as “equal to”, “not equal to” in the hypothesis statements
- This results in two critical values that define the rejection region for HO (essentially α is split evenly between the two tails of the Null hypothesis)
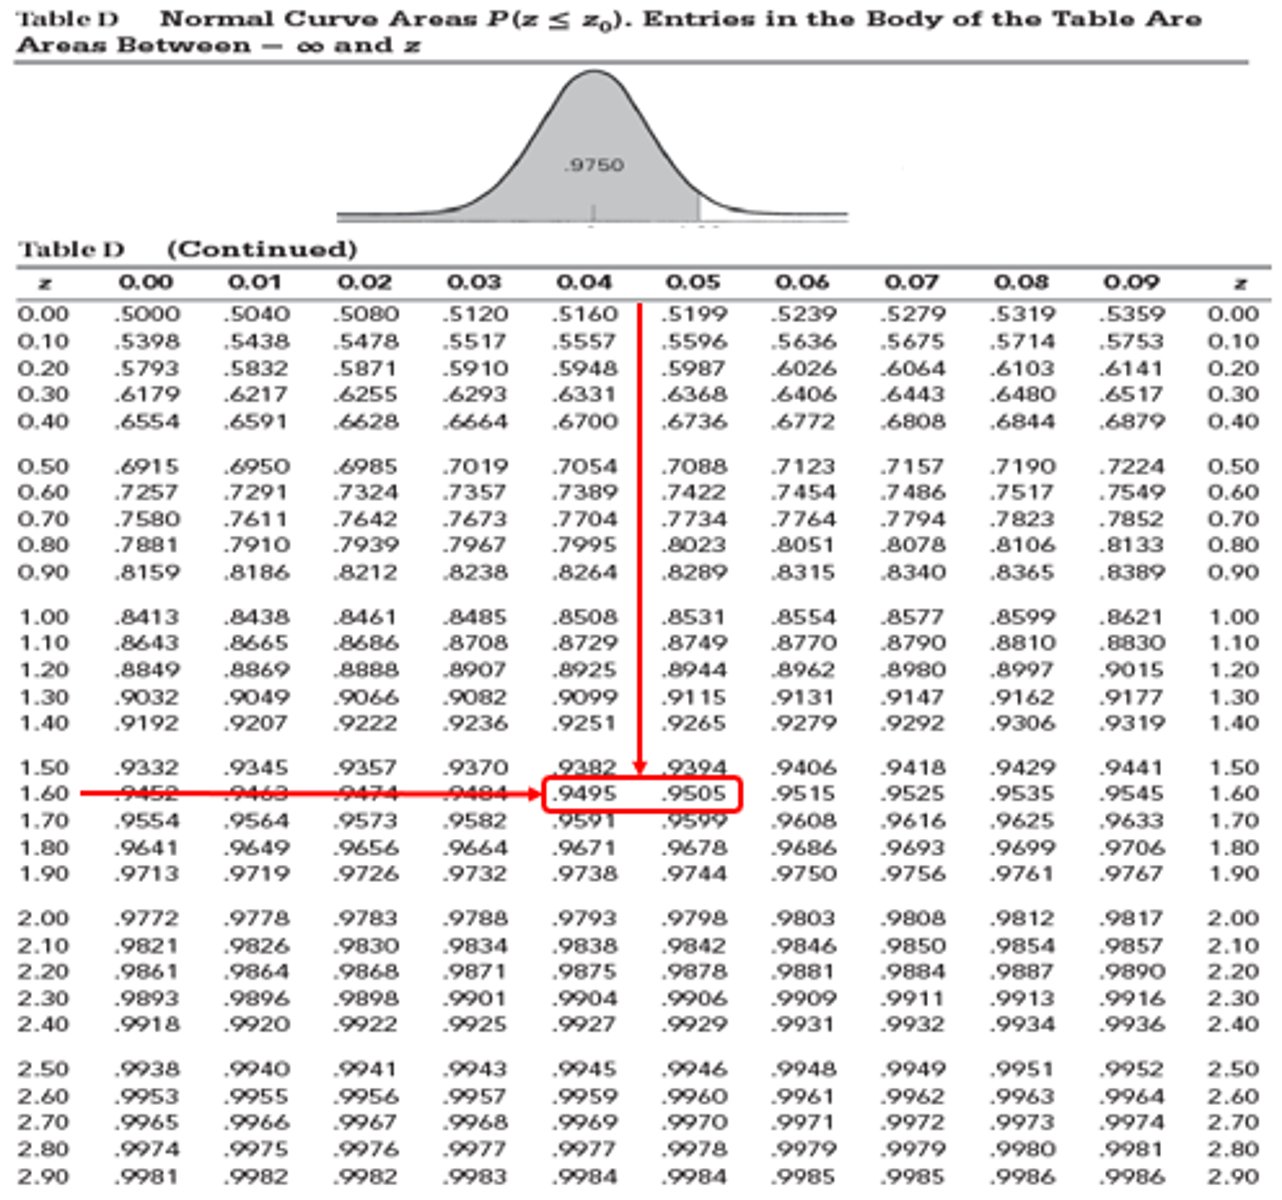
Standard Normal Distribution
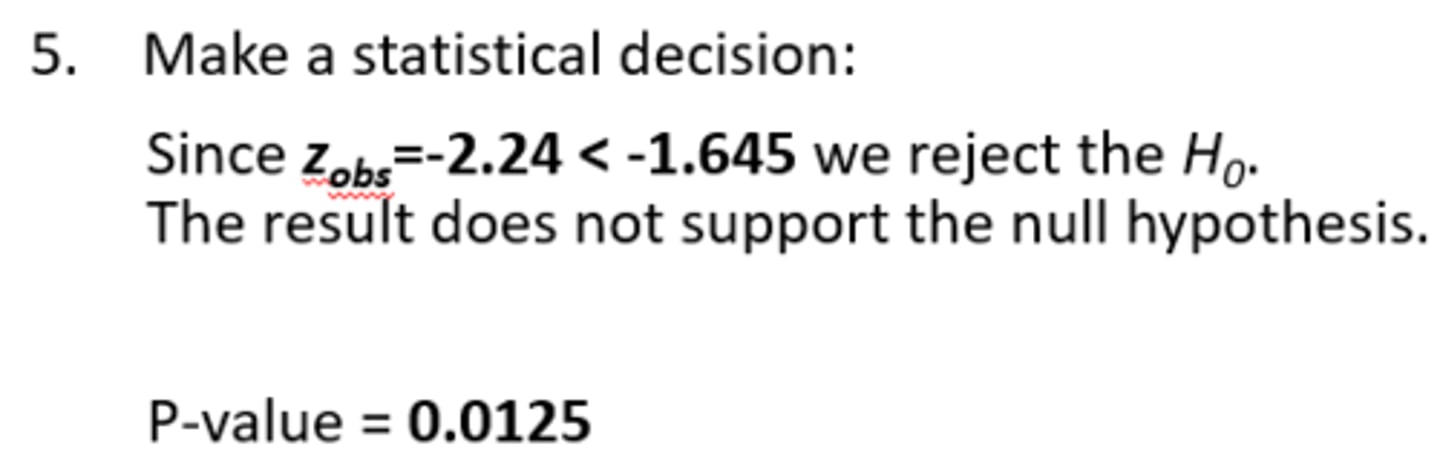
Hypothesis Testing Steps #4 - Z-Test
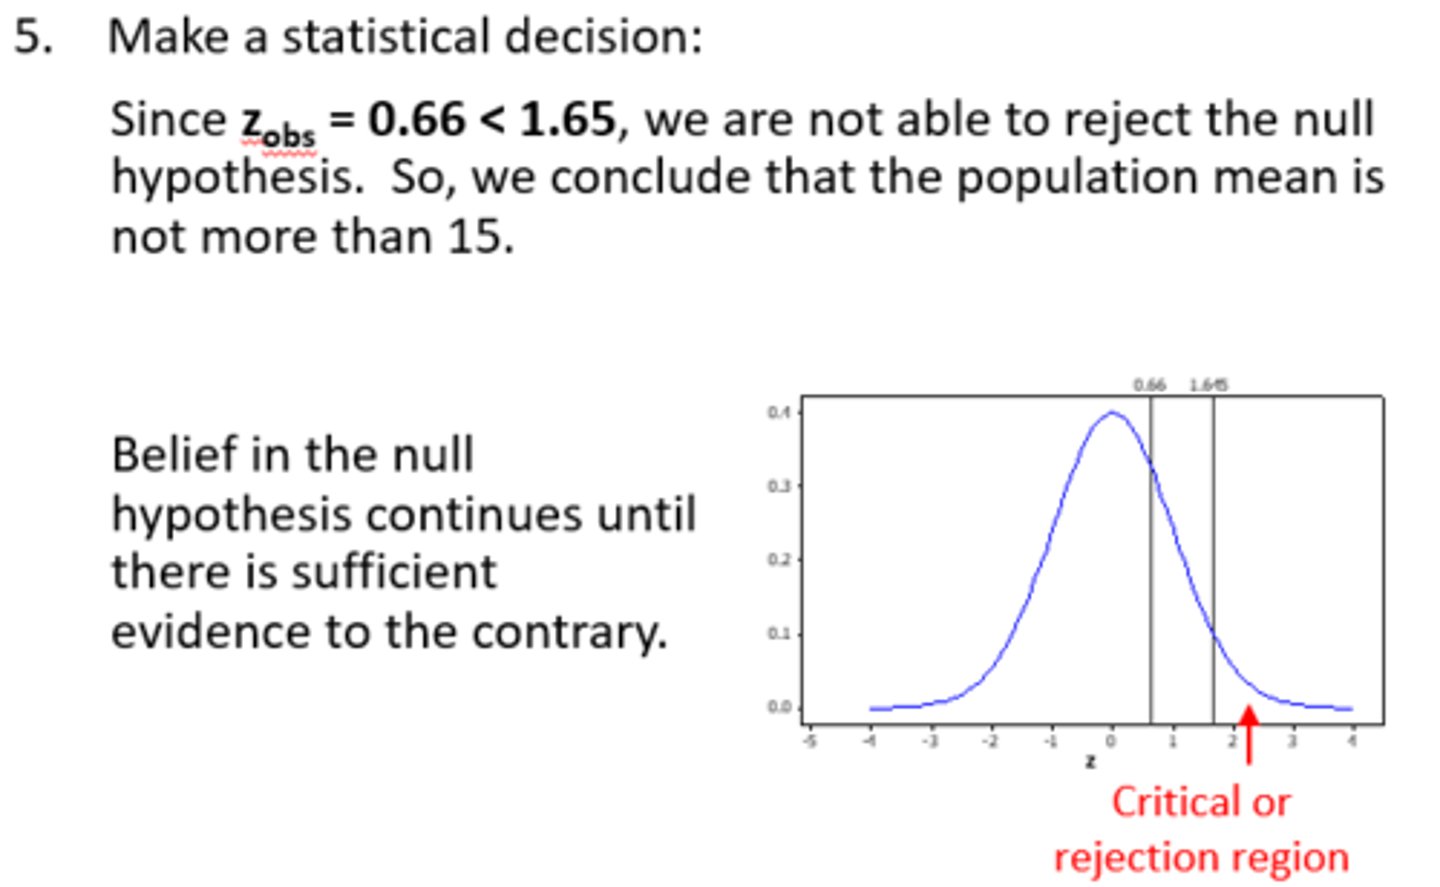
Hypothesis Testing Steps #5 - Z-Test
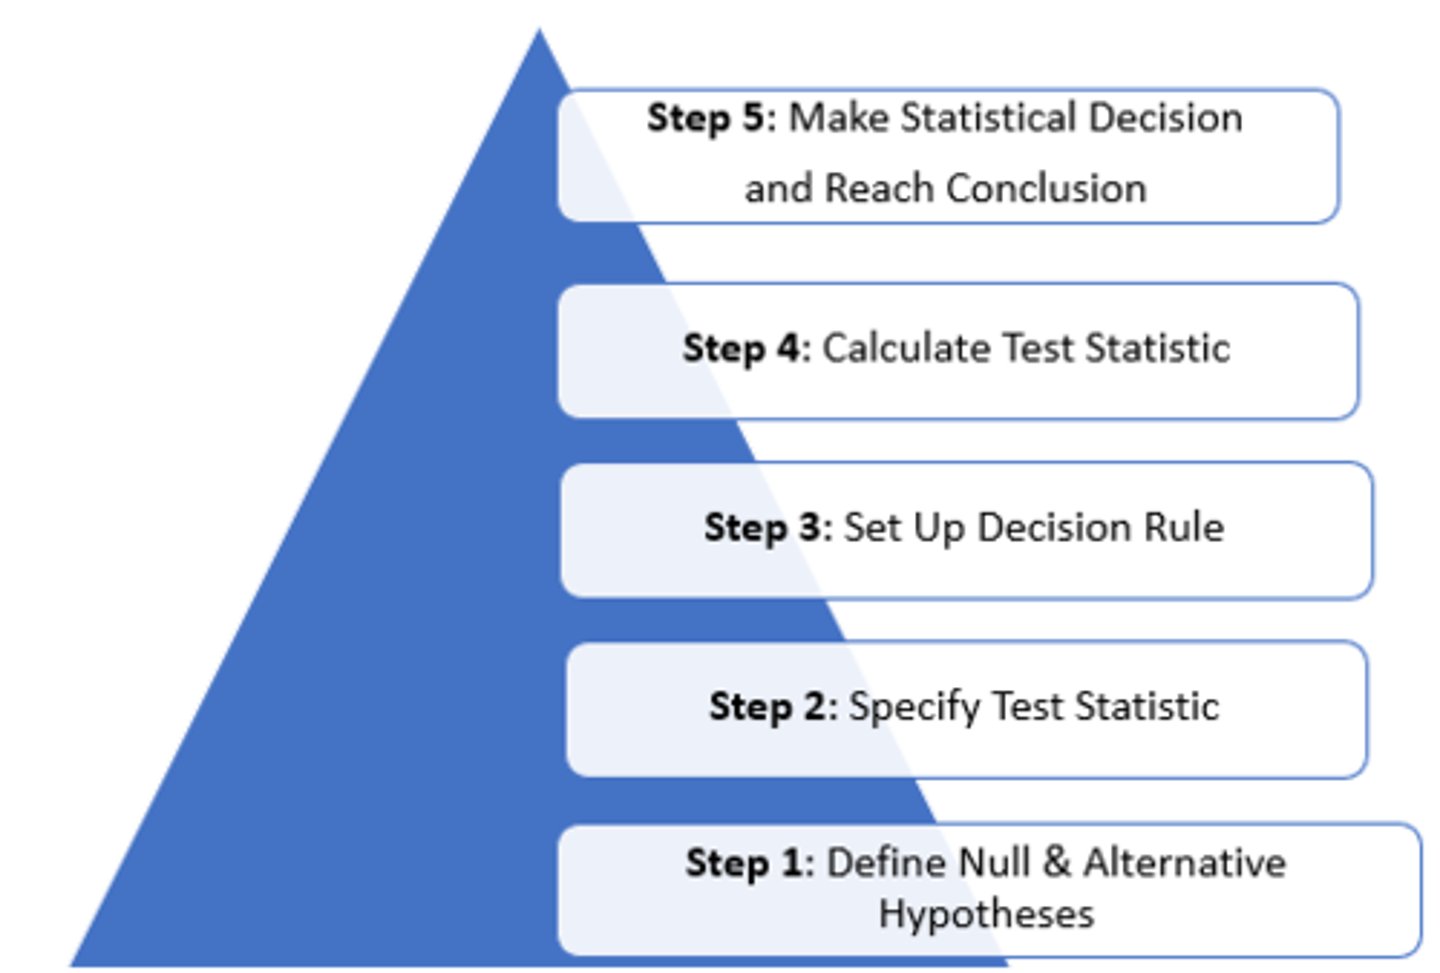
5 Steps to Hypothesis Testing
Hypothesis Testing
1. Test value
2. P-Value (or Minitab)
3. CI approach
*All used to determine or reject the null hypothesis.
P-Value
- P-value is the probability of obtaining a test statistic equal to or higher (on either side; positive or negative) than the one observed if H0 is true
Example:
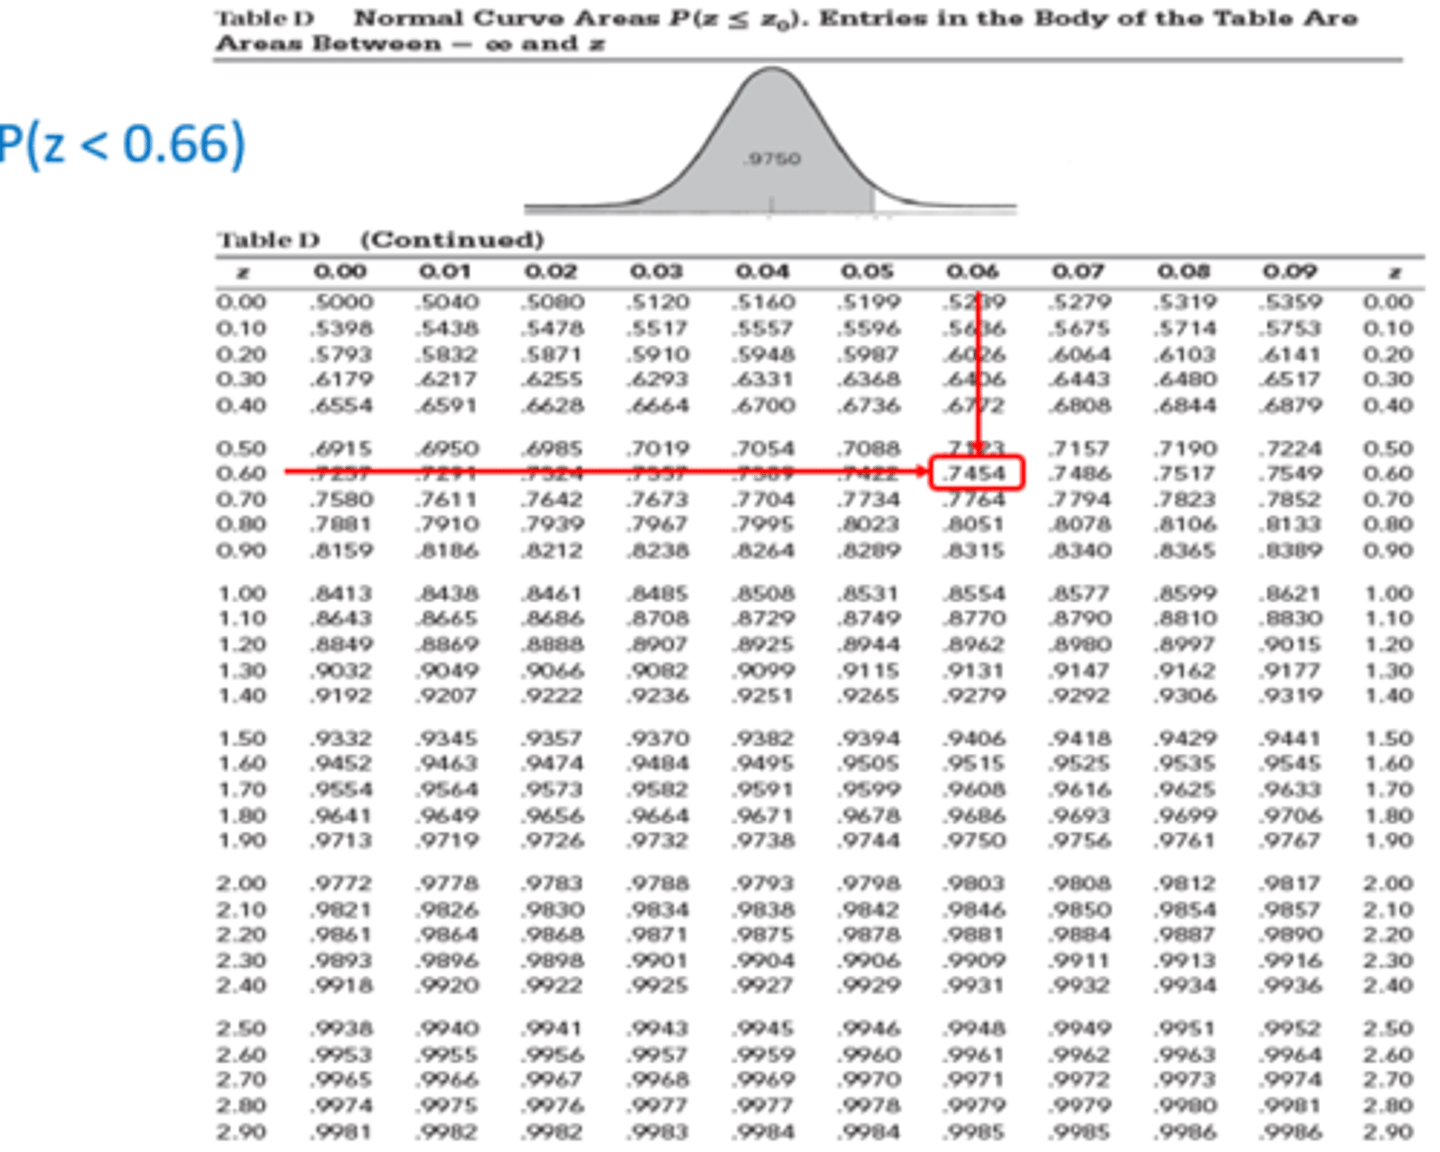
- P-value for test statistic (z=0.66) = 1.00 – P(z<0.66) = 1.00 – 0.7454 = 0.2546
- This means there is a 25.5% chance of observing a test statistic of 0.66 or higher if H0 is true (this suggests H0 is reasonably plausible)
P-Vale - Standard Normal Distribution
P-Value & H0
- Large p-values indicate that H0 is quite plausible given the data
- Small p-values indicate H0 is IMPLAUSIBLE
P-Value vs. Critical Value Approach
p-value of the test statistic can be compared to α:
- Reject H0 if p-value of test statistic < α
Test statistic can be compared to critical value:
- Reject H0 if test statistic > critical value
- p-value and critical value approach are equivalent in terms of the decision to reject H0
- p-value approach often preferred because it indicates the strength of the evidence (ex. p=0.0001 vs p=0.04)
Confidence Interval Approach
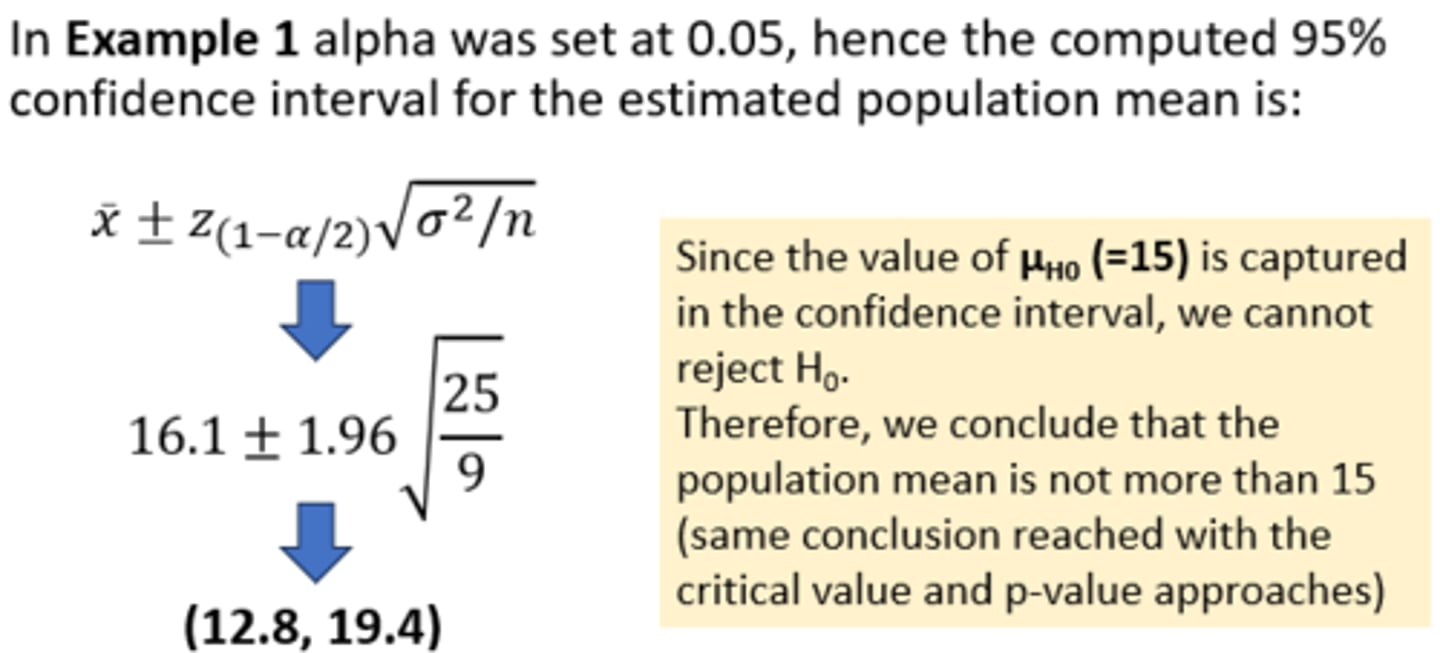
*The decision to reject or not reject H0 can also be determined using a confidence interval approach
Example #1:
Confidence Interval Approach
Example #2
- The sample is from a normal population with σ unknown
- The following data show BMI on 16 subjects from a specific population:
- 23, 25, 21, 37, 38, 21, 23, 25, 32, 44, 28, 26, 31, 45, 43, 34
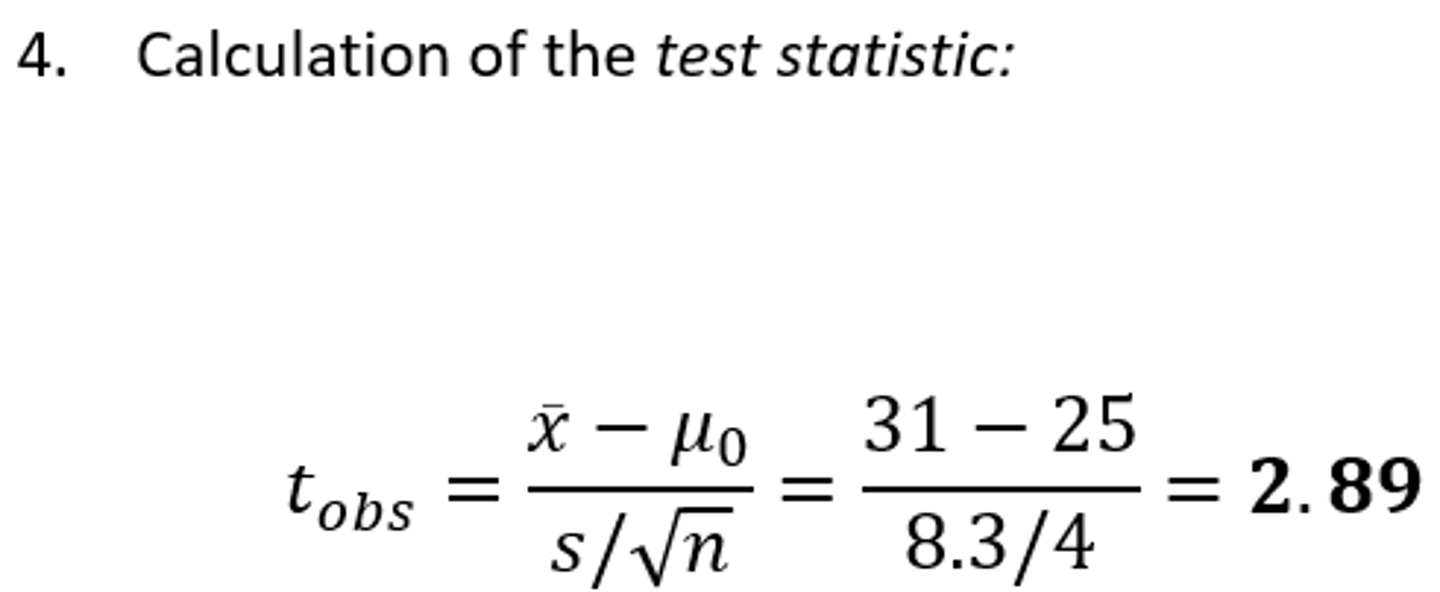
- x ̅ = 31.0, s = 8.3 (SD)
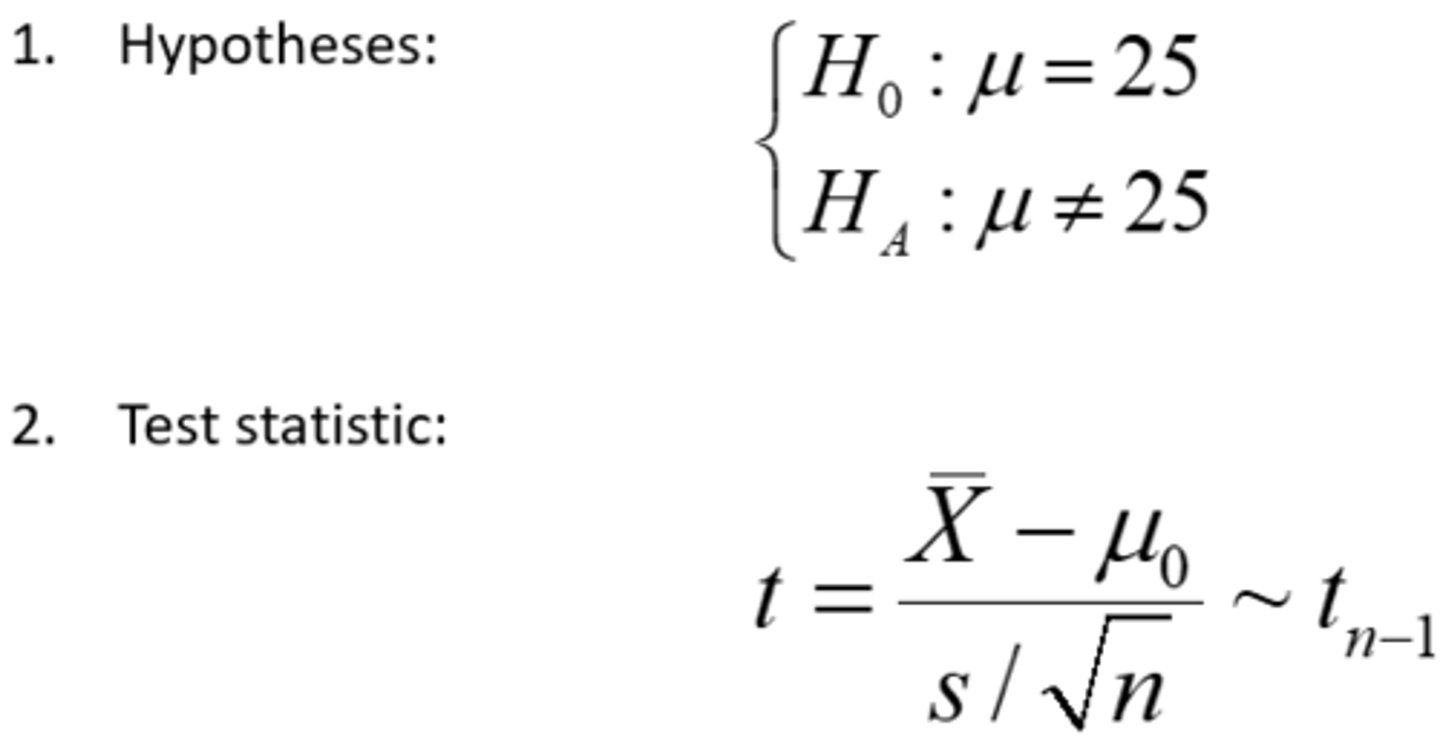
Question: Can we conclude that mean of the population is different from 25?
Let α = 0.05.
Answer = The question is not = to, so alpha is split equally between both sides of distribution (use rule of thumb below)
Example #2:
T-Test - Steps #1 & 2
Example #2:
T-Test - Steps #3
t15 = n - 1
= 16 - 1
= 15
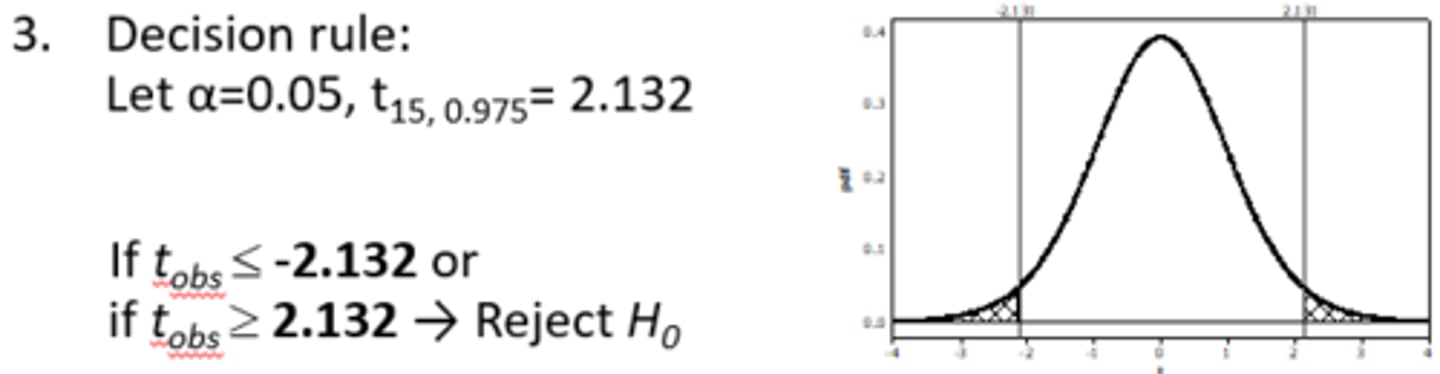
Rule of Thumb - Rejection Zone
- If the question is a > (greater than) question: Right side
(alpha entirely on right side)
- If the question is a < (less than) question: Left side
(alpha entirely on left side)
- If the question is an = to or not = to: Both sides
(split alpha, half on each side)
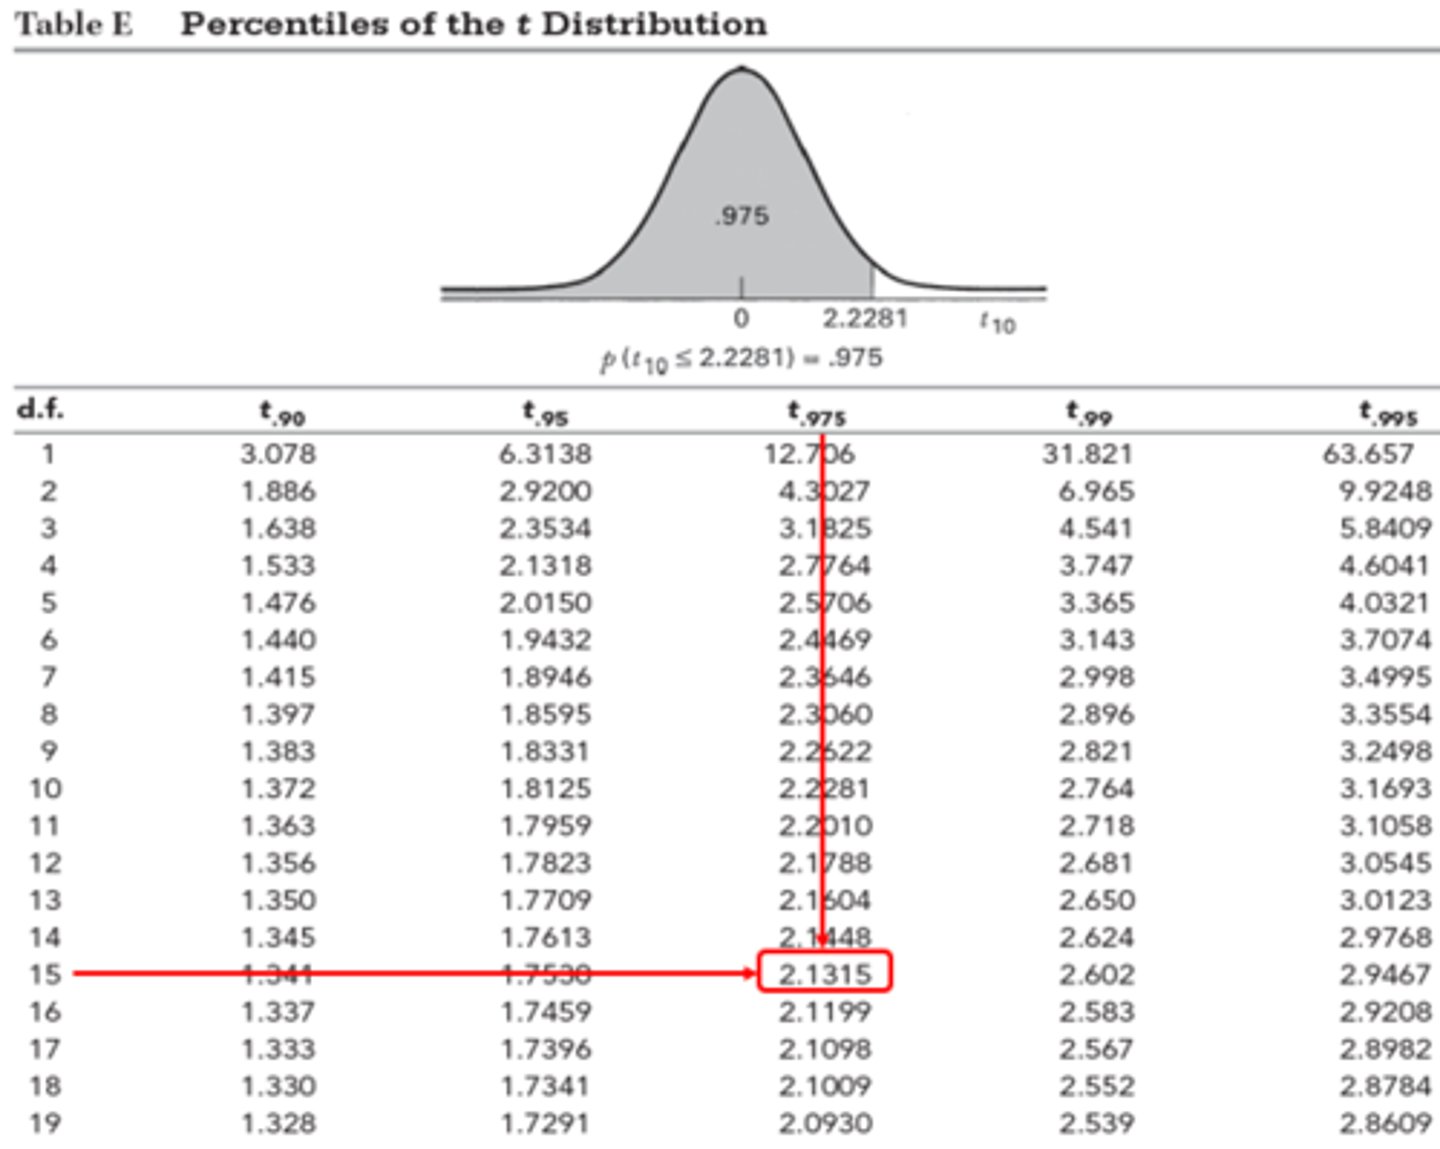
T-Critical Value Table
Example #2:
T-Test - Steps #4
Example #2:
T-Test - Steps #5
Example #3:
Central Limit Theorem
- The sample is from a non-normal population
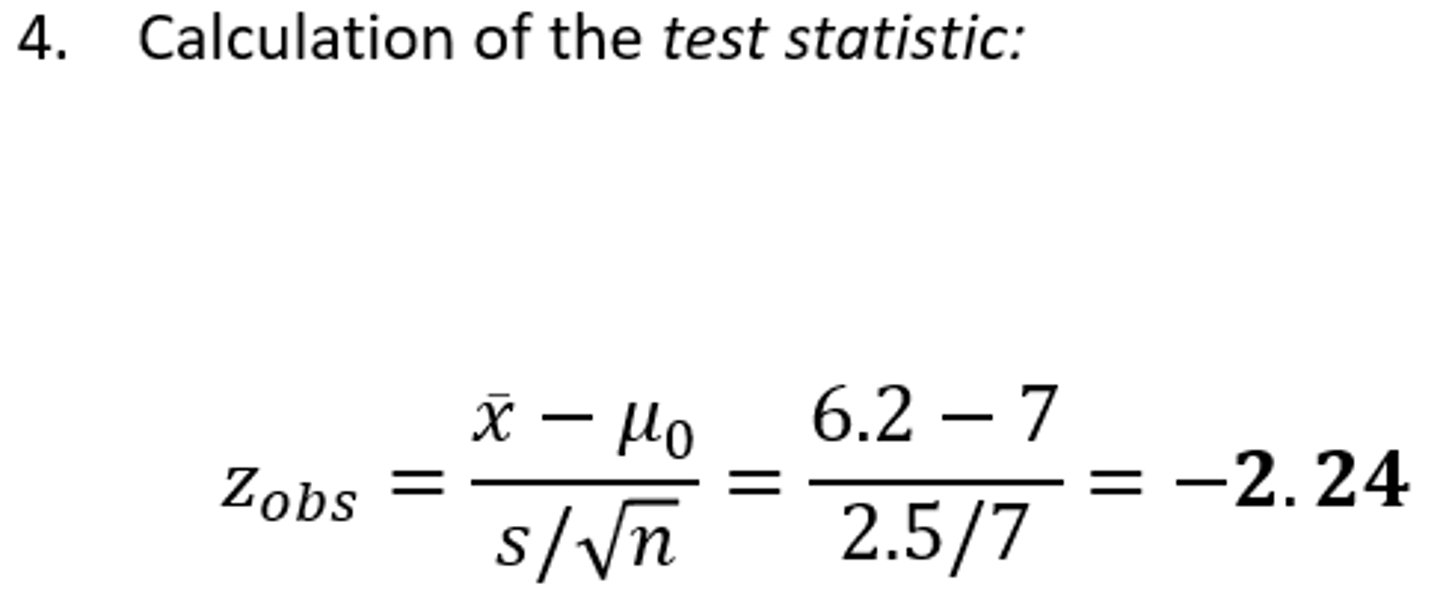
- In a sample of 49 patients admitted in a surgery ward, mean and standard deviation of the length of stay in the ward are 6.2 and 2.5, respectively
- Question: Can we conclude that the mean of the population is less than 7 days? Let α = 0.05
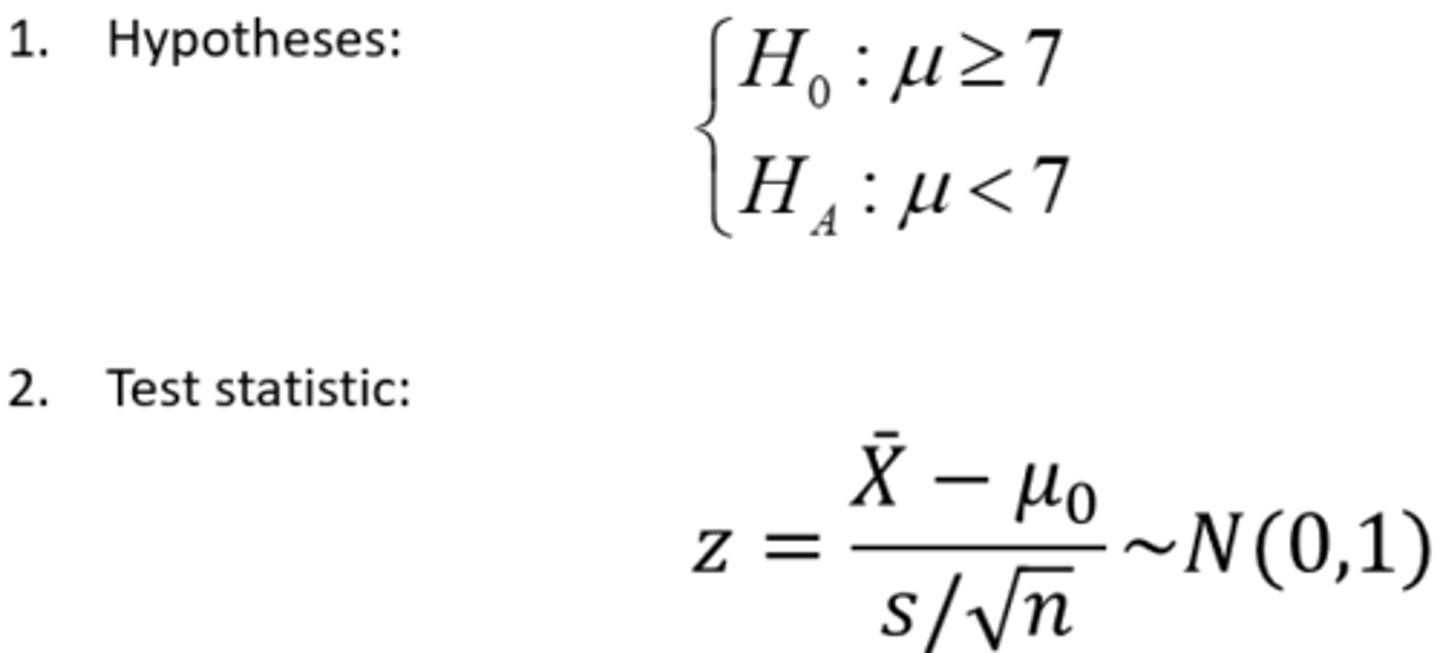
Example #3:
Central Limit Theorem - Steps #1 & 2
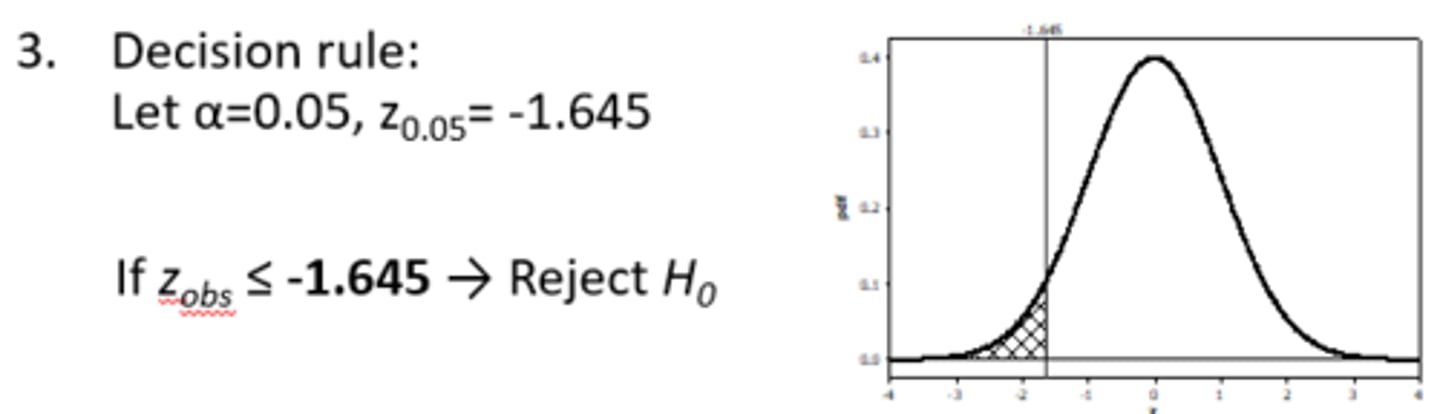
Example #3:
Central Limit Theorem - Steps #3
Example #3:
Central Limit Theorem - Steps #4
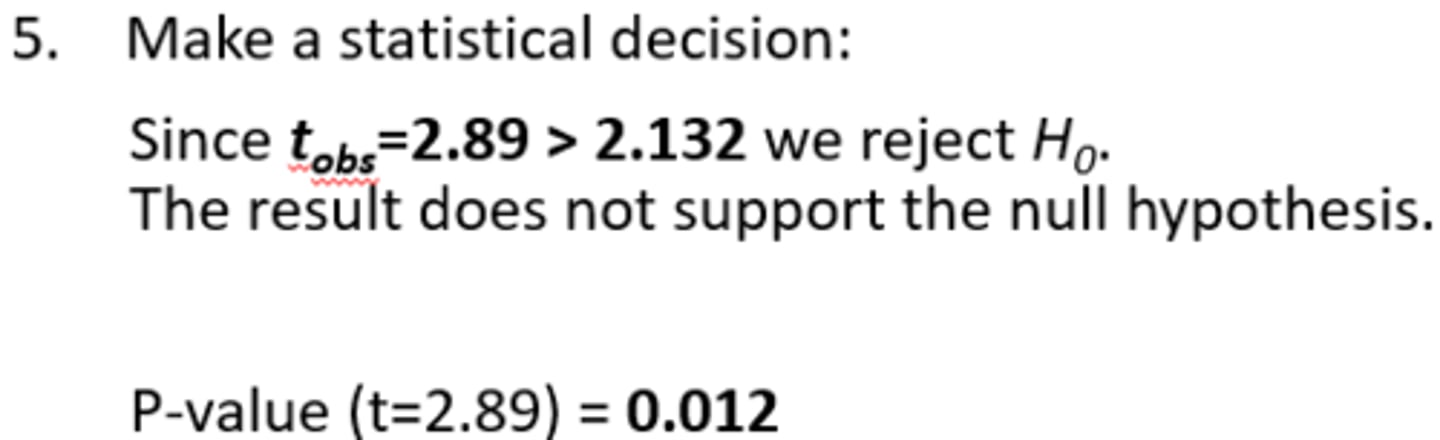
Example #3:
Central Limit Theorem - Steps #5
Sample Size Considerations
- In Example 1 we could not reject H0, we had:
n = 9, x ̅ = 16.1 years, and σ = 5
- If we had the same results with a larger sample of n=64, then, zobs = 1.76 and we would reject the H0
*Need larger sample size to trust result or reject or not
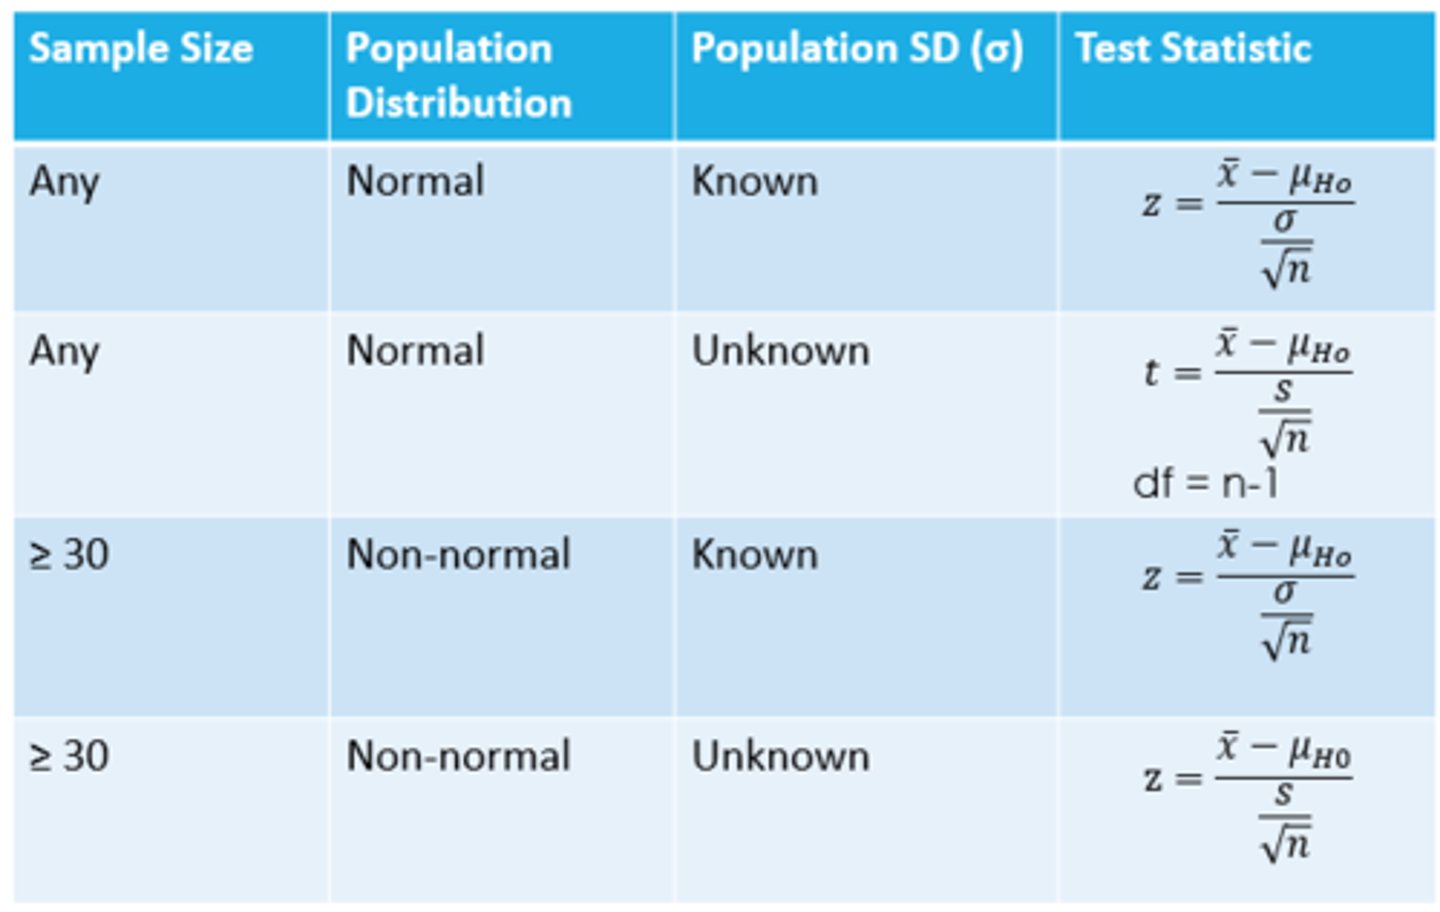
Criteria for Selecting Z-Test vs. T-Test
*This difference in decision making is because of the sample size
A significance test based on a small sample may not produce a statistically significant result even if the true value differs from the null value.
This type of result is known as:
a) The significance level of the study
b) The power of the study
c) A Type 1 error
d) A Type 2 error
Answer = D