BIOL 104 Vocab Pt. 2
1/101
There's no tags or description
Looks like no tags are added yet.
Name | Mastery | Learn | Test | Matching | Spaced | Call with Kai |
|---|
No analytics yet
Send a link to your students to track their progress
102 Terms
Ecology
the scientific study of the relationships between organisms and their environment (i - study of the relationship between organisms themselves, ii - between organisms and their environment)
Individual
a single living organism; the fundamental unit of study in ecology
Population
a group of individuals of a single species, living together and interacting with each other
Community
a group of individuals of more than one species, living together and interacting with each other
Ecosystem
the complement of biotic and abiotic factors that interact in a system
Species richness
the number of species in a community
Rarefaction curve
Quantifying Diversity - more effort
Ways to apply more effort in quantifying diversity: more time, greater efficiency, more space, greater diversity of methods
Control for Effort
When comparing the diversity of different ecological communities, it is important to control for effort
Species evenness
Measures how equally abundant different species are in an ecosystem (similar number of individuals between species)
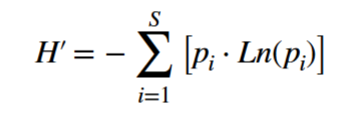
Shannon-Wiener Diversity Index
Used to take into account species richness and evenness into a single measure
p i - proportion of the i-th species in the community
S - number of species
H’ - weighs species richness by relative abundance
Rank-Abundance (Whittaker) Plots
Rank species according to absolute or relative abundance; plot rank vs. log(abundance) or log(relative abundance)
The length of the curve shows richness, rate of decline shows evenness
Community Patterns
Most communities exhibit a common pattern of a few species with high/intermediate abundance and many rare species
Scale
the extent (size) of the area we study - defining the scale that is relevant to a community is difficult, natural boundaries are a good measure
Species (Richness)-Area relationships
Power law: S = cA^Z
Take log of both sides: Log(S) = Log(C) + Z * Log(A)
The slope Z varies across different taxonomic groups, but generally is a value that is consistent with a doubling of the number of species for every 10-fold increase in island area
Species richness change
Through the processes of extinction (-1) and colonization (+1)
Low richness
greater rates of colonization relative to extinction leads to increase in richness towards equilibrium
High richness
Greater rates of extinction relative to colonization, richness will decrease towards equilibrium
Equilibrium Theory of Island Biogeography
The number of species present on an island is determined by a balance between immigration and extinction
Global species distribution
More species richness in the tropics than closer to poles
Hypotheses for Latitudinal Species Gradient
1 - Species diversify faster in the tropics
2 - Species have diversified longer in the tropics
3 - Primary productivity (the amount of energy fixed by autotrophs) is greater in the tropics
4 - Mid-domain effect (statistical null-model)
Known Species #
We’ve cataloged 2.2-2.5 million species
Methods of Estimating Total # of Species
1 - extrapolate temperate species abundance to tropical species
2 - extrapolations from detailed study of a particular group
3 - extrapolations using species characteristics
4 - extrapolating via rarefaction curves
4 Factors that regulate abundance of population
Birth, death, immigration, emigration
Population Ecology Master Equation
Delta(N) = B - D + I - E
Population Master Equation (Net gain/loss of individuals)
Nt+1 = Nt + Bt - Dt + It - Et
Population Master Equation (per-capita)
Nt+1 = Nt( 1 + bt - dt + it - et)
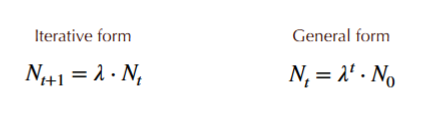
Discrete geometric (exponential ) growth
N - number of individuals; abundance or density (which is abundance/area)
t - index variable, counts number of generations
gamma (or R) - per-generation factor of increase, dimensionless (has no units)
Population grows if gamma > 1, population declines if gamma < 1. Used for populations with synchronous reproduction.
Semelparity (d=1)
One reproduction event per lifetime of an individual (female). Death usually occurs very soon after reproduction because parent invests all their resources into reproduction. Often have many, poorly provisioned progeny with low chance of survival.
Iteroparity (d<1)
Multiple reproductive events per lifetime of an individual (female). Often coincident some form of paternal investment (animals) or extra provisioning (plants) that increases the survival of progeny.
Life-History Tradeoff
Synchronous Reproduction
Common in seasonally driven systems, aligning periods of resource abundance with reproduction and resource scarcity with the resilience stages
Asynchronous Reproduction
Births and deaths can happen any time, leading to a more ‘disorganized’ pattern of population growth
Demographic Stochasticity
The changes in population abundance can be variable depending on the timing of demographic events
As population grows, time between events like birth and death that change population size get smaller, so demographic stochasticity becomes less important as a population gets larger
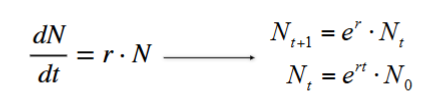
Continuous-Time Exponential Growth
N: number (density) of individuals
t: time
r: ‘intrinsic rate of increase’ r = b - d
Population grows when r>0, population declines when r<0
Continuous: population changes continuously through time
Environmental Stochasticity
Weather; years with poor weather can cause direct mortality or generate food shortages, leading to population decline
Density Dependence
When demographic rates such as birth or death change with population density
Periods of high population abundance can lead to food shortages, which can lead to decline
Carrying Capacity
Occurs at the density where birth and death rate are equal
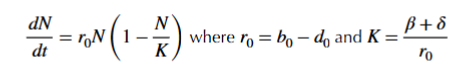
Logistic Growth
When the effect of density on gamma is linear
Continuous growth populations will approach their carrying capacity smoothly
Discrete growth populations can approach smoothly or overshoot above and below
Exploitative Competition
Individuals reduce the availability of resources such as food, water, light, and space
Interference Competition
Individuals physically prevent access to resource or opportunities such as territiories, mates, and nesting sites
Negative Density-Dependence
Effect of competition, declines in birth rate or increases in death rate
Abiotic Drivers
The non-living environment, including climate, chemical nutrients, habitat, etc. Characteristics impact where a species can grow and where it cannot
Biotic Drivers
The impact of heterospecifics (other species) have on a population via competition, predation, mutualism, or as their food resource can impact where a species can grow and where it cannot
Dispersal Barriers
Physical barriers can impede species from moving into areas that are otherwise suitable for them
Hutchinsonian Niche
The set of environmental conditions that permit a population to grow (environmental conditions for which gamma>1)
Metapopulation
A set of local populations (patches) coupled by the movement of individuals (ie immigration and emigration) among patches
Spatial Insurance
Having many patches can provide spatial insurance if extinction risk is uncorrelated across the landscape (but smaller patches can increase extinction risk at the same time)
Exploitative Interactions
Form the backbone of food chains/webs; characterized among pairs of species.
Adding more of the ‘resource’ species would increase the growth rate of the ‘consumer’; adding more ‘consumer would decrease growth rate of ‘resource’
Heterospecifics
individuals belonging to different species that interact with one another
Trophic Level
The number of links between a species and the base of the food web plus one
Bottom-Up Regulation
Herbivore carrying capacity is regulated by the supply of food (plants)
Top-Down Regulation
Plant carrying capacity is regulated by herbivory
Competitive Exclusion Principle
Two species competing for the same limiting resource in the same habitat cannot coexist indefinitely
Character Displacement
Differences among species characteristics are accentuated in regions where they overlap, leading to niche partitioning
Niche Partitioning
Allows for the coexistence of competing species, even when there is some overlap; there are many forms of niche partitioning
Resource Partitioning
competing species partition their use of resources such that each species’ growth is limited by a different resource
Predator Partitioning
Competing species are impacted by different predators or pathogens so that no one competitor can competitively exclude others
Temporal Partitioning
Competing species partition variation in the environment through time
Species need to have different sensitivities to the environment and be able to survive through unfavorable periods
Spatial Partitioning
competing species partition fine scale variation in the spatial environment; each species has some part of the environment where it is the best competitor
Interference Competition
Species can negatively impact each other by impeding their competitors access to a resource
Preemptive Competition
‘First-come, first serve’; occurs when a species utilizes a non-replenishing resource
Rule for Outcome of Competition
For a pair of competing species to coexist, each must have a greater negative impact on the growth rate of its own population (conspecifics) than on the growth of its competitor
If this is not true, one species will always exclude the other
Niche Complementarity
Coexisting species that partition niches make more complete use of available resources
There is a limit to the amount of niche space that a community can ultimately fill
Selection Effects
More species means a greater chance of including those that are more productive
Mutualism
Mutually-beneficial (positive) interaction between a pair of species
Differs from symbiosis, in which species interact and at least one benefits and none experience harm
Resource-Based Mutualism
Species engage in resource sharing; can be particularly prevalent when acquiring certain types of resources is difficult (ex: lichen = algae+fungi)
Primary Macronutrients
N, P, and K
Secondary Macronutrients
Ca, Mg, and S
Micronutrients
B, Cu, Fe, Mn, Mo, Zn, and Cl
Nitrogen Fixation
N2 gas is unusable by plants, broken (or ‘fixed’) into a usable form (NH3). Occurs through bacteria/archea living in root nodules, lightning, and industrial processes.
Root Nodules
Found in legumes, the most common nitrogen fixing plants; house bacteria and provide carbon, water, and other nutrients in exchange for nitrogen
Service Mutualism
One species provides a service (cleaning, pollination, seed dispersal) in exchange for resources (food, safety)
Mutualism/Parasitism Continuum
When costs exceed benefits, mutualism becomes parasitism
Parasitism
An exploitative interaction between a host (resource) and parasite (consumer)
Disease
A condition that impairs some structure or function of a living organism
Parasitism vs. Predation
Predators attack more than one victim in their lifetime while parasites attack only one victim in their lifetime
Virulence
The negative impact of a parasite on its host; diseases need to migrate to new hosts because of this
Transmission
Linked to virulence; the ability to infect new hosts is how parasite/disease fitness is measured
SIR Epidemic Model
Susceptible individuals in a population become Infected, transmission rate (beta) is the rate of change from S to I
Infected individuals Recover (or die) ar a constant per-capita rate v
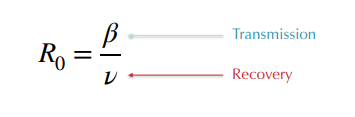
R0 (Basic Reproductive Number)
Derived from SIR model; the number of individuals that will become infected by the first infected individual in the population
If R0 > 1, the infected population will grow
If R0 < 1, the infected population will shrink
Contributions of Disease
Regulating the abundance of species (top-down) - viral shunt
Providing subsidies from one ecosystem to another
Vaccination
Vaccination makes a fraction (V) of the population no longer susceptible, so R0 declines, meaning an epidemic becomes less likely
Fluxes
The processes that move energy and matter between different pools of an ecosystem
Primary production, respiration, nitrogen fixation, decomposition
Pools
The different states where energy and matter are stored
Biomass, atmospheric carbon (and other gases), soil nutrients
Primary Production
The foundation of all ecosystems since it is where energy (carbon) enters the living components of ecosystems
Gross Primary Production (GPP)
Measures the total rate of energy (carbon) fixed by photosynthesis
Net Primary Production
Measures the rate of energy fixed by photosynthesis that is stored as biomass, accounting for losses due to respiration
NPP = GPP - R (respiration)
Oceans and Terrestrial ecosystems each contribute ~half of global NPP
NPP of Land
Substantial variation in NPP across terrestrial environments, generally more variation in the tropics.
NPP of Oceans
Most of the ocean has very low NPP, the warmest parts of the ocean are not the most productive
Upwelling zones (where deep water returns to the surface) and coastal shelves (which have limited depth) have the greatest NPP
Liebig’s Law of the Minimum
Nutrients set the limit on how much carbon can be converted into biomass by photosynthesis
Only by increasing the amount of the nutrient that is most limiting, can a plant or crop achieve a greater yield
Nutrient Limitation
Nutrient addition (fertilization) weakens the strength of negative density dependence (resulting in an increased population density)
Residence Times
Tell us the amount of time a nutrient (or other agent) will spend within a particular ecosystem
Chronosequence of N
Over time total N increases in an ecosystem due to nitrogen fixation by organism
Chronosequence of P
Over time total P decreases through occlusion and leaching
Succession
The pattern of development of a typically terrestrial ecosystem
Primary Succession
Process of succession starting from bare rock (ex: the formation of a new volcanic island)
Secondary Succession
Succession following a disturbance in an already existing ecosystem (ex: fire, flood, drought)
Free Air CO2 Enrichment (FACE) Experiments
Experiments model conditions with greater concentration of CO2, use controls and replication and each consider the role of secondary treatment such as fertilization, herbivory, and ozone gas
Peat
An accumulation of partially decayed vegetation or organic matter, found in peatlands
Peatlands comprise app. 3% of Earth’s land but store 1/3 of Earth’s soil-based carbon; hold 2x as much carbon as forests