4.1 - TP & imperfect competition: H & F monopoly case
1/18
There's no tags or description
Looks like no tags are added yet.
Name | Mastery | Learn | Test | Matching | Spaced | Call with Kai |
|---|
No analytics yet
Send a link to your students to track their progress
19 Terms
Previous assumptions used for modelling
1st best world
perfectly competitive markets
P = MC
S = D in equilibrium
No markup - P/MC = 1
Mark ups in reality
Mark ups exist - >1
Therefore there is imperfect competition to some degree
Recent decades show mark ups trending upwards
Home monopolist example - Assumptions (no FT)
Single firm selling homogenous good
Firm is a price maker - influence over p
P > MC (mark ups)
Given that D is downwards sloping, to sell more it has to lower p
Extra Q = P down → revenue donw
MR is below D
Home monopolist example - no trade equilibrium graph
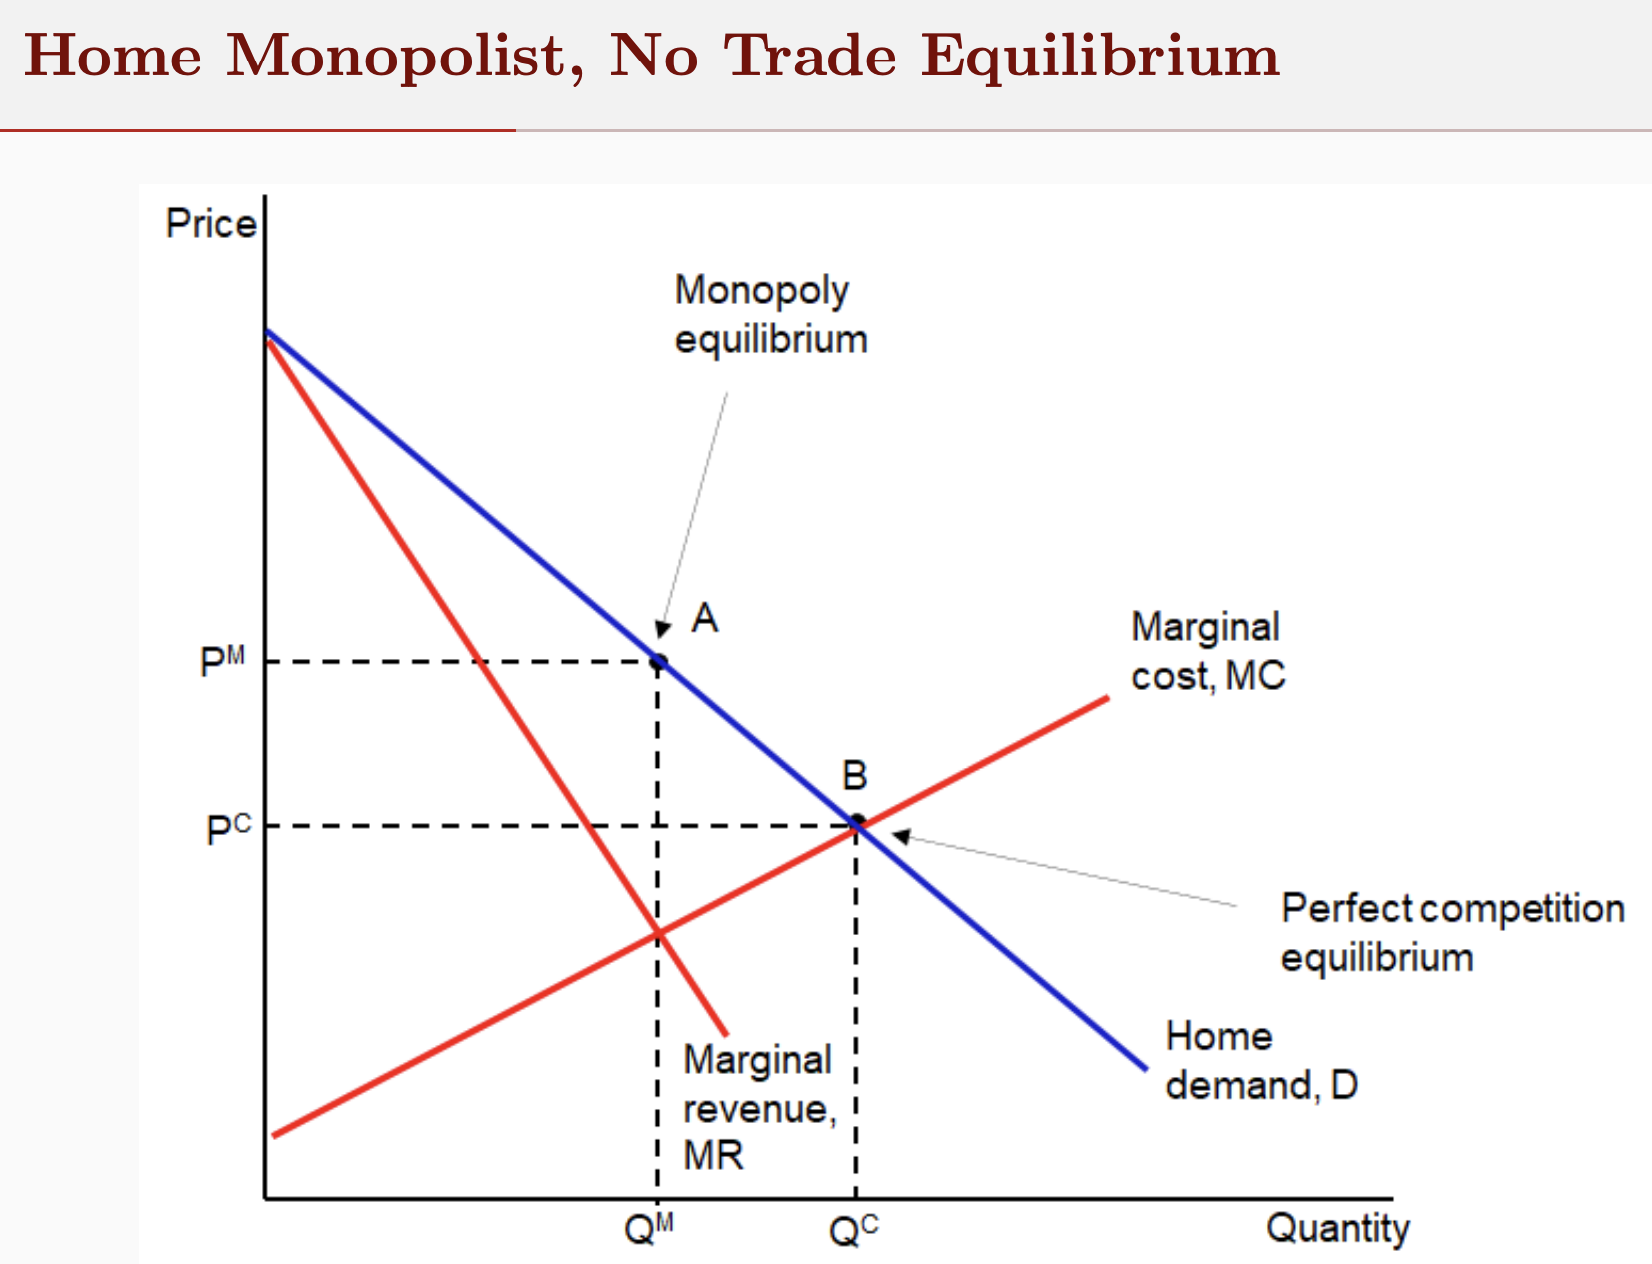
Home monopolist example - no trade equilibrium graph explained
A - Monopoly equilibrium
B - Perfect comp equilibrium
MR = MC - profit max
lower Q & higher p that in perfect competition

Home monopolist example - Assumptions with FT
H is small country - faces fixed world p (pw)
X Supply curve
D curve the monopolist faces is no longer just dom D as pd>pw will have 0 demand
Since increasing Q =/ price decrease → MR constant & = pw
Home monopolist example - FT graph
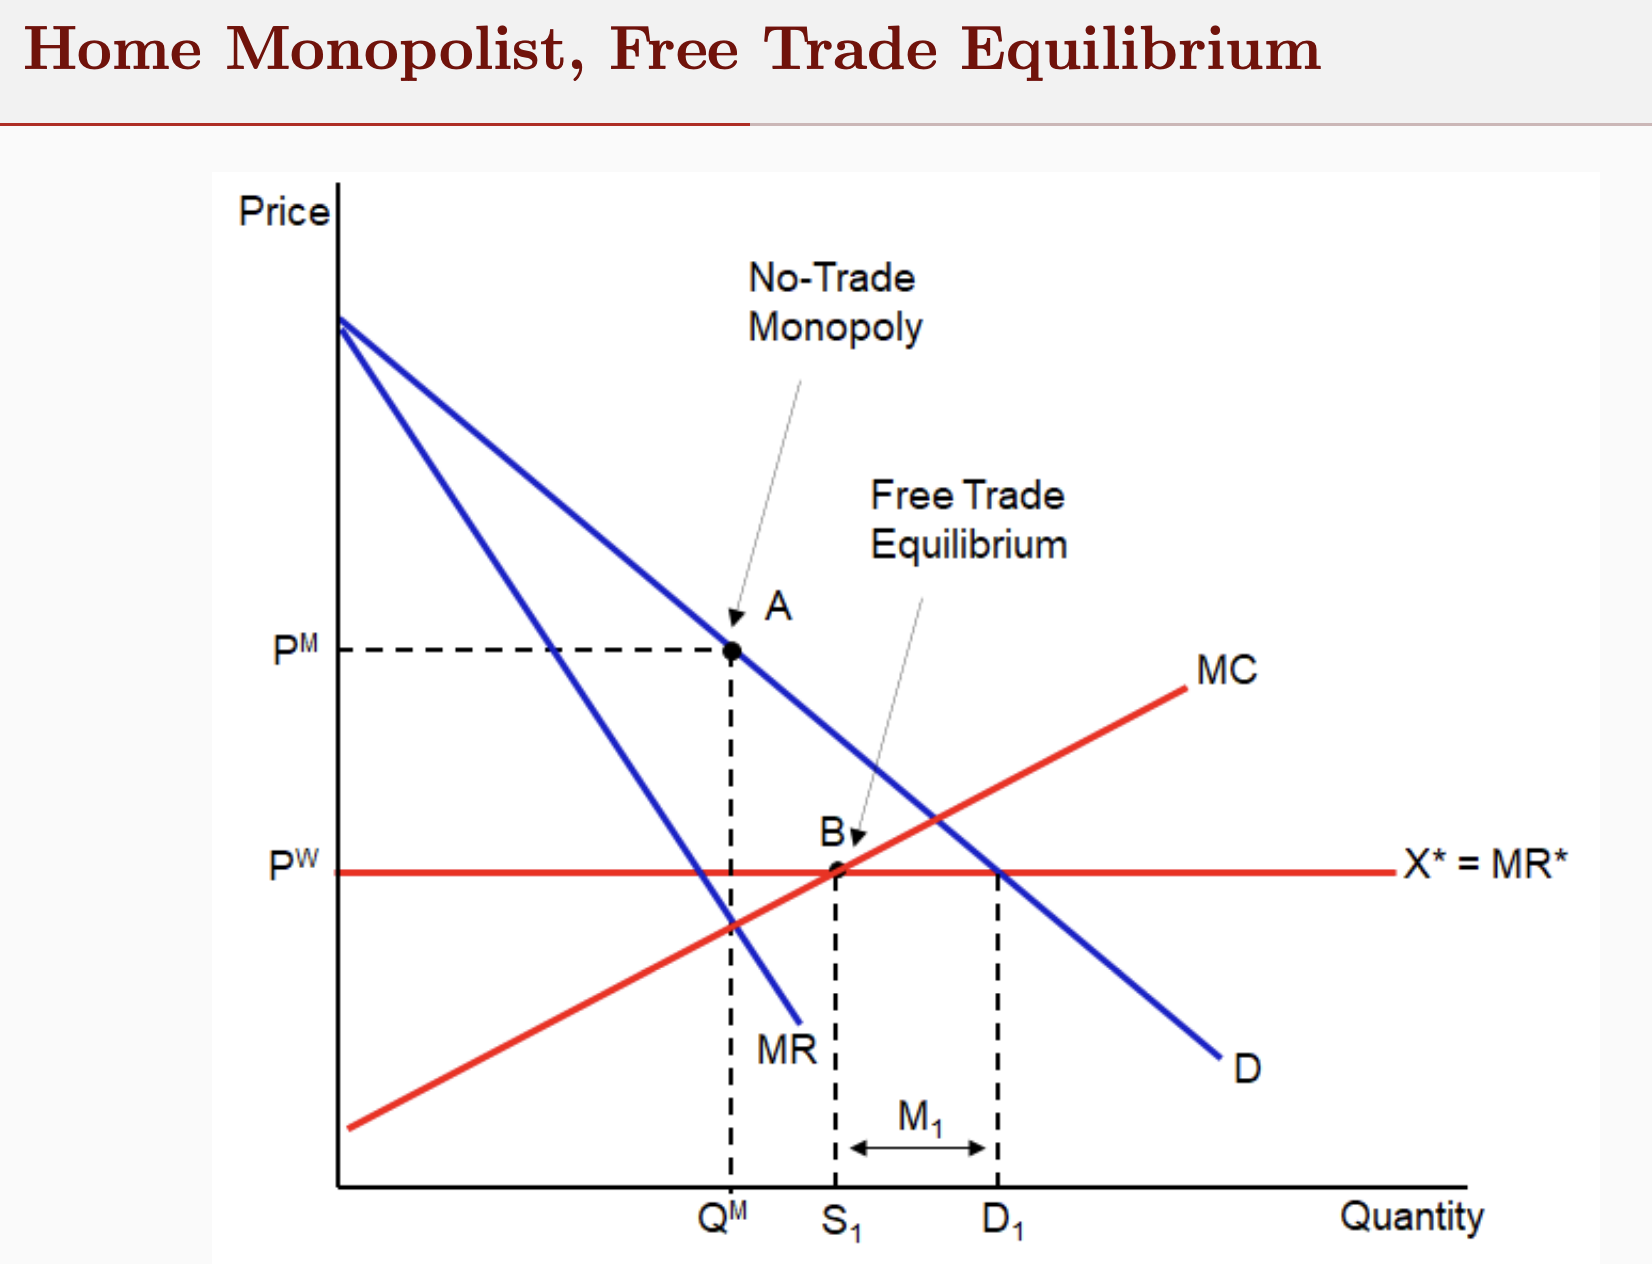
Home monopolist example - FT equilibrium graph explained
A - no trade monopoly equilbrium
B - FT equilibrium
Under FT monopolist takes fixed pw
Set p = MR (in this case = MC)
Q = S1
Consumers D D1 at price pw so M needed to cover dom deficit
Same result as under perfect competition

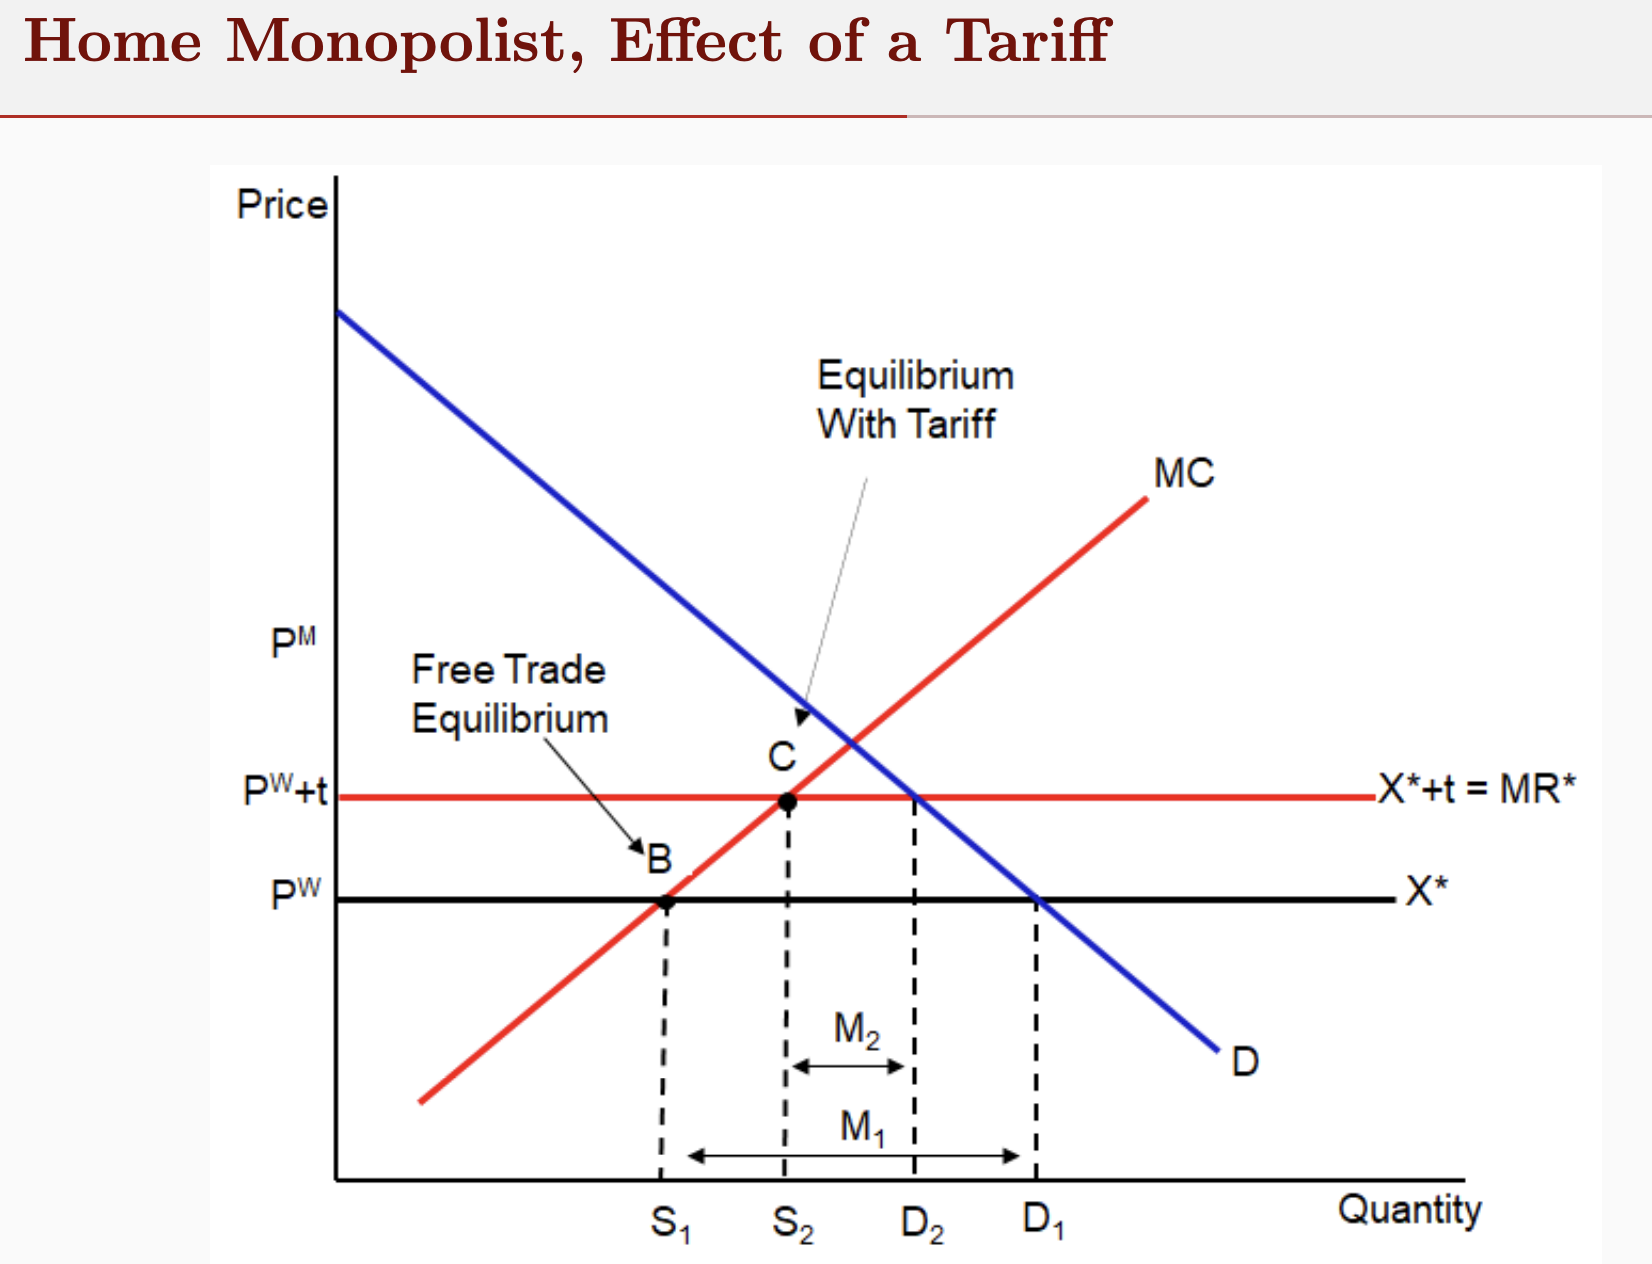
Home monopolist example - Trade with tariff graph

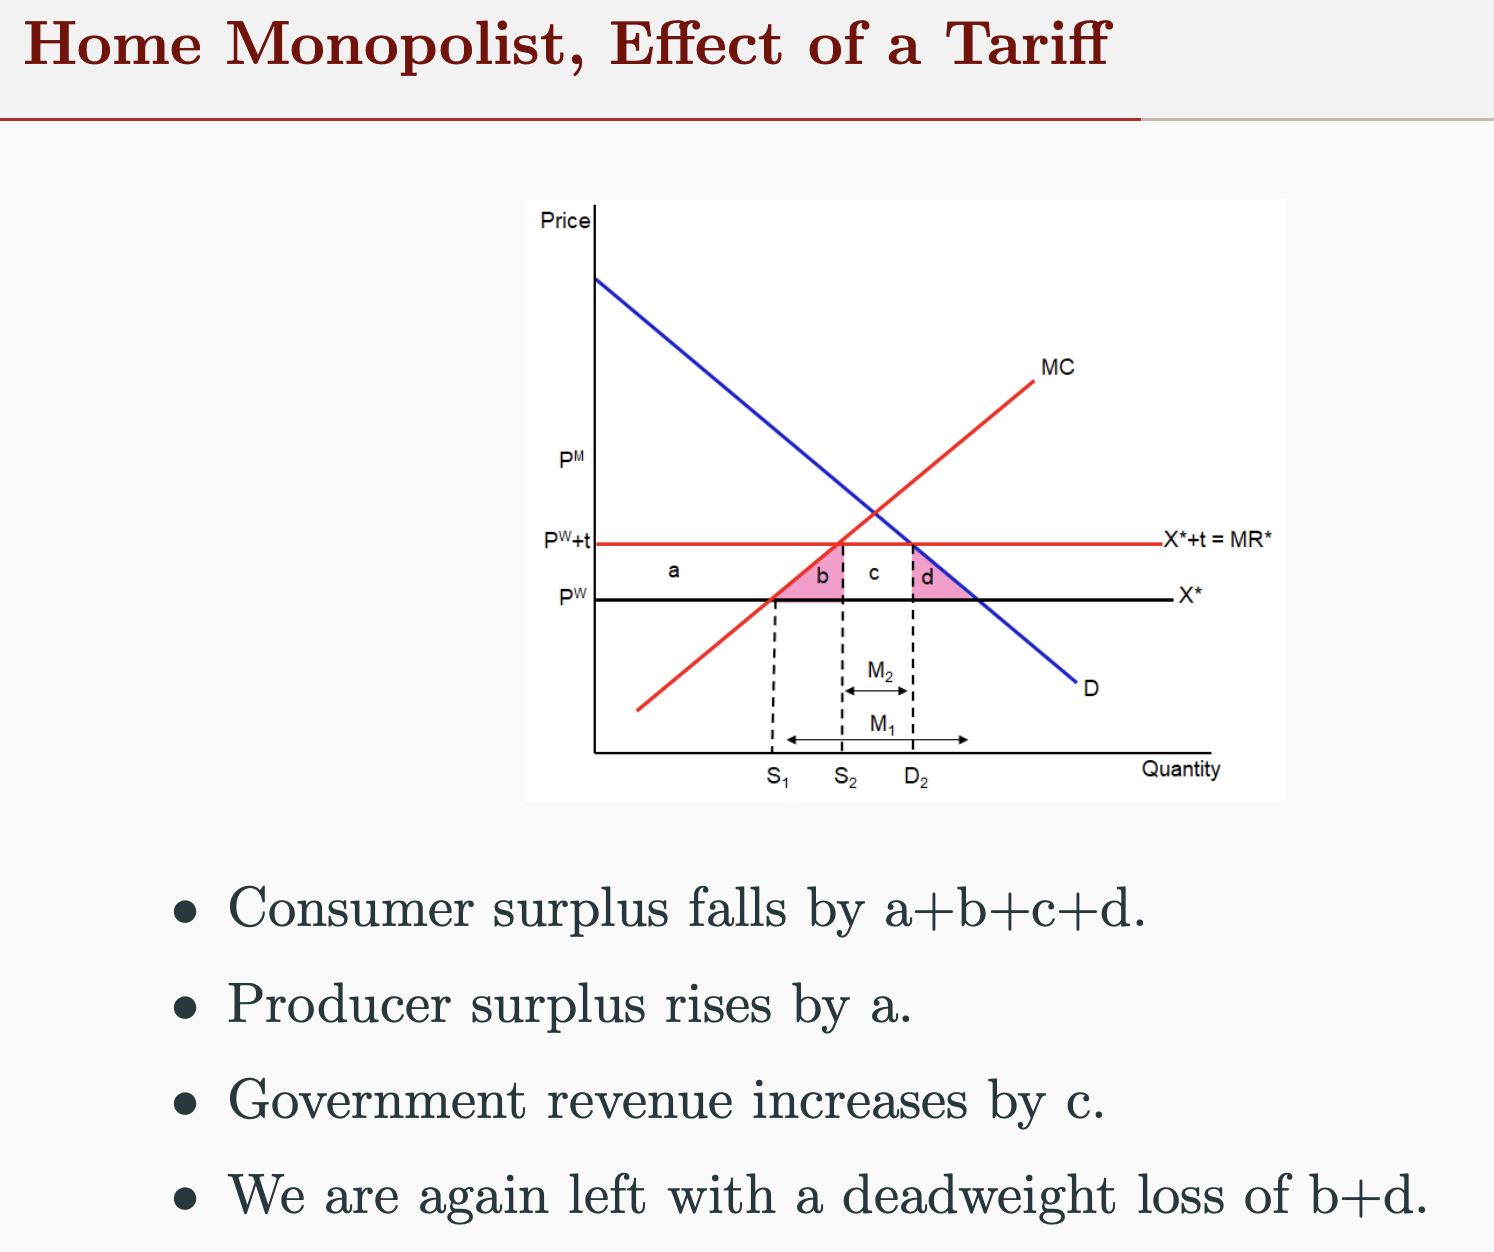
Home monopolist example - Trade with tariff graph explained
B - FT equilibrium
C - Equilibrium when tariff present
With pw increased to pw+t
S increases (S1 → S2)
D decreases (D1 → D2)
M falls (M1 → m2
Still same result as under perfect comp (including losses)
Home monopolist - Trade with tariff welfare effects
Home monopolist - Trade with quota assumptions
Choose quota that restricts M to same as under tariff (M2)
Effective D curve = D - quota
can be seized by F firms
Monopolist can still influence p
chooses profit max for residual D
Home monopolist - Trade with quota graph
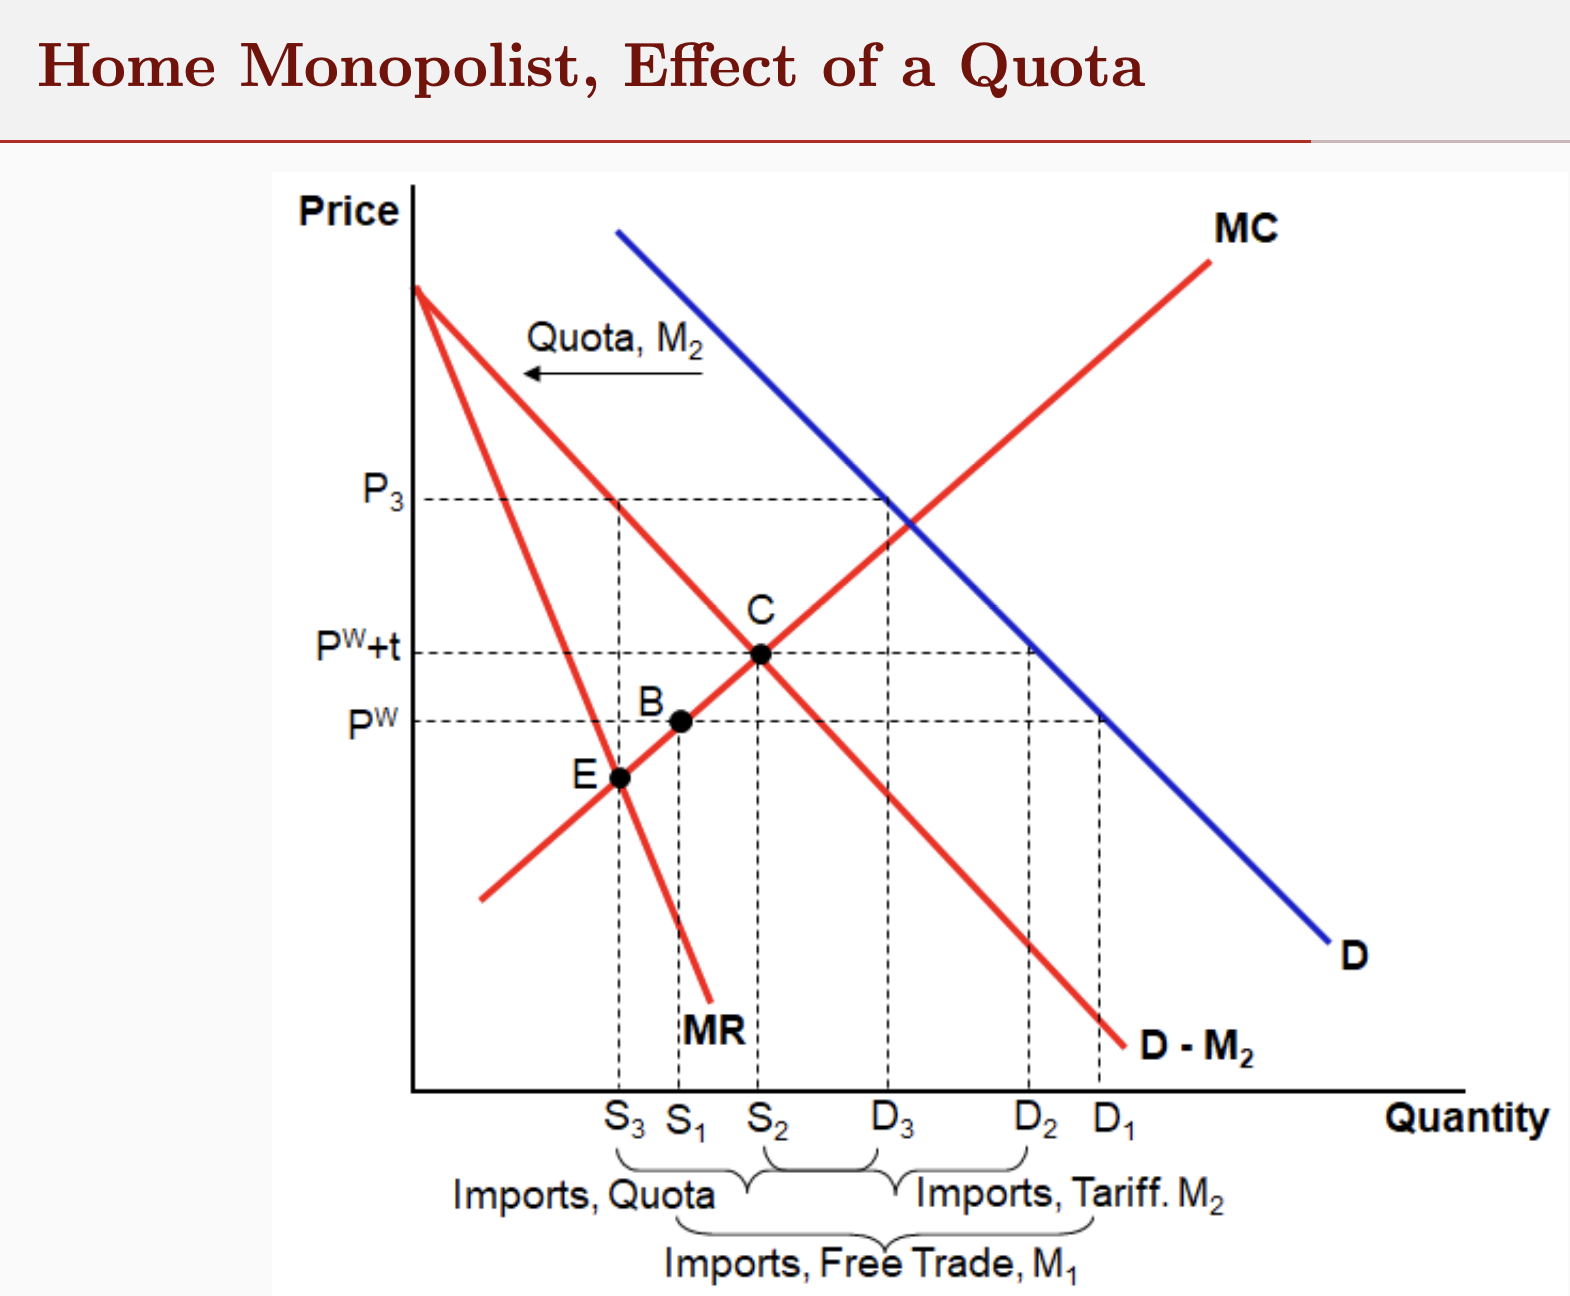
Home monopolist - Trade with quota graph explained
With quota, the monopolist sets Q where new MR = MC (E)
S = S3 P = P3 D = D3
M same as under tariff (M2)
Under FT monopolist produces as B
Under tariff monopolist produces at C

Home monopolist - Trade with quota welfare
With Quota, monopolist sets p at p3
p3 > p2 → CS falls & so DWL rises
PS increases
As P increases, QR increases (P3 - pw * M2)
with H monopoly QR > tax revenue with tariff
however QR can be wasted on rent seeking activity + can go to F firms
DWL under quota > tariff
Foreign monopolist - Assumptions
F firm exports as a monopoly
No competing H firms
not realistic but makes analysis easier
F monopoly profit max in X market
MRH = MCF
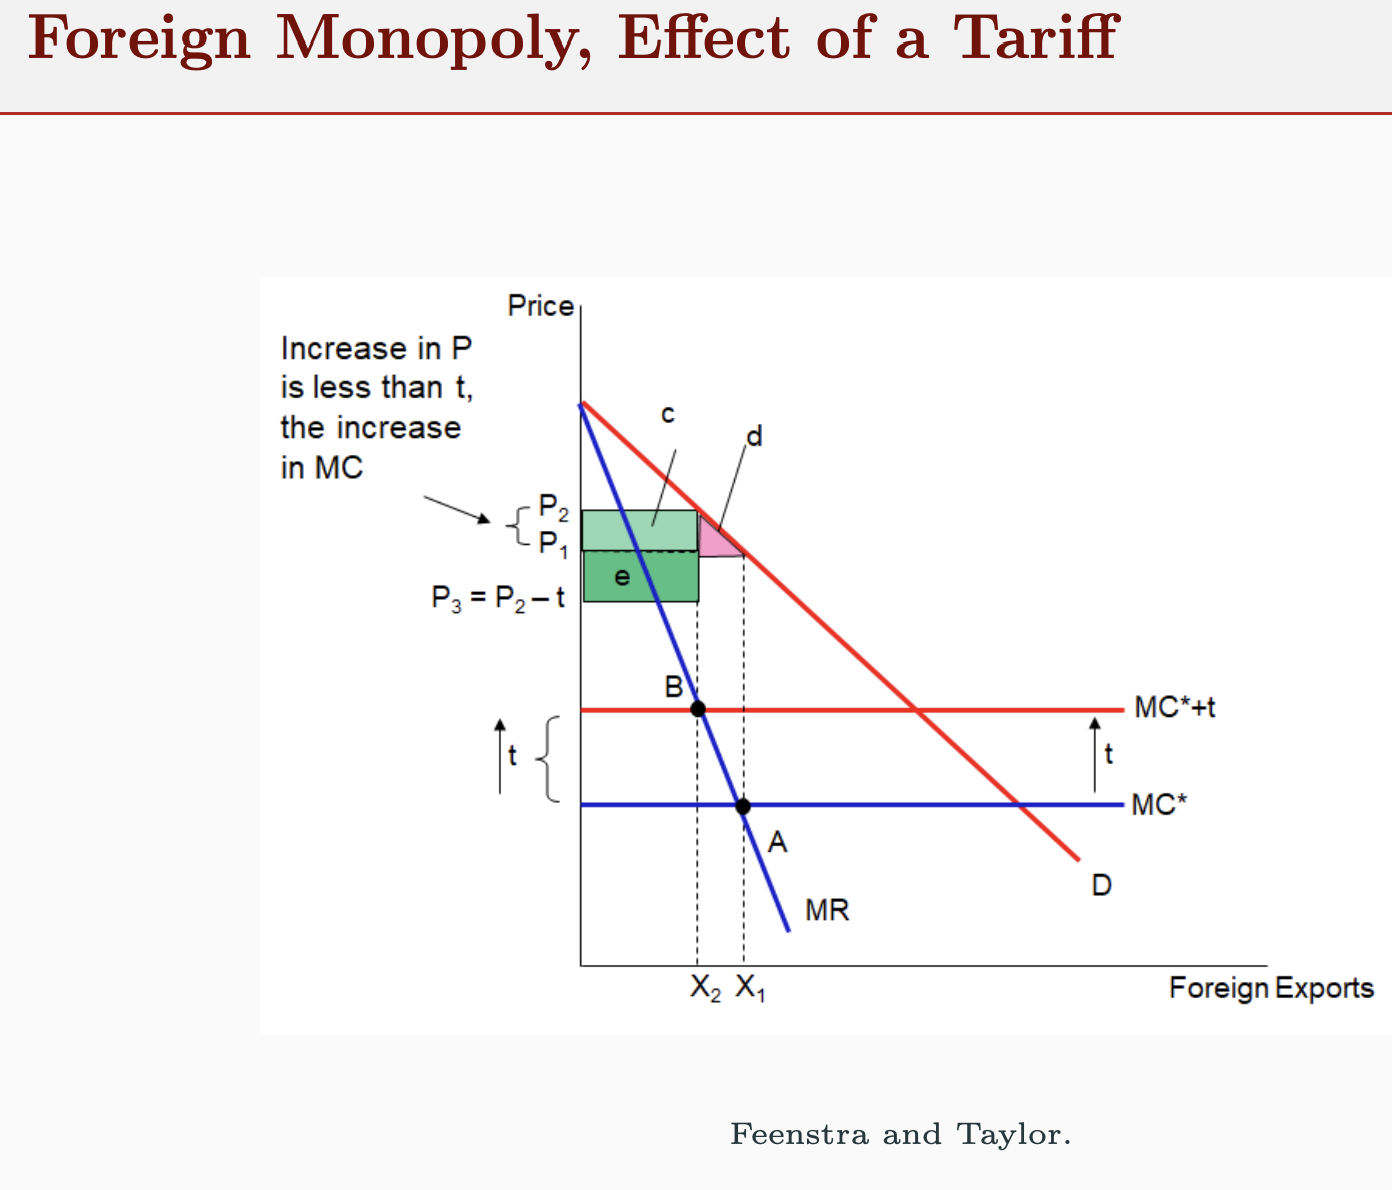
Foreign monopolist - effect of a tariff graph

Foreign monopolist - effect of a tariff graph explained
A - FT equilibrium
B - Effect of tariff equilibrium
MC increases by t
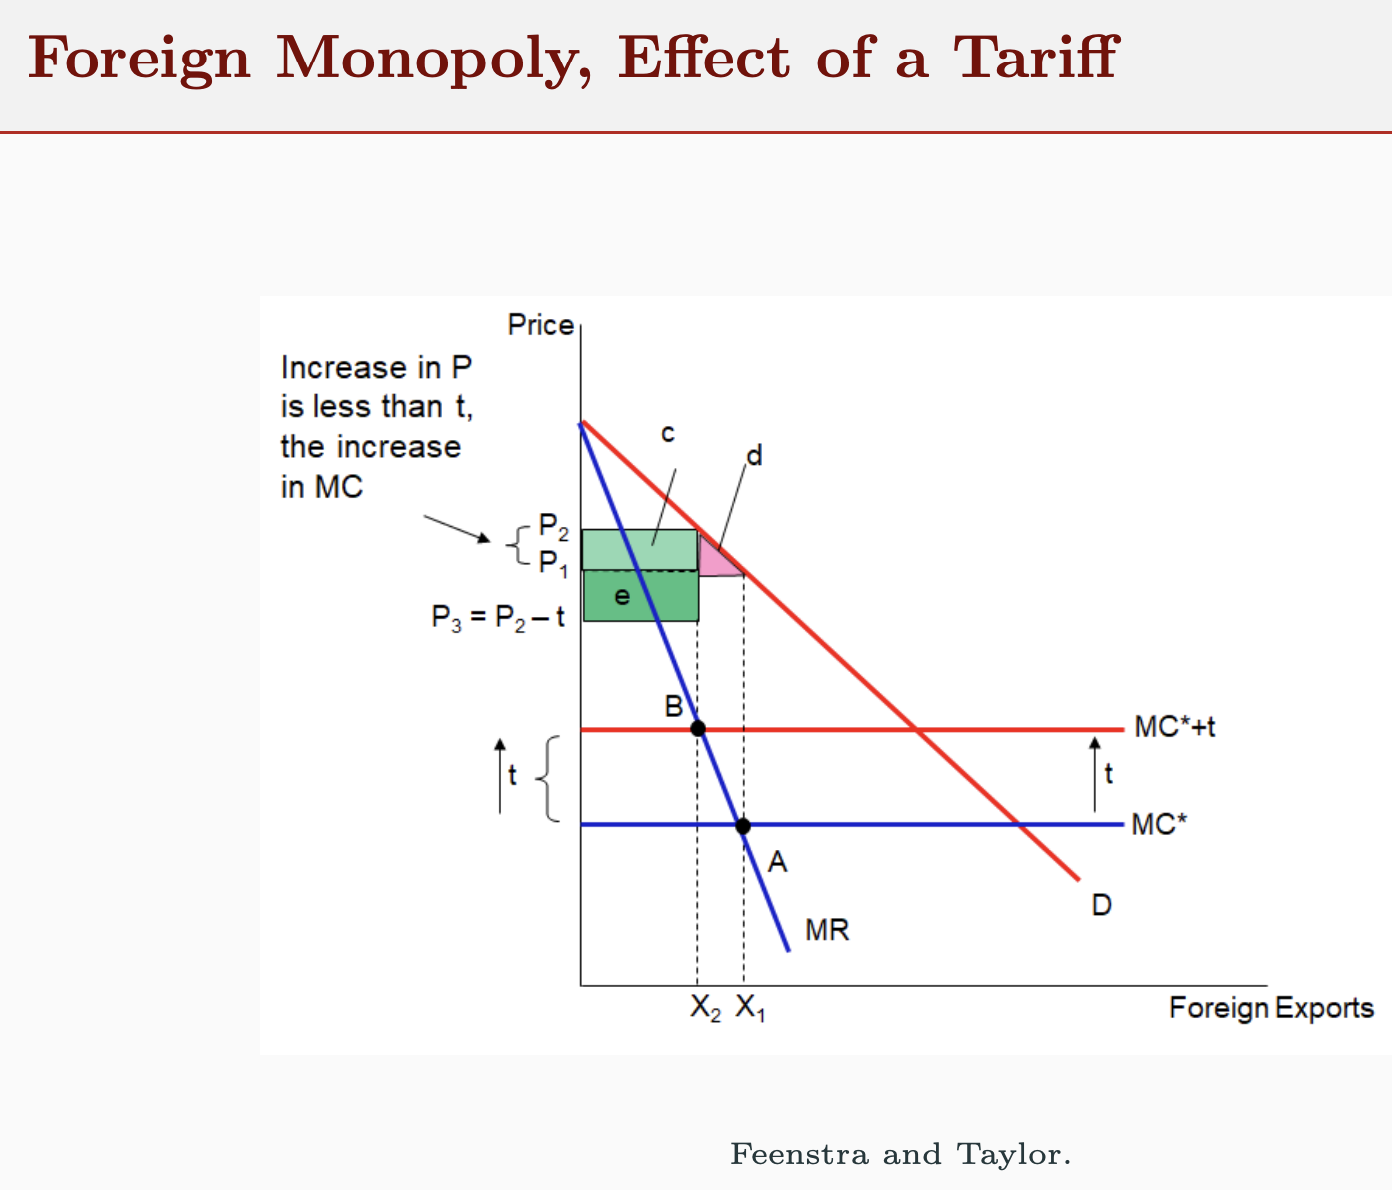
Foreign monopolist - welfare effect of tariff
CS falls: -(c+d)
Govt revenue: c+e
Home welfare = e - d (same as large country case with perfect comp)
Exporter P falls (P1 → P3)
TOT gain for H: e