251 final exam
1/75
There's no tags or description
Looks like no tags are added yet.
Name | Mastery | Learn | Test | Matching | Spaced | Call with Kai |
|---|
No analytics yet
Send a link to your students to track their progress
76 Terms
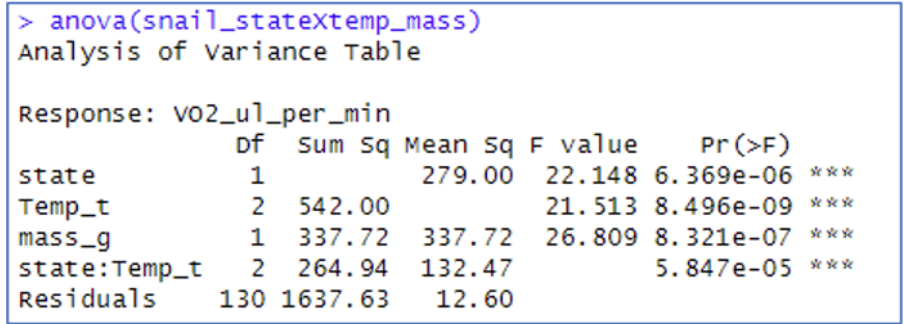
What is the sample size of this study?
137 (Add all DF +1)

How many factors and levels within factors are there in this model?
2 factors, state and Temp_t. The levels are 2 for state and 3 for Temp_t.
(a factor is a data used to represent categorical variables variables that take on a limited number of distinct values ie. weight would be a numeric variable) to calculate levels its just the DF+1
What does Sum Sq tell us about the data
This is the amount of total variation in parasite count that is explained by a variable sex, transect year etc.
(largest SS value explains the most variance in data)
what does F value us about the data
compares the variance explained by a variable ie sex to the variance left unexplained (residuals)
what does P value us about the data in an anova?
This is statistically significant (p < 0.01), or not stat sig (p > 0.01), suggesting ie for sex that males and females have significantly different parasite loads if value is <0.01
if a P value in a T.test shows p-value = 0.5354, what does this mean?
Since p > 0.05, you fail to reject the null hypothesis.
In simple terms: there is no significant difference between the two group means.
What are the main drivers of Distributions?
Abiotic Temperature, light, water, chemicals, oxygen
Biotic Interactions: competition, predation, disease
Behaviour: Habitat selection and dispersal
Disturbance: Natural or human caused impacts on biotic/abiotic
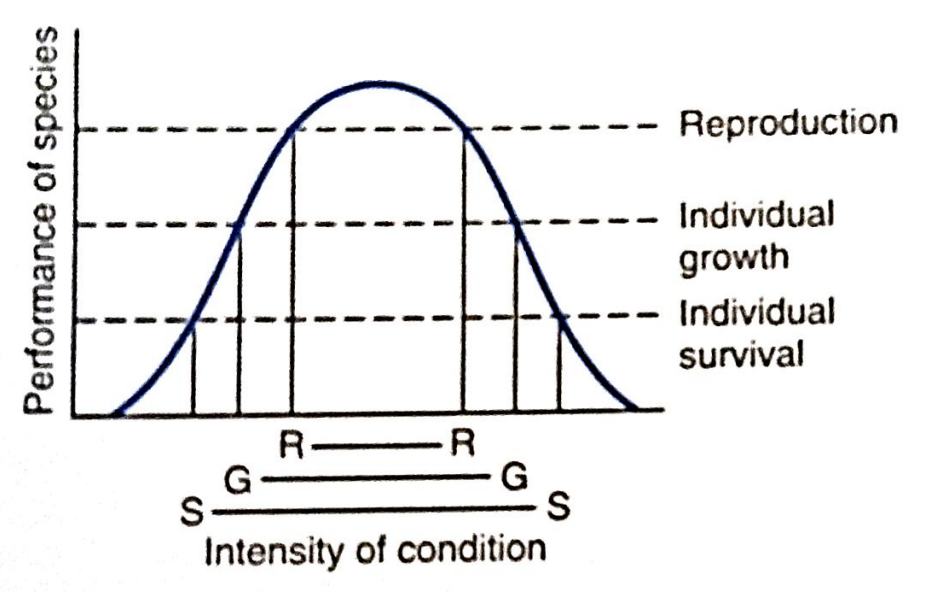
What is Tolerance (inc. graph)
Physiological limits of a species to survive grow and reproduce in response to a particular abiotic factor.
Fundamental Niche
The ecological space (biotic and abiotic) occupied by a species in the absence of competition and other interactions with other species.
Rapports rule
species typically have larger area at higher latitudes (closer to the poles) compared to lower latitudes (closer to the equator)
Temporal scale
timeframe over which an ecological process is studied, ranging from short-term (e.g., daily fluctuations in plant photosynthesis) to long-term (e.g., climate change over centuries) and very long term ~broad biogeographical patterns
Spatial scale
geographical extent at which an ecological process is studied, ranging from micro-scale (e.g., individual plant interactions) to macro-scale (e.g., distribution of species across a continent)
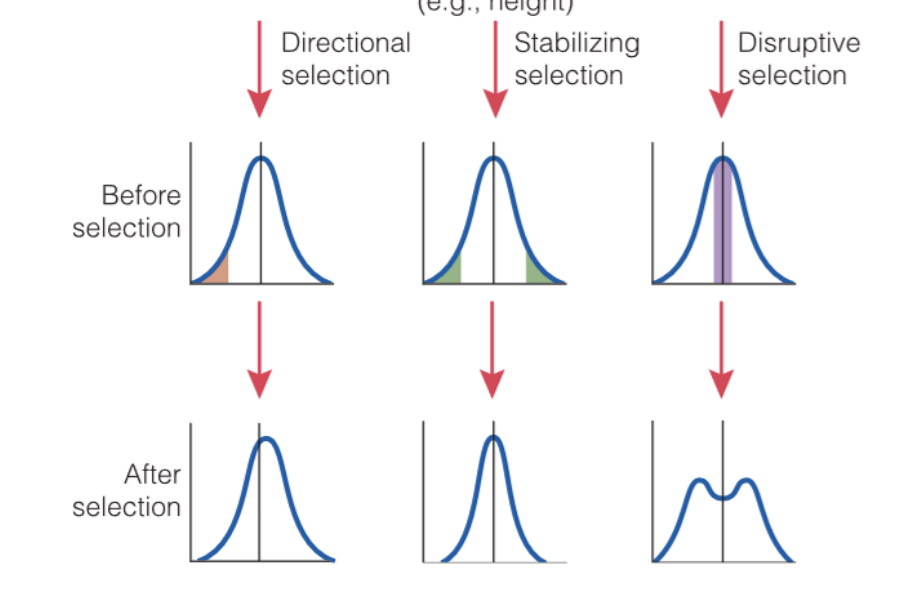
3 types of selection on phenotypic characters, individuals coloured areas are selected against (graph)
Reid’s paradox
contradiction between observed rates of plant range expansion and the theoretical rates predicted by dispersal models
difference between virulence and sublethal effects
Virulence describes the severity of a pathogen's ability to cause disease, while sublethal effects are non-lethal negative impacts on an organism or population caused by exposure to a toxicant or other stressor
How does a taxonomic definition of a community differ from a functional definition?
Taxonomic definitions group species based on shared classifications, while functional definitions group species based on similar ecological roles or functions.
Q: What is a constraint of defining a community based on species presence alone?
A: It may overlook species interactions and functional roles, potentially misrepresenting ecological dynamics.
Q: Why can defining communities spatially be problematic?
A: Arbitrary spatial boundaries can exclude interacting species or include species not ecologically linked, limiting accuracy.
Q: What is a limitation of using species richness alone to compare communities?
A: It ignores species abundance and evenness, so communities with very different structures can have the same richness.
Q: Why might researchers use functional or phylogenetic diversity metrics instead of just species counts?
A: These metrics consider evolutionary or ecological roles, offering more insight into community function and resilience.
Why are alpha, beta, and gamma diversity useful concepts?
A: They allow ecologists to understand how biodiversity is structured at multiple spatial scales and how communities vary across environments.
Q: What is community assembly?
A: The process by which species colonise and establish in an area, influenced by environmental filtering, dispersal, interactions, and historical contingency.
Q: How can environmental gradients (change over time) influence community composition?
A: Communities may shift gradually or abruptly in response to changes in factors like temperature, moisture, or nutrient availability.
Q: How would you assess a community’s response to an environmental gradient?
A: By sampling sites along the gradient and comparing species composition, diversity metrics, or abundance patterns using statistical models.
Q: What is the difference between spatial and temporal community assembly?
A: Spatial assembly refers to variation across space; temporal assembly involves how communities change over time, such as during succession.
Q: What is ecological succession?
A: The predictable sequence of changes in community composition over time following disturbance or initial colonisation.
Q: What is the redundancy hypothesis?
A: Many species perform overlapping roles, so the loss of one may be compensated by others.
ie. in a forest, multiple species of decomposers break down dead organic matter. If one type of decomposer is lost, others can still fulfill that role, preventing a major disruption to the nutrient cycle
Q: What is facilitation in succession?
A: Early species modify the environment in ways that help later species establish (e.g., nitrogen-fixing plants improving soil).
Q: What is inhibition in succession?
A: Early colonists prevent or slow the establishment of other species (e.g., through resource competition or allelopathy).
Q: What is a legacy effect in community assembly?
A: Historical events or past species compositions continue to shape current community structure, even after conditions change.
Q: Key differences between equilibrium and non-equilibrium communities?
Equilibrium: Predictable, stable, shaped by niche-based interactions.
Non-equilibrium: Unpredictable, dynamic, shaped by chance, colonisation, and disturbance.
Q: What is the Niche Diversification Hypothesis?
A: Species coexist by occupying distinct ecological niches, reducing direct competition in equilibrium communities.
Q: What is the Neutral Theory of Biodiversity (for critique)?
A: Suggests that species are functionally equivalent and diversity is maintained by random birth, death, and dispersal—not niche differences. Often critiqued for ignoring real competitive differences.
Q: What is the Storage Effect?
A: A mechanism where species coexist by responding differently to environmental variation, using strategies like dormancy to "store" gains from favourable periods.
Q: What is the Gradual Change Hypothesis?
significant changes in living organisms and the Earth itself occur through a series of small, incremental changes over extended periods of time
Q: How does frequency-dependent selection maintain diversity?
A: Species gain a competitive advantage when rare, preventing dominance and allowing coexistence.
Q: What’s a major critique of niche-based hypotheses?
A: They assume environmental stability and complete knowledge of species’ niches, which is often unrealistic in nature.
What is the Intermediate Disturbance Hypothesis (IDH)?
biodiversity is highest at moderate levels of disturbance because it prevents both dominance by competitors and elimination by frequent disruption.
What does the Patch Dynamics Hypothesis suggest?
That diversity is maintained through a mosaic of habitat patches at different successional stages, allowing species to specialise and coexist.
Describe the Lottery Model.
It suggests that when resources become available, colonisation is random and all species have an equal chance, reducing competitive exclusion.
What are alternative stable states in ecology?
Different, self-sustaining community structures that can exist under the same environmental conditions, often hard to reverse once changed.
Give an example of an ecosystem with alternative stable states.
A lake that can be either clear with aquatic plants or turbid with algae—each state reinforced by internal feedbacks.
Why are non-equilibrium models important for conservation?
They highlight the role of disturbance and unpredictability, showing that restoring ecosystems may not always return them to a previous state.
What is an indirect effect in ecology?
When the interaction between two species is influenced by a third species, often without direct contact.
What is "apparent competition"?
An indirect effect where two prey species share a predator; an increase in one prey can lead to a decrease in the other due to elevated predator populations.
What is "trophic cascade"?
A top-down indirect effect where predators control the abundance of herbivores, which in turn affects primary producers.
How do "trait-mediated indirect effects" differ from density-mediated ones?
Trait-mediated effects result from changes in species behaviour or traits (like foraging location) due to the presence of another species, rather than changes in abundance.
What is the main difference between energy and chemical flow in ecosystems?
Energy flows one-way through an ecosystem (mostly from the sun), while chemicals like carbon and nitrogen cycle through biotic and abiotic components.
Q2: What is Gross Primary Productivity (GPP)?
The total amount of energy captured by autotrophs via photosynthesis over a given time period.
What is Net Primary Productivity (NPP)?
The energy remaining after autotrophs use some for respiration (NPP = GPP - respiration); it represents the energy available to consumers.
How can GPP and NPP be measured at local and global scales?
Locally: via gas exchange methods or biomass accumulation;
Globally: using remote sensing (e.g., NDVI), eddy covariance towers, and global carbon budget models.
What are the key factors limiting NPP in terrestrial ecosystems?
Mainly water, temperature, and nutrient availability (especially nitrogen and phosphorus).
What limits NPP in marine ecosystems?
Often limited by light (depth-dependent) and nutrients (especially iron, nitrogen, phosphorus), depending on the zone.
How do limiting factors for Net Primary Productivity- NPP differ across biomes?
In tropical rainforests, light and nutrients may limit Net Primary Productivity- NPP;
In deserts, water is the main limiter;
In oceans, nutrients like iron and nitrogen often limit productivity.
Why is terrestrial Net Primary Productivity- NPP generally higher than marine NPP despite oceans covering more area?
Terrestrial systems have more biomass, faster nutrient cycling in soils, and higher light availability. Most marine NPP occurs in shallow coastal zones despite vast open ocean.
What factors limit secondary productivity?
Energy available from primary productivity, assimilation efficiency, production efficiency, and metabolic rate (e.g., endothermy vs ectothermy).
How does production efficiency vary between taxa?
Ectotherms (e.g., insects, reptiles) have higher production efficiency than endotherms.
Endotherms (e.g., mammals, birds) invest more energy in thermoregulation, leading to lower efficiency.
How do energy transfer patterns differ between terrestrial and marine ecosystems?
Marine ecosystems often have higher trophic efficiency (due to small, fast-reproducing producers like phytoplankton).
In terrestrial systems, large producers like trees have more structural mass and slower turnover.
How do factors limiting secondary productivity differ from those limiting primary productivity?
Primary productivity is limited by abiotic factors (light, nutrients, water).
Secondary productivity depends on energy available from primary production and consumer physiology (e.g., digestion, metabolism).
E.g., even with high NPP, poor-quality plant matter may limit herbivore NSP.
What are the main ways nutrients enter the biosphere?
Atmospheric deposition (e.g., N from lightning or rainfall)
Weathering of rocks (e.g., P, K)
Biological fixation (e.g., nitrogen fixation by microbes)
How do nutrients exit the biosphere?
Leaching and erosion
Gaseous loss (e.g., N₂ from denitrification)
Sedimentation in aquatic environments
What are the key steps of the nitrogen cycle?
Nitrogen fixation (atmospheric nitrogen is converted into usable forms like ammonia or ammonium by bacteria and lightning)
Nitrification (Ammonia is converted into nitrite and then into nitrate by soil bacteria for plants to use)
Assimilation (Plants and other organisms absorb nitrogen in the form of ammonia, ammonium, or nitrate from the soil and incorporate it into their tissues)
Ammonification (Organic nitrogen in dead organisms and waste products is converted back into ammonia by decomposers.)
Denitrification (Nitrate in the soil or water is converted back into nitrogen gas by bacteria under anaerobic conditions, returning it to the atmosphere)
What limits nitrogen fixation?
Availability of Mo/Fe cofactors
O₂ concentration (nitrogenase is O₂-sensitive)
Energy supply (requires large ATP input)
How do organisms alter spatial or temporal nutrient dynamics?
Migratory animals redistribute nutrients across ecosystems
Plants with symbiotic nitrogen-fixers enrich soil over time
Mycorrhizal fungi enhance P uptake and soil nutrient cycling
Identify the three main components of nitrogen cycling at a local scale
Nitrogen inputs, internal nitrogen transformations, nitrogen losses
How to determine whether a community follows the Classical Climax Theory or the Individualistic Model of Succession
Classical Climax Theory
Consistent species composition across sites with similar environmental conditions.
Convergence of different sites toward a single, stable community over time.
(Classical climax theory in ecology proposes that ecological succession, the process of change in the species structure of an ecological community over time, eventually leads to a stable, self-perpetuating climax community)
Individualistic Model (Gleasonian)
High variability in species composition across similar sites.
No consistent climax community — multiple end states may occur.
Community composition changes depending on colonisation history and local conditions.
How can predators respond to increasing prey densities
functional and numerical responses.
A functional response refers to how a predator’s rate of prey consumption changes with prey density, often increasing at first but then levelling off due to constraints like handling time and satiation.
A numerical response involves changes in the predator population size, either through reproduction or movement into prey-rich areas, though this is often limited by time lags and dispersal barriers.
What are induced defences of plants to herbivory
Induced defences are plant responses that are activated only after herbivore attack, rather than being constantly present. These defences can be chemical, structural, or physiological, and they help reduce further damage by deterring herbivores, attracting predators of herbivores, or reducing the plant's palatability.
How do Trait-mediated indirect interactions differ from other indirect interactions?
Density-mediated indirect interactions (DMIIs) involve changes in population size (e.g., a predator reduces herbivore numbers, which benefits plants).
In contrast, TMIIs involve changes in traits, not abundance — like altered behaviour or morphology — that ripple through the food web.
'paradox of the plankton
There are many more species of phytoplankton in temperate freshwater lakes than would be expected given the limited types of resources
the different types of compensatory mortality that maintain species diversity in communities
Predator-Mediated Coexistence
Predators preferentially consume dominant or more abundant species, preventing competitive exclusion.
Example: In intertidal zones, sea stars prey on dominant mussels, allowing less competitive species to persist.
Janzen–Connell Effect (Host-Specific Natural Enemies)
Seedlings growing near parent plants suffer higher mortality due to host-specific pathogens or herbivores, reducing dominance.
Example: In tropical forests, tree species like baboonwood experience lower seedling survival near adult conspecifics, promoting spatial separation and species diversity.
Density-Dependent Disease or Herbivory
As a species becomes more abundant, it becomes more vulnerable to disease or herbivory, reducing its numbers and enabling rarer species to persist.
Example: Fungal pathogens targeting dominant grass species in tallgrass prairies can reduce their dominance and maintain plant diversity.
does species diversity influences community productivity.
plant communities often produce higher biomass due to niche complementarity and facilitation among species
Diverse systems are better at utilising available resources, reducing competition, and sustaining productivity over time.
However, the strength of this relationship can vary depending on environmental conditions, species identity, and the presence of dominant or particularly efficient species
Tri-trophic interactions
relationships involving three levels of a food chain—typically a plant, a herbivore, and a predator or parasitoid that affects the herbivore.
Corn plants release volatile compounds when eaten by caterpillars, attracting parasitic wasps that attack the caterpillars.
What are induced defences of plants to herbivory
chemical, structural, or physiological
Resource Partitioning
Species coexist by using different resources or using shared resources in different ways.
Example: In tropical rainforests, different bird species feed on insects in distinct parts of the canopy, reducing direct competition
Roles Played by Organisms (plants herbivores, decomposers and carnivores)
Plants (Producers): Take up inorganic nitrogen (e.g. nitrate, ammonium) from the soil and incorporate it into organic molecules like amino acids.
Herbivores (Primary Consumers): Eat plants and assimilate nitrogen into their own biomass.
Carnivores (Secondary/Tertiary Consumers): Consume herbivores and further move nitrogen through the food chain.Decomposers (e.g. fungi, bacteria): Break down dead organisms and waste products, releasing nitrogen back into the soil (ammonification).