HFE Exam 1
1/100
There's no tags or description
Looks like no tags are added yet.
Name | Mastery | Learn | Test | Matching | Spaced | Call with Kai |
|---|
No analytics yet
Send a link to your students to track their progress
101 Terms
What is Ergonomics?
An interdisciplinary science concerned with designing and arranging things people use so that the people and things interact most efficiently and safely.
Design for human use
Ergonomics = natural laws of work
Study of natural laws to identify optimum methods or solutions for carrying out a given task.
HUMAN FACTORS ≠ ERGONOMICS
What does the Human-Machine System consist of?
Cognitive Ergonomics: cognitive/behavioral perspective.
Physical Ergonomics: mechanical/physiological perspective.
Neuro-Ergonomics: unifying cognitive and motor perspectives.
What are Costs of Ignoring Ergonomics?
Less production output
Increased lost time
Higher medical cost
Increased absenteeism
Low-quality work
Injuries, strains
Increased probability of accidents and errors
Increased labor turnover
Less spare capacity to deal with emergencies
What is the Basic Ergonomic Model?
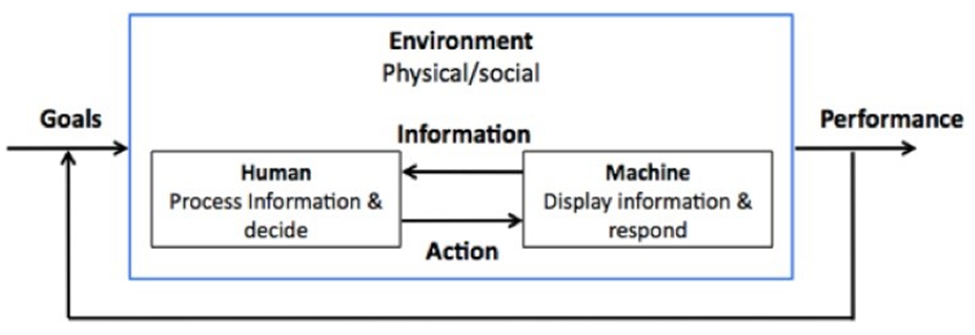
Also known as Human-in-the-Loop Model
Human: gathers and processes information and acts to maintain control of the system and achieve the desired system goals.
Focuses on information and action of the model.
All about the capability of the people.
Machine: objects human interact with to achieve a desired goal.
Physical environment factors: can interfere with gathering information, control actions and physical capabilities.
Psycho/social factors: affect processing information and decision making.
Human-computer interaction: includes interfaces between humans and computers.
Interactions/methods: gathering, processing of information and resulting actions can be characterized as serial and parallel tasks.
Human-machine system includes one or more persons and machines (tools) in a given environment performing one or more tasks to achieve one or more goals.
What are Goals and Standards of the Basic Ergonomic Model?
Goals describe:
The reason(s) that the system exist
Why the task is performed (not how)
The expected work/task performance
There may be multiple goals
They may be short-term and long-term goals
Workers, employers, and consumers all may have different goals
Goals may be implicitly stated or implied
Work Standards describe:
Quantity, quality, and time for achieving the goals
Standard is set by an employer, equipment manufacturer, and worker/user
Methods, equipment/tools, workspace, environment, materials
Worker/user qualifications, training, special needs
When do Gaps occur?
Gaps occur when job/task demands exceed worker/user capacity or adversely affect worker/user or worker performance over time.
Capability determines the capacity.
What are Compensatory Behavior/Actions?
An individual’s way of reducing the demands so that they can do the task.
Examples:
Additional subtasks
Slowing down
Altering posture to gain levarage or see
Using two hands instead of one
What are the Five Gap Categories?
Demands much less than capacities: low fatigue or injury risk; compensatory behavior should develop over time.
Demands less than capacities: moderate fatigue or injury risk; compensatory behavior should develop over short time.
Demands less than or equal to capacities: high fatigue or injury risk; compensatory behavior should be taken immediately.
Demands greater than capacities: compensatory action required to determine or execute necessary actions.
Demands much greater than capacities: worker unable to determine or execute all actions.
How to Identify Gaps?
Describe work objectives and performance standards.
Describe the characteristics of workers/users.
Describe the spatial and temporal relationship between the worker and the workstation/work/work environment.
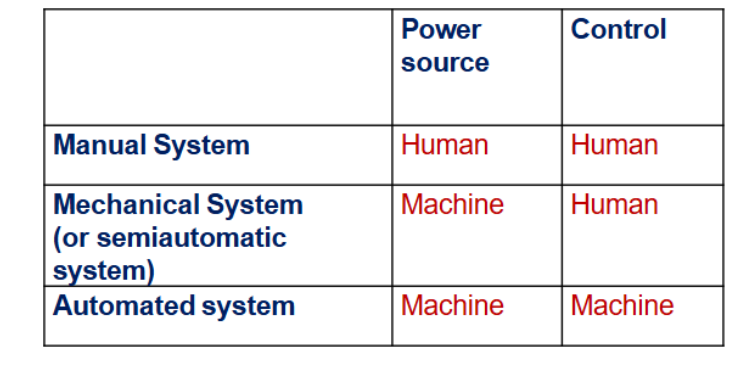
What are the Types of Human Machine Systems?
Examples:
Manual System: hammering
Mechanical System: Operating a drill gun
Automated System: CNC Machine
Includes Human Contribution:
Installation
Programming
Reprogramming
Maintenance
What are the Basic Functions of Systems?
Sensing (Information Receiving)
Information Storage
Informaton Processing and Decision
Action Functions (Physical Control or Communication)
What are Characteristics of Systems?
Systems are purposive
Every system must have a purpose
Goals or objectives
Systems can be hierarchical
Boundary (seperates whats inside and outside of the system)
Level of Resolution (degree of detail the system is analyzed)
Systems operate in an environment
Boundary Dependent
Components Serve Functions
Every component serve at least one function that is related to the fullfilment of one or more of the system’s goals
Components Interact
System’s, Subsystems, and Components have inputs and outputs
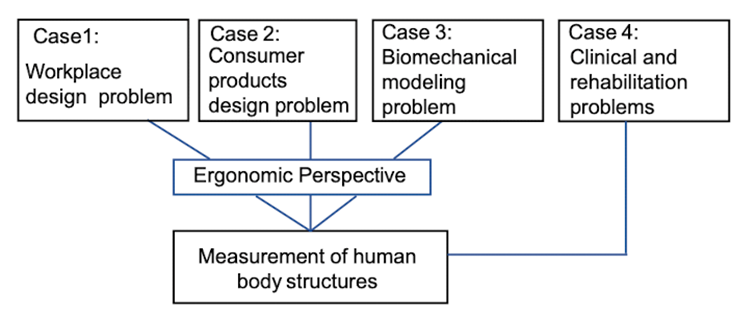
What is Anthropometry?
The study and measurement of human body structures.
Anthro (man) - pometry (measurements) = measurement of humans
What are Needs for Anthropometry?
Anthropology → Anthropometry → External and Internal Morphology
Study physical variations (size, shape, mass, etc.)
Examples of the Cases:
Height of Desk Chair
How far the pedals are from the car seat, Phone size
Tools of workers that might cause joint pain
Range of moton for patients after surgery with prosthetics
What are types of Anthropometry Data?
Structural anthropometric data: taken with the body in various standard and still positions.
Aka Static Anthropometry
Functional anthropometric data: obtained with the body in various work postures.
Aka Dynamic Anthropometry
Ex: measuring feet angles while reaching down to the gas pedal in a car.
Newtonian anthropometric data: used in biomechanical analysis of the loads of the human body.
Strength is one of the most-used measures.
What are Anthropometric Percentiles?
They correspond to the values of a variable below which a specific percentage of the group fall.
Use mean and standard deviation of normal distribution.
How to calculate Anthropometric Calculations?
Find mean (m) and standard deviation (SD)
If percentile is above the 50th percentile:
m + Z(SD)
If percentile is below the 50th percentile:
m - Z(SD)
Z (Z-score): for 95th/5th percentile it is 1.645
What are all of the Design Principles?
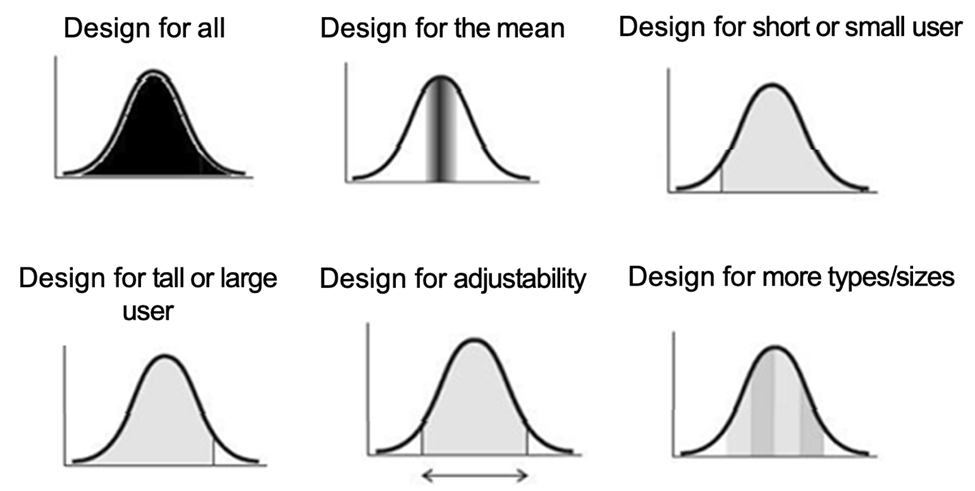
Examples:
Design for mean: stationary chair.
Design for short/tall users: everyone in the shaded region can use it BUT how far left/right do we need to bring the shaded area to account for that population.
Design for adjustability: chair that has adjustable height.
Provision for using mechanical solution to accomodate a range of users.
The range from 5th percentile female to the 95th percentile male.
Design for more types/sizes: designing T-shirts size small, medium, and large.
What is the Analysis General Approach?
Determine the User Population
Ex: children, women, U.S. civilians, age groups, world populations, and races
Determine Relevant Body Dimensions
Ex: the design of a chair seat must consider waist breadth
Select the Design Principles
Ex: Safety, comfort, and functionality
Locate the Anthropometric Tables of the Appropriate Population
Make Appropriate Allowances for Clothing(not essential)
Compute the Specific Dimension
What is Workstation Design and Reach?
Zone of Convenient Reach (ZCR): workers can reach work objects either from standing or sitting height without having to lean forward.
ZCR depends on:
Forward reach distance ( r )
Vertical distance (d) between shoulder and work object.
ZCR2 = r2 - d2
Maximum Horizontal Distance (HD) : HD2 = r2 - d2
What are the Body’s Planes?
Sagittal Plane: divides the body into left and right sides.
Known as the Longitudinal Plane.
Coronal Plane: divides the body into front and back portions.
Known as the Frontal Plane.
Transverse Plane: divides the body into upper and lower parts.
Known as the Axial plane or Cross-Section.
What are Directional Terms?
Superior: toward the head end of the body; upper.
Ex: the hand
Inferior: away from the head; lower.
Ex: the foot
Anterior: front.
Ex: kneecap is located on the anterior side of the leg
Posterior: back.
Ex: shoulder blades
Medial: toward the midline of the body.
Ex: the middle toe is located at the medial side of the foot
Lateral: away from the midline of the body.
Ex: the little toe is located at the lateral side of the foot
Proximal: toward or nearest the point of origin of a part.
Ex: The proximal end of the femur joins with the pelvic bone
Distal: away from or farthest from the point of origin of a part.
Ex: the hand is located at the distal end of the forearm.
What is a System?
A combination of different organs.
What are the Muscle Movements?
Abduction: away from the midline of the body.
Adduction: towards the midline of the body.
Circumduction: circle.
Extension: straightening of a joint.
Flexion: bending of a joint.
Rotation: movement around the axis of a bone or body part.
Why Measure Joint Range of Motion (ROM)?
Define norms for population in extreme postures (reach limits).
Define extent of physical impairment after injury or disease.
Workplace & Tool Design
Precent awkward (extreme) postures
What might limit ROM?
Injuries
Arthritis
Muscle imbalances
Joint conditions
Surgical complications
Age-related changes
Is there a difference between Active and Passive ROM?
Yes!
Normally Active ROM < Passive ROM
Why study Strength?
Weak workers are at an increased risk (3:1) when placed on high strength-demand jobs
Inter-individual strength variability
Strength not easily predicted
Low correlation with structural anthropometry
Strength requirements can be task-specific and complex
Strength often defines disability for a particular job
Improve productivity, comfort, and safety
What are Properties of Strength?
Force Limits
Moment Limits
Moment = force * angle
Maximum Voluntary Contraction (MVC): the greatest amount of force or moment a person can voluntarily generate under controlled conditions.
Max force or moment in perscribed conditions
Values can be 20-30% less than tissue limits
SAFETY FACTOR! Work should be below 30-50% MVC to prevent fatigue and injury.
Low back may not have a safety factor?
FJOB >= FMVC leads to increased risk of injury
What is the Strength Equation?
Muscle produces forces
Strength depends on both Maximum Muscle Tension (Fm) and muscle moment arms.
The MVC of agonist muscles need to be considered.
SE = FM x M (Moment Equation)
Strength Moment (Nm) = MVC force of agonistic muscle x Moment Arm (m) of agonist muscle
MVC Force and Moment Arm are at a joint angle of f(θ)
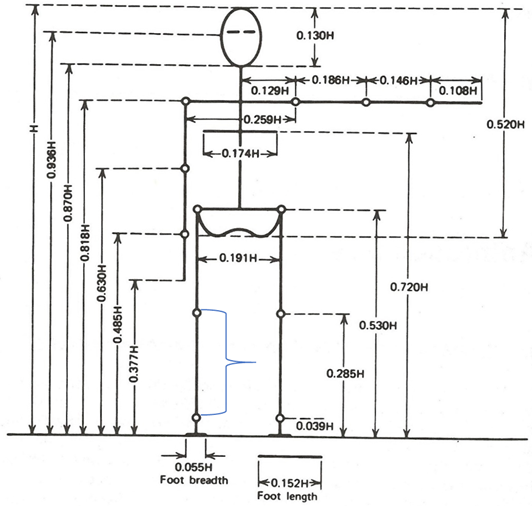
What is the Estimation for Segment Lengths?
Joint center of rotation and segment length in relation to anatomical landmarks.
Body segment lengths expressed as a fraction of body height (H).
Segment Mass = ms = PsmTotal
What is the difference between Mass and Inertia?
Mass is measure of an object’s resistance to changes in its motion.
Inertia refers to an object’s tendency to maintain its state of motion.
What is a Moment of Inertia (MOI)?
An object’s resistance to changes in its rotation.
What is the Radius of Gyration?
The measurement (radial distance) of the distribution of atoms in a molecular structure with respect to either its center of mass or a given axis of rotation.
Depends on size and shape, not mass.
What is a Force?
A force is a push or pull that can cause an object to accelerate or decelerate.
Newton’s Law of Equilibrium Formulas
Calculating Length of a Body Segment (from Segment Length Figure):
Length = Height x Segment Length Ratio
Calculating Weight of Body Segment (from Green Chart):
Weight = Psegmentation x Mass
Calculating Center of Mass (from Green Chart):
COM = (Rprox or Rdist) x Length
Moment of Interia
Alternative A:
I0 = mass x (Kcg x Length)2
Ip = I0 + mass x COM2
Alternative B:
Ip = mass x (Kprox x Length)2
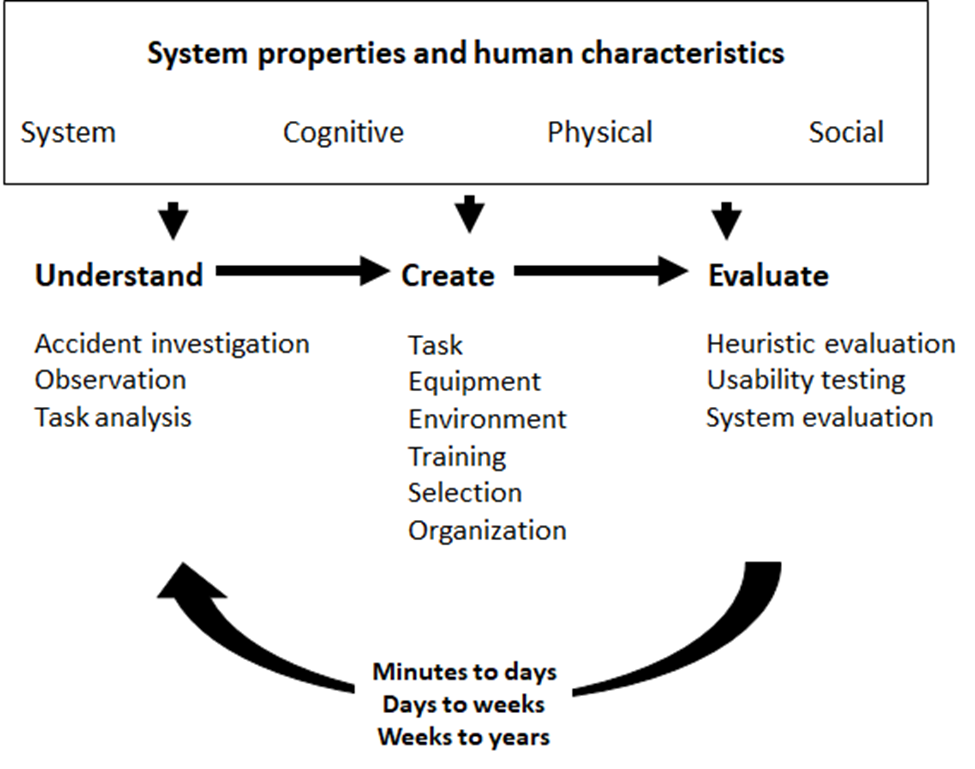
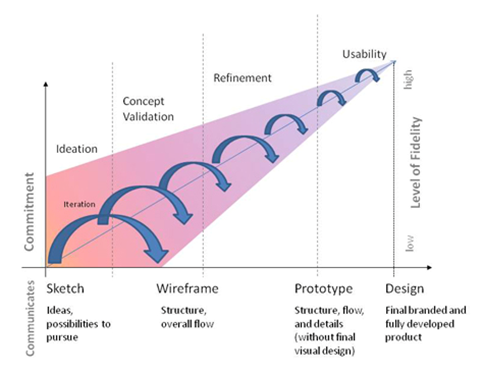
What do Design and Prototyping depend on?
Two Types of Understanding:
Understanding Tasks (front-end analysis/understand steps)
Knowledge of general human capabilities
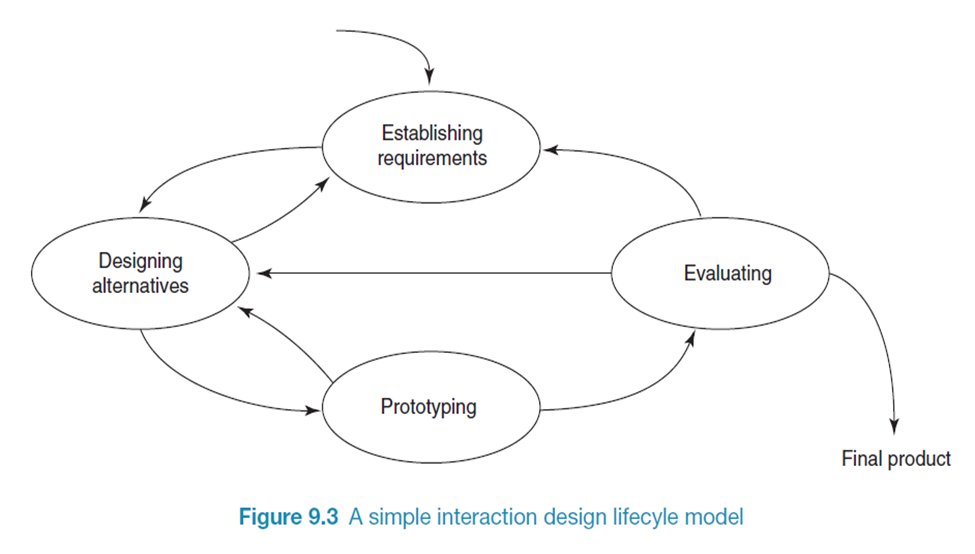
What is Design?
It is iterative.
Protype fidelity (low, medium, high)
High fidelity model is very comprehensive
Evaluation at each stage.
What is the Human Factors Design Cycle?
Main Goals:
Safety
Productivity/performance
Satisfaction/comfort
Depending on task, may have to focus more on one goal over another.
What are the Four Basic Activities in Interaction Design?
What is Task Analysis?
The systematic examination of certain processes to understand the sequence, actions, and decisions in detail.
What Data is included in a Task Analysis?
Description of manual activities
Description of mental activities
Task and element durations
Task frequency
Task allocation
Task complexity
Environmental conditions
Necessary clothing and equipment
What are Benefits of Task Analysis?
Facilitates Tool Design
Improved understanding
Improved personnel selection
Improved training and education
Procedure design
Improved safety
Reduced errors
Increased efficiency
Standardization and comparison
SOP’s: standard operating procedures
Comparison: benchmark processes between companies
What are Types of Task Analysis?
Hierarchical Task Analysis (HTA)
In chart, the more up → obtain the why
In chart, the more down → obtain the how
Cognitive Task Analysis (CTA)
GOMS Analysis (Goals, Operators, Methods, and Selection Rules)
What are Plans for a Hierarchical Task Analysis (HTA)?
Essential element of describing tasks using HTA
Describe conditions when subtasks are to be carried out to satisfy the task (or goals) being re-described
You can account for considerable complexity in task by combining different plans
Complex tasks can be better understood by representing them as a hierarchy of simpler plans
Can describe various forms of fixed procedures, decision-making, cycles of activity, etc.
What are Types of Plans for a Hierarchical Task Analysis (HTA)?
Fixed sequences
Choices
Optional completion
Cycles
Most plans in an HTA are composites
Use plans to represent the task. DO NOT feel compelled to fit them into any of these categories just to ensure that the plan provides a proper account of the task.
What are Limitations of a Hierarchical Task Analysis (HTA)?
HTA plans cannot capture task coordination effectively if they are for an acquired skill.
Ex: cognitive coordination
Difficult to specify tasks independent of current practice.
Devices
Users
Contexts
Limitations to capture emergent behavior and dynamic nature
In complex systems, the number of tasks becomes prohibitively large
What is Cognitive Task Analysis (CTA)?
Focuses on understanding mental processes involved in completing a task.
Specifically useful to understand how users think, make decisions, and solve problems during their interactions.
Applied for tasks that require a high-level of cognitive involvement from the user.
Ex: decision-making, problem solving, memory attention, and judgment.
Examples:
Doctors making a diagnosis
Pilots during takeoff
Tobias’ Research
What is Step 1 of a Task Analysis?
Define the purpose and identify the data required
Define the purpose
Think of the tasks and which information will need to be gathered
Hierarchical relationships
Sequence and timing
Location and environment
What is Step 2 of a Task Analysis?
Collect Task Data
Observations
Retrospective and prospective verbal protocol analysis
Unstructured and structured interviews, including focus groups
Surveys and questionnaries
Automatic data recording
Literature Review
What is Step 3 of a Task Analysis?
Interpret Task Data
Organize, summarize, and analyze collected information
Ex: flowchart
Task Hierarchy: goal, task, subtask decomposition (why vs how)
Task Flow: control, decisions regarding the flow from one task to another
Task Sequence: task duration and sequence, as well as communication between system components
What is Step 4 of a Task Analysis?
Innovate from Task Data
User identification and personas
Scenarios, user journeys, and user cases
Environment and context analysis
Workload analysis
Safety and hazard analysis
Function allocation analysis
What are Personas?
Capture a set of user characteristics (user profile)
Not real people, but synthesized from real users
Should not be idealized
Bring them to life with a name, characteristics, goals, personal background
What are the Types of Task Descriptions?
Scenarios, user cases, and user journeys.
What are Scenarios?
Concrete stories that concentrate on realistic and specific activities.
Includes daily use scenarios (common sets of task that occur daily) and necessary use scenarios (infrequent but critical sets of tasks).
What are User Cases?
User-centered description what goal is supposed to be accomplished.
Assume interaction with a system.
Assume detailed understanding (sequence of tasks) of the interaction.
What are User Journeys?
Some consider synonymously with scenarios.
Other say they focus on the persona/user and their emotional states and are a collection of scenarios or use cases that describe a users interactions through the lifetime of interactions with the system.
What are Evaluation Methods at Different Points in the Iterative Design Process?
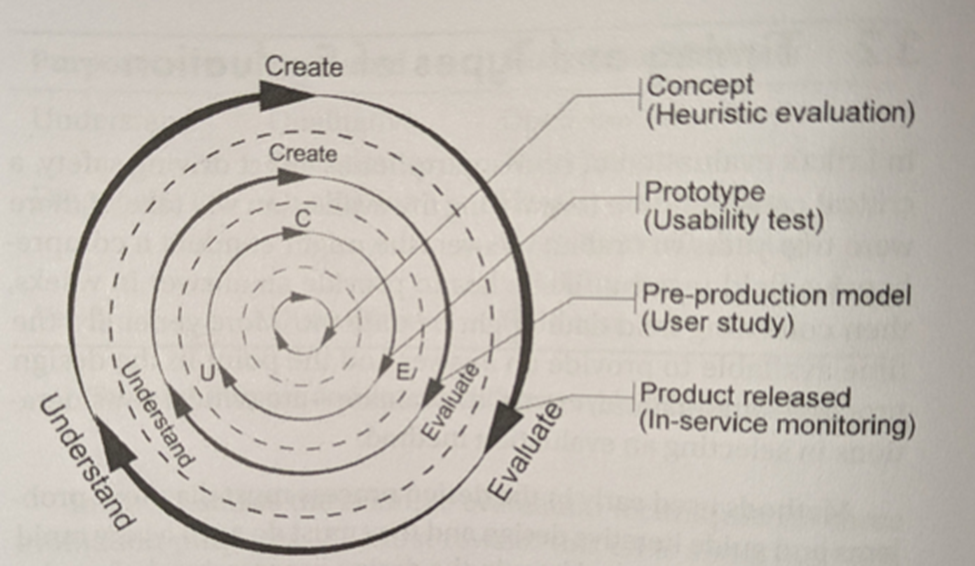
The further out you go from the center, the more expensive and time consuming.
Usability Study: focuses on evaluating how easily and effectively users can interact with a product, system, or interface.
User Study: broader research to understand user needs, behavior, and preferences.
May include usability testing as one method among others like interviews and surveys.
Evidence: Does Interacting with a Smartwatch Compromise Driver Safety?
Review crash statistics and police reports
Literature review of driving studies (on-road, simulator studies, models)
Use naturalistic driving datasets
Driving Simulator Study
Laboratory Study
More general, could be driving simulator or any controlled setting
What is Purpose?
Identifies opportunities to improve a design so that it serves the needs of people more effectively in terms of performance, safety, and satisfaction.
What are the Purposes of Evaluation?
Understanding how to improve
Using quantitative and qualitative methods to understand better people’s needs and characteristics relative to the design.
Does the existing product address the real needs of people? Is it used as expected?
Diagnosing Problems with Prototypes
How can it be improved? Why did it fail?
Diagnosing problems and identifying opportunities for improvement, using qualitative methods.
Ex: “What features on the device would you like to see?” or “What were the main problems in operating the device?”
Verifying
Does the expected performance meet design requirements? Which system is better?
Verifying performance of system with quantitative data.
Ex: Measuring response time, frequency of use.
What are the Types of Design Evaluation?
Design, Concept, Formative, and Summative Evaluation
What is Design Evaluation?
Testing specific prototypes, design solutions, or systems.
Verifying, diagnosing.
What is Concept Evaluation?
Basic science that supports the design principles and heuristics diagnosing.
Ex: visual distraction, cognitive distractions, manual distractions.
What is Formative Evaluation?
Understand how to improve a design and to diagnose problems with prototypes.
Conducted on designs in process
Qualitative measures
Less formal than summative evaluations
Cognitive walkthrough
Simulated-use testing
What is Summative Evaluation?
Assess whether a design meets benchmarks or design goals.
Typical question asked: Does the expected performance meet design requirements? Which system is better? How good is it?
Verify and validate
Quantitative measures (measure an underlying variable)
Summative Usability Testing
What is Timing and Types of Evaluation?
Design Concept
Literature review
Heuristic evaluation
Prototype
Cognitive walkthrough
Usability test
Pre-Production Model
User Study
Product Released
In-service monitoring
A-B Testing
What are some Evaluative Methods?
Literature Reviews
Heuristic Evaluations
Cognitive Walkthroughs
Usability Testing
In-service evaluation
A-B Testing
Controlled Experiments
What are Heuristic Evaluations?
Basic science and conceptual experiments have led to the development of design heuristics (guidelines, principles, rules of thumbs).
No additional data collection from users, instead reliance on previous research
HF/usability expert evaluates a design based on heuristics (guidelines, principles, rules of thumb)
Cost effective and fast process
Best suited for interface design
3-5 evaluators typically
Diminishing return of evaluators → having more evaluators does not have a benefit.
What is the Evaluation Process?
Identify and select human factors principles that are particularly applicable.
Carefully inspect the design and identify where it violates the design principles.
Aggregate findings for each evaluator and communicate to design team.
What are Nielsen User Interface Design Heuristics?
SPECIFIC TO INTERFACE DESIGN
Visibility of system status.
Match between system and the real world.
User control and freedom.
Consistency and standards.
Error prevention.
Recognition rather than recall.
Flexibility and efficiency of use.
Aesthetic and minimalist design.
Help users recognize, diagnose and recover from errors.
Help and documentation.
What is a Cognitive Walkthrough?
Similar to heuristic evaluation
Expert evaluation
Highlight potential problems with the design
Take on perspective of the user
Requires a specific set of tasks/use cases
Best suited for interaction design
Focus on learnability for new or infrequent users
Problem: Learned Intuition can undermine heuristic evaluations and cognitive walthroughs
What are Questions to Ask in a Cognitive Walkthrough?
Is it likely that the person will perform the right action?
Does the person understand what task needs to be performed?
Will the person notice that the next task can be performed?
Will the person understand how to perform the task?
Does the person get feedback after performing the task indicating successful completion?
What are Advantages of Expert Reviews?
It can provide some quick and relatively inexpensive feedback to designers.
You can obtain feedback early in the design process.
Assigning the correct heuristic can help suggest the best corrective measures to designers.
You can use it together with other usability testing methodologies.
You can conduct usability testing to further examine potential issues.
What are Disadvantages of Expert Reviews?
It requires knowledge and experience to apply the heuristics effectively.
Trained usability experts are sometimes hard to find and can be expensive.
You should use multiple experts and aggregate their results.
The evaluation may identify more minor issues and fewer major issues.
What is Usability Testing?
Testing a design with representative users.
Focuses on the usability (ease of use) of a design.
Learnability
Efficiency
Memorability
Errors
Satisfaction
Can differ in scope.
Small n (typical for (early) usability testing), descriptive statistics, qualitative analysis.
Large n (typical for user studies/experiments), inferential statistics, quantitative analysis.
What Measures might you study in a Usability Study?
Learnability: The system should be easy to learn so that the user can rapidly start getting some work done.
Efficiency: The system should be efficient to use so that once the user has learned the system, a high level of productivity is possible.
Memorability: the steps in system use should be easy to remember so that the casual user is able to return to the system after some period of not having used it, without having to learn everything all over again.
Errors: The system should have a low error rate so that users make few errors, and if they do make errors, they can easily recover from them. Further, catastrophic errors must not occur.
Satisfaction: The system should be pleasant to use so that users are subjectively satisfied when using it; they like it.
What are In-Service Evaluations?
Evaluations conducted after a design has been released.
Can be descriptive study, a usability evaluation, or a controlled experiment.
Problem: missing data, high variation, potentially many confounders.
A-B Testing is a type of in-service evaluation.
What is A/B Testing?
Type of In-Service Evaluation
Also known as Split Testing
Two systems (e.g., webpages) evaluated against each other
Small change (e.g., the headline) and test conversion rate (people who sign up or click through).
Very large number of participants typically
Ex: Facebook / Google
Can be used to test very small differences (slightly different shades of blue).
Ex: Google colors selection
What are ways to describe Research Methods?
Basic vs. Applied
Basic: understanding human behavior in general.
Applied: understanding specific situations demands on humans and outcomes.
Quantitative vs. Qualitative
Descriptive vs. Explanatory
Descriptive: focused on describing and summarizing human behavior, system performance, or specific phenomena in natural settings without manipulating any variables.
Explanatory: designed to understand the underlying causes and relationships between variables within human factors, often involves experimental designs where researchers manipulate one or more variables.
Field vs. Laboratory
Field: conducted in a natural setting where the behavior or phenomena of interest occurs.
What are the Stages of Research?
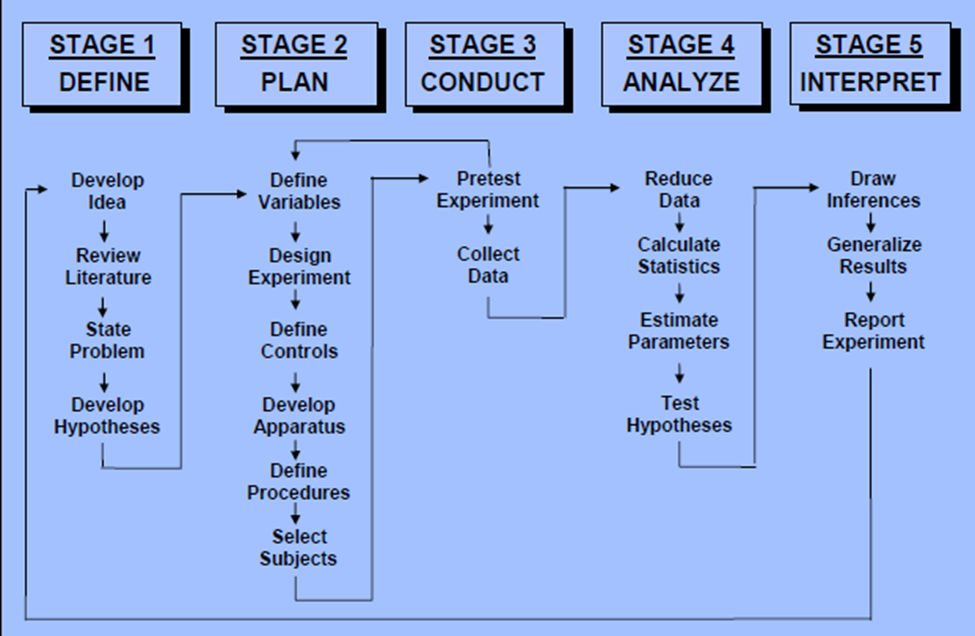
What is Step 1 of the Stages of Research?
Define Problems and Hypotheses
What is your research question?
What cause/effect relationships you expect to observe?
Research hypothesis
What are potential variables in the study?
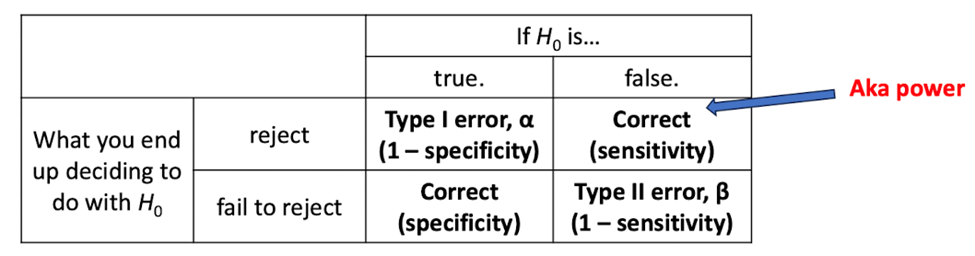
What is Statistical Hypothesis Testing?
Null Hypothesis (H0): there is no effect of button size on touch screen user accuracy.
Alternative Hypothesis (HA): button size affects accuracy
What is Step 2 of the Stages of Research?
Experiment Plan
What are variables you want to manipulate?
What are observations you want to make?
How do we “operationalize” or find a way to measure the thing we are interested in?
How many participants do you need?
How will data be collected?
Ex: Do you want to take multiple measures on single subject at different points in time?
Independent Variables: controlled manipulations of task, system or environment.
Also called “Condition,” “Factor,” “predictor,” “Indicator,” or “Treatment”.
Levels - Different settings of manipulation or condition.
Dependent Variables: response measures you intend to observe for affects of condition.
Also called “Construct” or “Outcome measure”.
Response to treatment.
How many people (sample size) do you want to recruit for the study?
Depends on: desired effect size, significance criterion setting (tolerable ⍺); and statistical power (desired beta).
What are the Levels of Measurement?
Nominal: responses are qualitative classifications of outcomes.
Identify and classify.
Examples:
Product model numbers.
Numbering of football players to indicate position on field.
Substitution of any number for any other number.
Ordinal: measures are ranking.
Rank order.
Examples:
User order of preference of set of products.
User ranking of various touch screen display designs.
Any change that preserves an order.
Interval: data are relative quantitative measures.
Find distances or differences.
Example:
Temperature data from one day to the next.
Multiplication of a constant or addition of a constant.
Ratio: data are quantitative and scales include absolute zero value.
Find ratios, fractions, or multiples
Examples:
Length and weight
Multiplication by a constant only
What are Study Designs?
Experimental design identifies the independent variables that will be controlled in the study.
Watch out for Confounding Variables
Ex. Wide ranges of differences among people.
Experimental conditions should only differ with respect to treatment condition and not on any other (extraneous) variable.
Repeated measures (aka within subjects) design can help avoid confounding effect of differences between different groups.
Ex. Same person drives with and without smartphone.
Make sure to avoid order effects.
Fatigue and learning effects are confounding variables for repeated measures designs.
What are One-Factor Designs?
One independent varaible with two (or more) levels to be compared.
Ex: driving with and without smartphone.
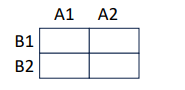
What are Two-Factor Designs?
Two independent variables with two levels each.
Ex: driving with and without a smartphone and highway vs city driving.
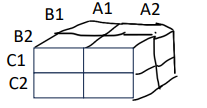
What are Three-Factor/3-Way Designs?
Three independent variables with two levels each.
Ex: driving with and without smartphone, highway vs city driving, and younger vs older drivers.
What is Between Subject Designs?
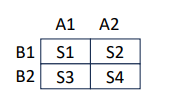
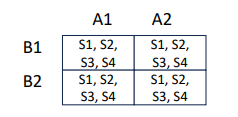
What is Within Subject Designs?
Often becomes too expensive.
What is Mixed Designs?
Ex: one group drives in heavy traffic with and without smartphone; second group did so in light traffic.
What is Representative Sampling?
Participants should represent the population or group of interest.
Tasks and situations should also be representative.
What are the Sampling Types?
Probability sampling
Random selection
Allows you to make strong statistical inferences about the whole group
Non-probability sampling
Non-random selection based on convenience or other criteria
Allows you to easily collect data
What are Probability Sampling Methods?
Simple Random Sampling: every member of the population has an equal chance of being selected.
Stratified Random Sampling: dividing the population into subgroups and randomly sampling from each where the proportion for each subgroup sample is equivalent to target population proportions.
Cluster Sampling: dividing the population into clusters and randomly selecting (whole) clusters.
Multi-Stage Sampling: combining multiple sampling methods to select participants.
What are Non-Probability Sampling Methods?
Convenience Sampling: selecting participants who are easiest to access.
Purposive or Judgmental Sampling: selecting participants based on the researcher's judgment.
Snowball Sampling: recruiting participants through existing study subjects.
Quota Sampling: setting quotas based on predefined traits to ensure the sample reflects certain characteristics.
What is Step 3 of the Stages of Research?
Conduct a Study
Conduct pilot study to verify procedures and sample size.
Follow experiment plan (design of experiment) for 2-3 subjects.
Modify procedures to prevent errors and systematic variance (uncontrolled factor exposure).
Use pilot data (condition means and variances) to calculate sample size, given significance criterion and desired statistical power.
Conduct full experiment using refined procedure and verified sample size.
What is Step 4 of the Stages of Research?
Analyze the Data
Before doing any analyses, look at descriptive statistics.
Apply appropriate inferential statistics.
What is Step 5 of the Stages of Research?
Interpret and Draw Conclusions
Are your results generalizable?
Always keep in mind statistical significance criterion (p<0.05)
What are Limitations in Research?
Want “true” behavior of subjects we study:
Observation necessarily leads to changes in behavior.
Persons under time study perform manual work ~12% faster (Frievalds, 2013).
Access to subjects may be limited in field research due to normal production operations.
Use of sample population:
Want to make inferences on population behavior but don’t have resources to collect data on every person.
Select individuals at random from population → sampling.
Each sample yields different group of individuals and variance in observed mean response.
Referred to as sampling error.
Smaller sample size – greater sampling error.
May need to conduct multiple experiments to estimate confidence interval on “true” mean.
Use of subjective response measures (e.g., surveys, ratings, interviews):
Influenced by recall bias of events (participants don’t accurately remember a past event.
Influenced by performance bias (one group of subjects in experiment gets more attention from investigators and due to that performs better) – what’s the extraneous variable introduced here?
Can have limited face validity due to contamination – subjects may consider task demands other than those of interest to analyze or fall for a social desirability bias.