Pharmacokinetics Exam 3
1/28
There's no tags or description
Looks like no tags are added yet.
Name | Mastery | Learn | Test | Matching | Spaced |
|---|
No study sessions yet.
29 Terms
Cartesian Plot of Linear Superimposed Data for a constant multiple IV bolus dose regimen
At each dose there is some drug left from the previous doses and the drug concentration rises until a Css is reached
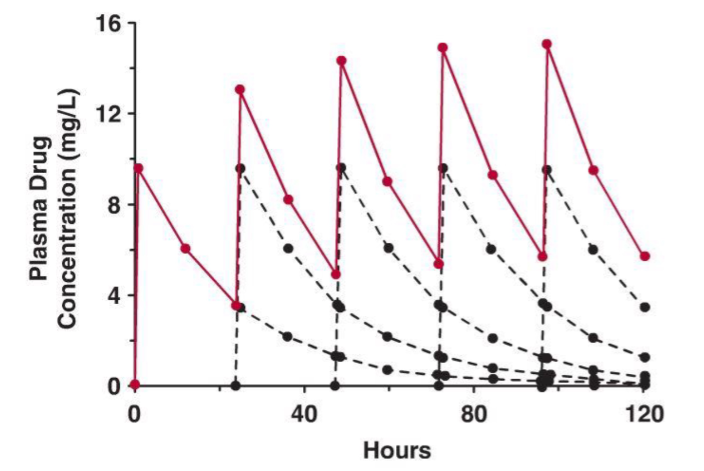
Equal dose and equal dosing interval Maxima and Minima on accumulation to the Plateau
Once the dose max has been reached, the drug amount will decrease based on an exponential decline, as we have seen for an IV bolus dose or for a post-infusion phase

Accumulation index Rac
Tells you how much drug accumulates relative to the first dose
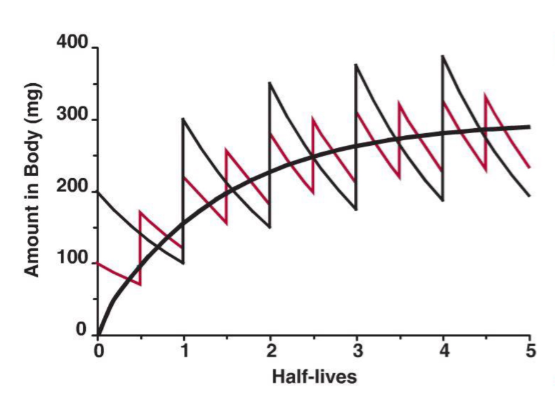
Multiple dose - change the dose
Rate of administration is constant
The black dose is 2 x the red dose
But the black dose is given in a double interval of time relative to the red doses
By giving a smaller dose more frequently there is a smaller fluctuation in the drug concentration
But the downside is patient adherence issues
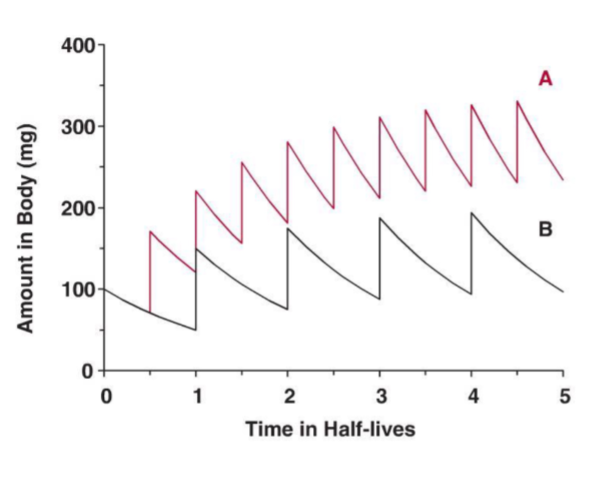
Multiple Dose: Change the dosing interval
The dose is exactly the same for both cases, but in A the dose has been given twice more often than in B
If the dose interval is decreased, there will be more drug accumulation and the Css will be larger
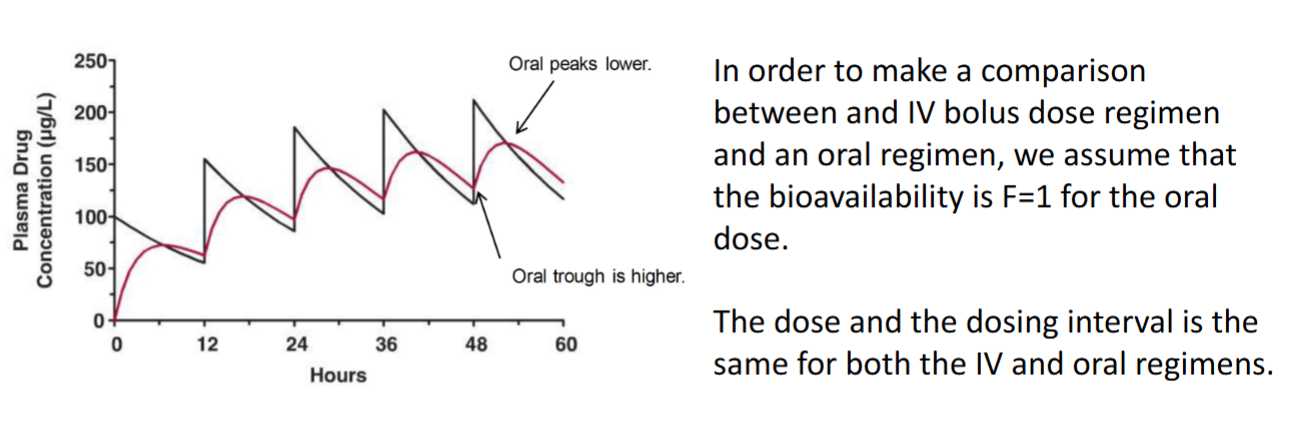
Comparison between a constant multiple IV bolus dose and a constant multiple Oral regimen
We assume that F = 1 for the oral dose
The dose and the dosing interval is the same for both IV and Oral regimens
The average values at steady state are exactly the same for the IV and Oral regimens
However the IV dosing has a much bigger fluctuation than the oral regimen
Turnover rate
If a drug has a slow turnover rate then steady state is not reached until much later.
EX: Cholesterol
The endogenous pool needs to be reduced which is why it takes so long to get to steady state
Sawchuk-Zaske Method
Cmax = Cprev + Cnew
Aminoglycosides use
• Bactericidal antibiotics, treat serious gram-negative infections
• Agents: gentamicin, tobramycin, amikacin
• TDM: narrow therapeutic window
• PK characteristics
• Similar kel, CL, and Vd across all agents (gentamicin, tobramycin, amikacin)
• Half-life 2-3 hours
• Vd ~0.25 L/kg • Elimination: 94-98% through renal excretion
Why are aminoglycosides suitable for TDM?
Efficacy: concentration-dependent killing
• Concentration > minimum inhibitory concentration (MIC) needed to kill the bacteria
• Higher concentrations (>>MIC) result in better efficacy
Toxicity: nephrotoxicity, ototoxicity
• Trough >2 mg/L associated with nephrotoxicity
• Trough >4 mg/L for long term (~10 days) associated with ototoxicity
Conventional dosing of aminoglycosides
Usual dose:
• Gentamicin and tobramycin: 1-1.7 mg/kg Q8H infused over 0.5-1 hr
• Amikacin: 5 mg/kg Q8H infused over 0.5-1 hr
• If renal function is reduced, dosing interval Q12 (CrCL 46-60 mL/min) or Q24 (CrCL 20-40 mL/min)
Target concentration:
• Peak: urinary tract infection (4–5 mg/L); sepsis (6–10 mg/L); pneumonia (7–10 mg/L); meningitis (8–10 mg/L)
• Trough: <1 mg/L
When to collect blood sample:
• Steady state peak (0.5 hr after the end of infusion)
• Steady state trough (prior to the next dose, ~0.5 hr)
The Liver
Largest organ in the body
Main function: metabolize, detoxify and inactivate both endogenous substances (e.g. steroids and other hormones) and exogenous substances (e.g. drugs and toxins)
the liver also converts inactive substances to active substances (e.g. inactive prodrug → pharmacologically active species)
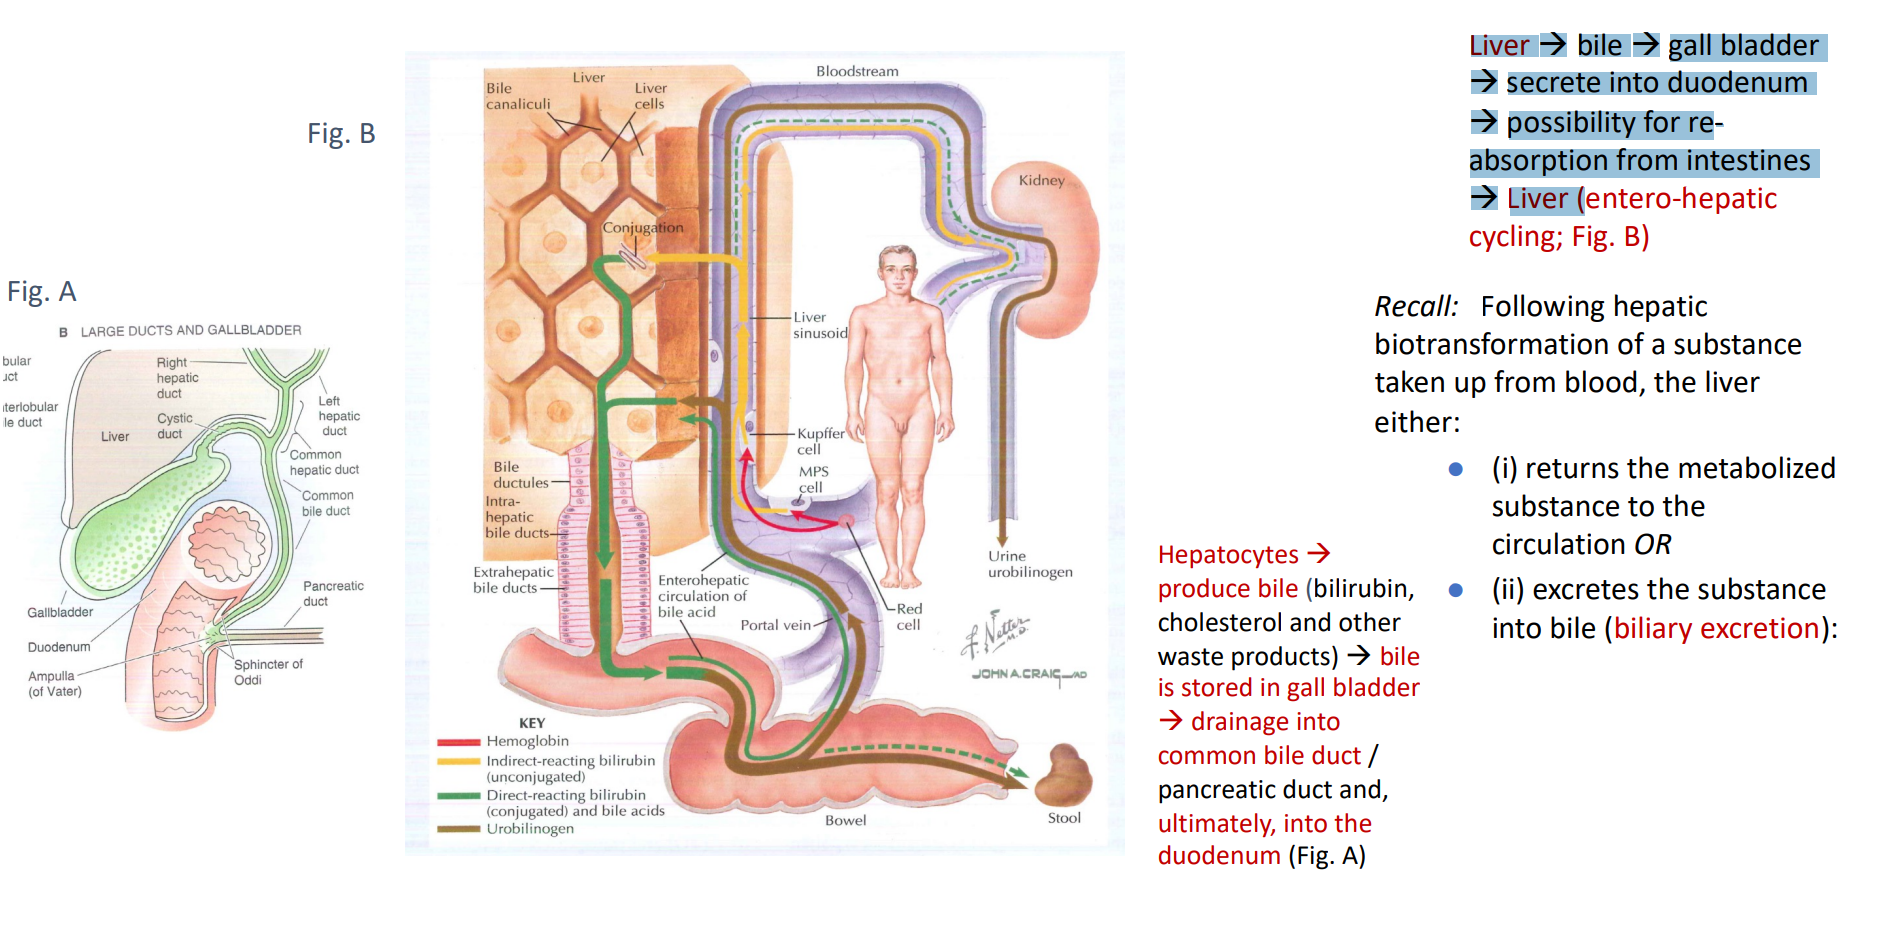
Following hepatic biotransformation The Liver:
(i) returns the metabolized substance to the circulation
(ii) excretes the substance into bile
What is the functional unit of the Liver?
Acinus
Contains Hepatocytes
Contains Kupffer cells (separated from the blood by highly fenestrated capillaries)
Kupffer Cells
Macrophages → phagocytose old RBCs
Some large protein removal
Sinusoidal Capillaries
Very leaky, high permeability vessels with large 100 – 150 nm fenestrations
Hepatocytes
Metabolize hormones, drugs and other chemicals
Produce and secrete major plasma proteins
Hepatocytes produce and secrete bile
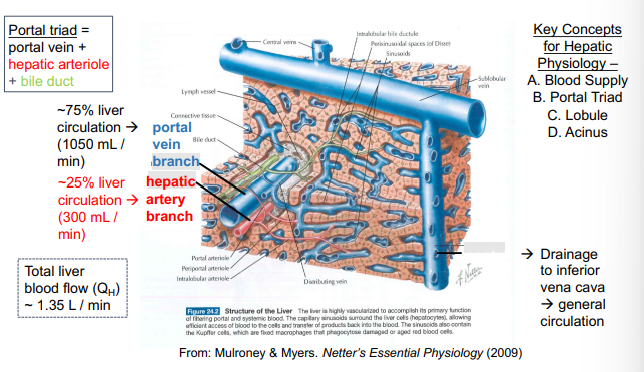
Blood supply to the liver
dual blood supply to the liver is via the portal vein and the hepatic artery
blood components are ‘processed’ by hepatocytes and then returned to a single venous drainage system
Acinus
Functional Unit of the liver
Zone 1:
• closest to portal triad
• first to receive drugs / nutrients
Zone 3:
• farthest from portal triad, closest to draining central vein
• highest CYP450 / hydrolytic enzyme content
Drug metabolism and excretion
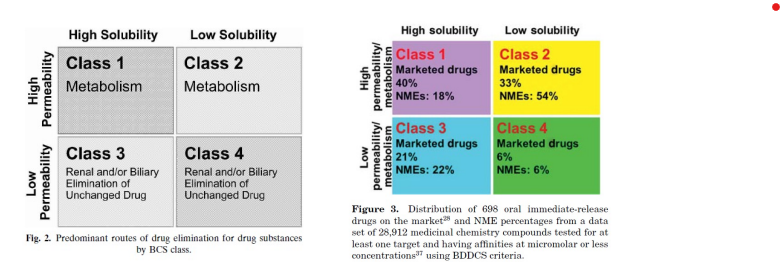
Class 1 & 2 – mostly metabolized
Class 3 & 4 – mostly excreted
Most marketed drugs are eliminated primarily by metabolism
Class 1 & 2 – high permeability (typically relatively lipophilic) drugs predominantly metabolized
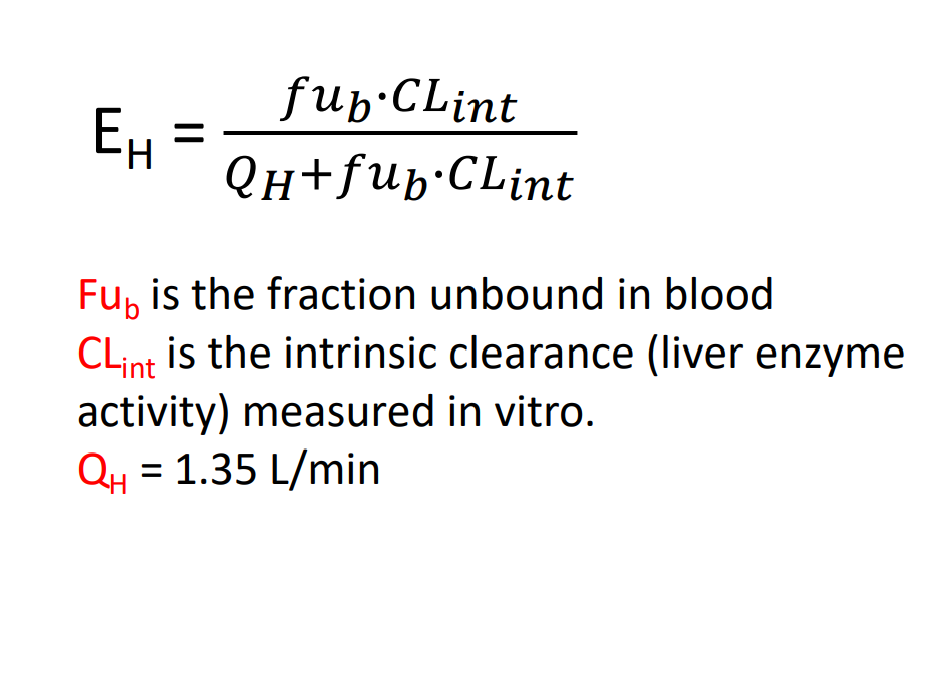
Hepatic Clearance is dependent on
1) Hepatocyte activity (intrinsic clearance)
(2) Perfusion
(3) Protein binding (fraction unbound, fu)
*can be better understood by dividing agents into high and low extraction drugs using the concepts of Extraction Ratio (E) and the use of a predictive model
Extraction in the liver
Unlike renal extraction there are many drugs that are highly extracted in the liver
Hepatocyte eliminating activity
Hepatic elimination only occurs because a drug is a substrate for an elimination process within the hepatocyte
• Elimination is therefore dependent on unbound concentration (CuH) within the hepatocyte.
• Rate of Elimination = CL C = CLint * CuH
Intrinsic Clearance
measure of the intrinsic hepatocellular eliminating activity
Most important for Hepatocyte:
1. Induction of a drug metabolizing enzyme (increased expression caused by an inducing substance; typically, takes hours to days) will increase Clint
2. Inhibition of a drug metabolizing enzyme (typically faster than induction, min to hrs) will decrease CLint
Hepatic Extraction Ratio
1. EH is an indicator of CLb,h
2. If EH=1, all drug is removed during a single pass through the liver
3. FH is the fraction escaping metabolism 4. EH = 1 – FH = fraction not escaping hepatic metabolism
Example: a drug with a large first pass effect may have FH = 0.3 and EH = 0.7
Extraction ratios for representative drugs
Notice that the rate of of drug elimination in the liver is directly related to the concentration of drug unbound in the incoming delivered plasma
Thus, Cu can be replaced for CuH and one has: Rate of elimination = CLint Cu (unbound concentration) and
Hepatic clearance = CLint * fu (fraction in plasma unbound)
Well Stirred Model of Hepatic Elimination
Key Points:
Model assumes instantaneous and complete mixing occurs within liver
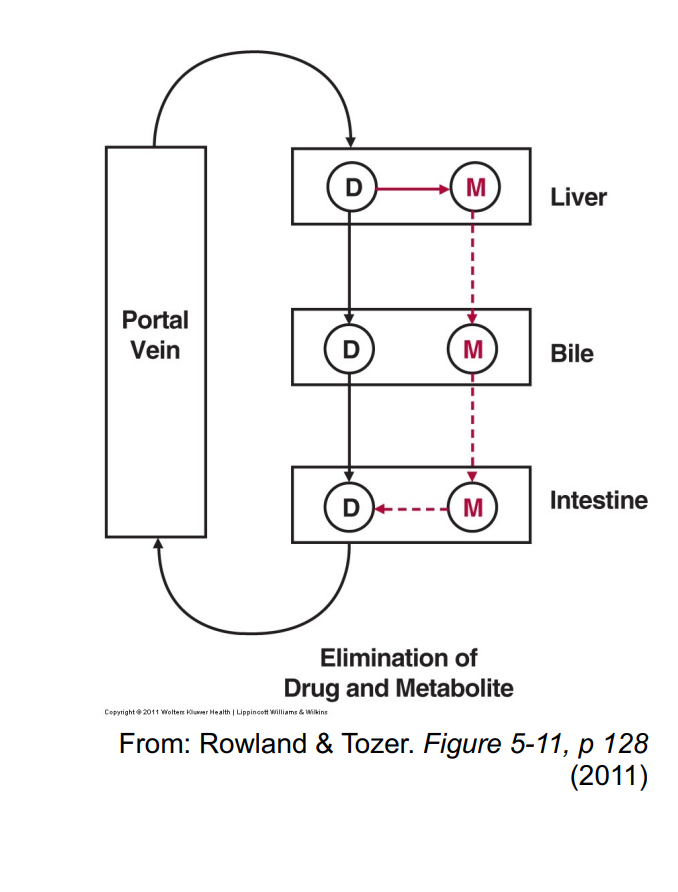
Biliary excretion and enterohepatic cycling
Excretion of substances into the bile allows for the possibility of enterohepatic cycling
• Certain drugs administered
• Generally clearance by biliary excretion is low
When is High Biliary Excretion Possible
High biliary CL – Only really possible for:
• (i) Drugs undergoing significant concentration in bile (achieving very high bile-to-plasma concentration ratios, e.g. 1000:1), requiring active secretion (energy)
AND
• (ii) Drugs that are polar and > 350 Da in size (i.e. not reabsorbed well in GI tract)
