Lab 4 - Interpreting Anthropometric and Dietary Data + BTB
1/34
There's no tags or description
Looks like no tags are added yet.
Name | Mastery | Learn | Test | Matching | Spaced | Call with Kai |
|---|
No analytics yet
Send a link to your students to track their progress
35 Terms
How is anthropometric data interpreted?
Either by comparing with the population (ie. Canadian data or WHO), or compare with a reference standard associated with good health.
How is weight and height assessed in pts?
Assessed by comparing with population data.
How is knee height interpreted?
Used to estimate height for people who cannot stand.
Compared with population using a standard formula.
How is BMI interpreted?
Compared with the population and compared with a reference standard associated with good health.
What diseases are associated with different BMI classificiations?
Overweight/obesity
T2D.
Dyslipidemia.
Hypertension.
Coronary heart disease.
Gallbladder disease.
Obstructive sleep apnea.
Certain cancers.
Underweight (could indicate ED or other underlying illnesses).
Undernutrition.
Osteoporosis.
Infertility.
Impaired immunocompetence.
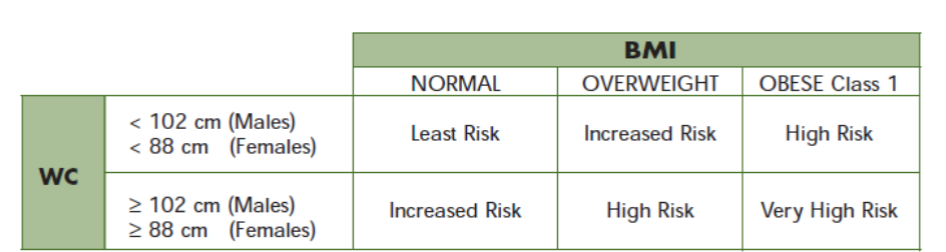
How is waist circumference interpreted?
Compared to the standards of either WHO or NIH.
Associations between WC and disease remain consistent with both methods, some found a difference though?
In Canada, NIH is standard protocol.
Some ethnicities have different waist cutoff values (ie. asian people are different).
How can BMI and WC be interpreted together?
*People with BMI over 35, WC does not provide any additional info.
How is Hip Circumference Interpreted?
Can be used to calculate waist to hip ratio. Way to distinguish between fat in the lower and upper body.
W to H cutoffs for increased risk CVD:
above 1 for men.
above 0.85 for women.
Not considered to be as useful as WC.
How is skinfold measurement interpreted?
Can be used to monitor body fat changes in one patient.
Can also be compared to reference standards, or used to calculate percent body fat.
How are skinfolds calculated?
A single sit cannot be used to estimate body fat percent.
Calculate body density based on gender and number of skinfold sites assessed.
Calculate body fat % using population specific parameters.
Calculate total body fat and/or fat free mass.
Total body fat (kg) = (weight (kg) x % BF) / 100
Fat free mass (kg) = weight (kg) - BF (kg)
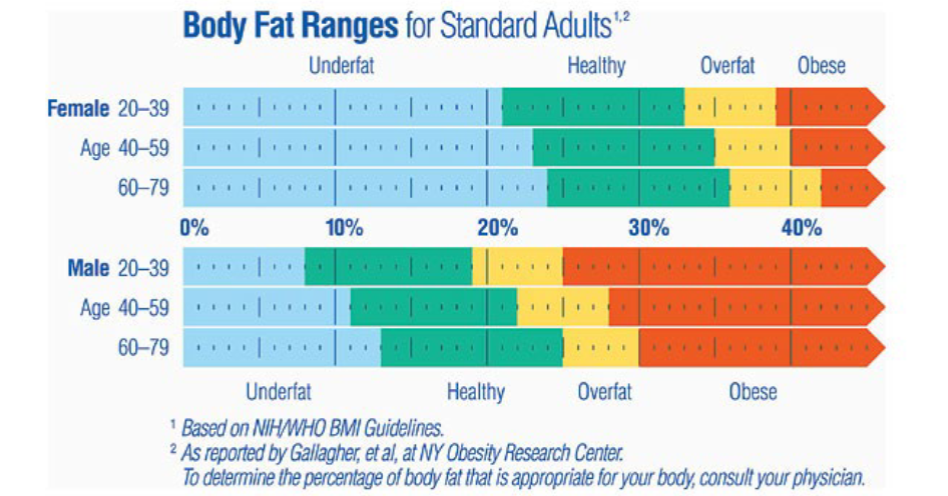
How is body fat interpreted?
No universally accepted standard method.
How is arm fat and muscle areas interpreted?
Go to mid-upper arm fat area:
Measure skin fold.
Measure arm circumference.
Calculate:
Total arm area.
Arm fat area.
Arm muscle area.
Total arm area calculation
TAA = Arm Circumference (cm)² / 4π
Arm fat area calculation
arm fat area = total arm area - arm muscle area (uncorrected)
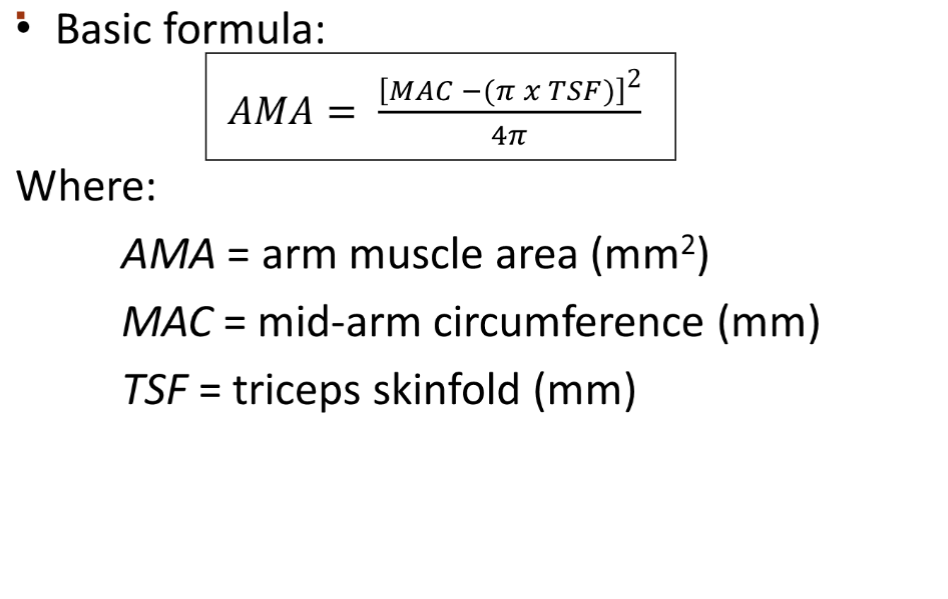
arm muscle area calculation
**Correct
Overestimates arm muscle area because it includes the cross sectional area of bone, nervous, and vascular area.
Males: subtract 10cm²
Females: subtract 6.5cm²
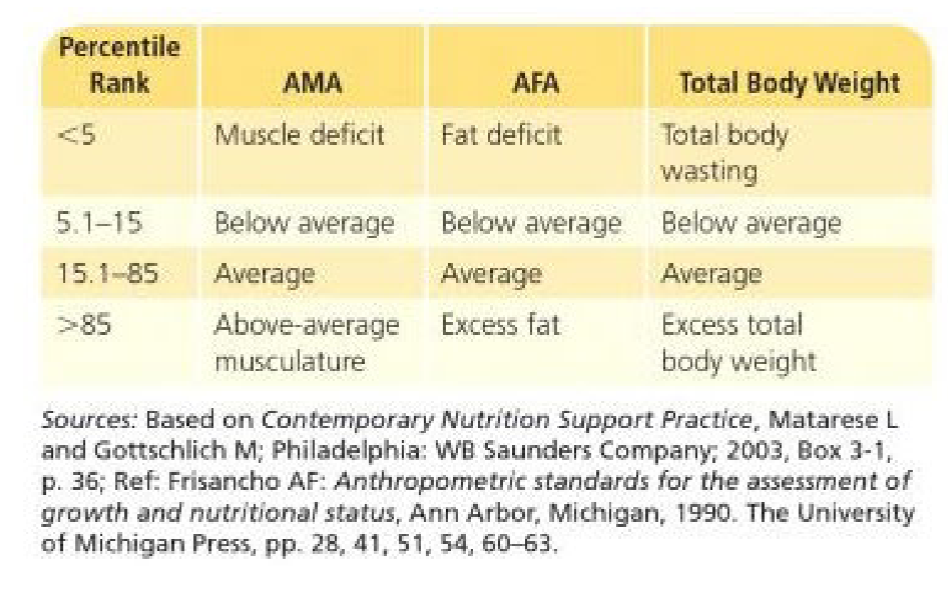
Arm muscle area interpretation
How are HR and blood pressure interpreted?
Compared to average values.
What do diastolic and systolic BP tell us? Which is more important?
Diastolic - at rest.
Systolic - at contraction.
systolic is more important.
Requirement vs Intake distributions.
Requirement: Distribution of how much of a specific nutrient is needed. Used to make DRIs.
Intake: Distribution of observed or reported intakes of a specific nutrient.
May or may not overlap.
Both are adapted for nutrient assessment.
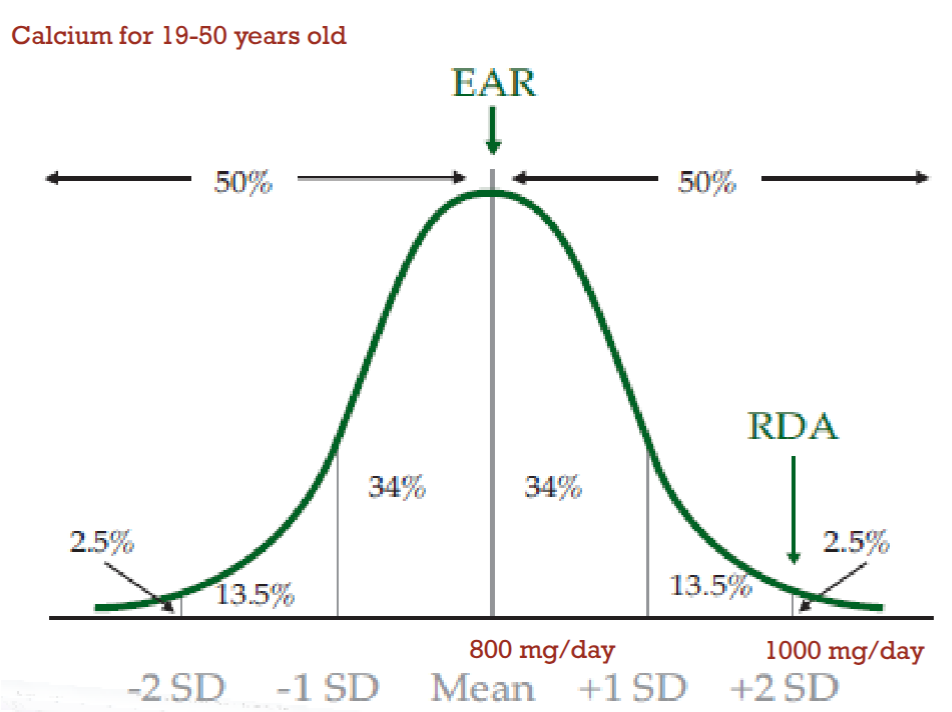
Estimated average requirement (EAR).
Intake meets the estimated nutrient needs of 50% of individuals in a gender and life stage group. The median in the requirement distribution.
Recommended Dietary Allowance
Intakes that meet the nutrient requirements of ~98% of individuals in a population.
Should be considered goal intake for an individual.
Adequate Intake
Used when there is insufficient data to set an ear.
Based on observed or experimentally determined approximations or estimates of nutrient intake by a group of healthy individuals.
Tolerable upper intake level
Represents the highest amount of a nutrient that will not cause toxicity symptoms in the majority of the population. Applies to chronic consumption (not just one day).
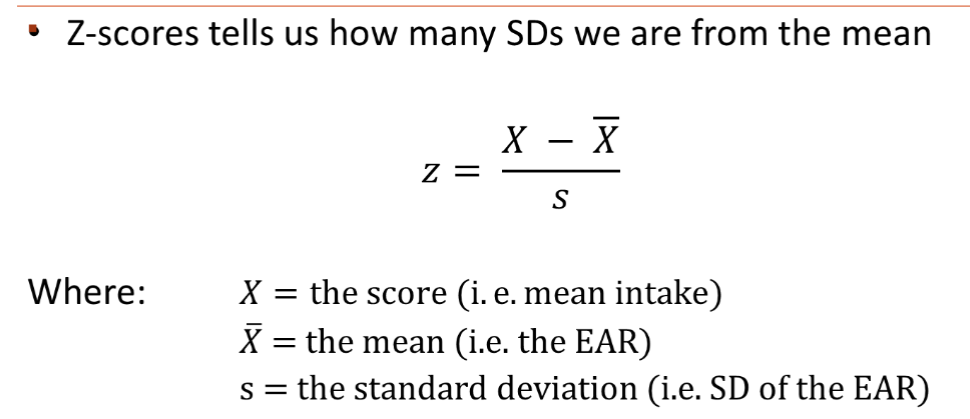
How can we determine the probability of adequacy?
Use Z score to determine probability.
After, look up the probability of adequacy associated with the z-score.
How is Beyond the Basics (BTB) used to plan diets?
Provides a meal pattern to start people off with.
Looks at current pattern, designs a pattern to spread CHO throughout the day, and keeps close to the preferences of the client.
Uses an excel spreadsheet.
Foods of similar content can be exchanged with each other.
How are CHO categorized in BTB?
Grains and starches.
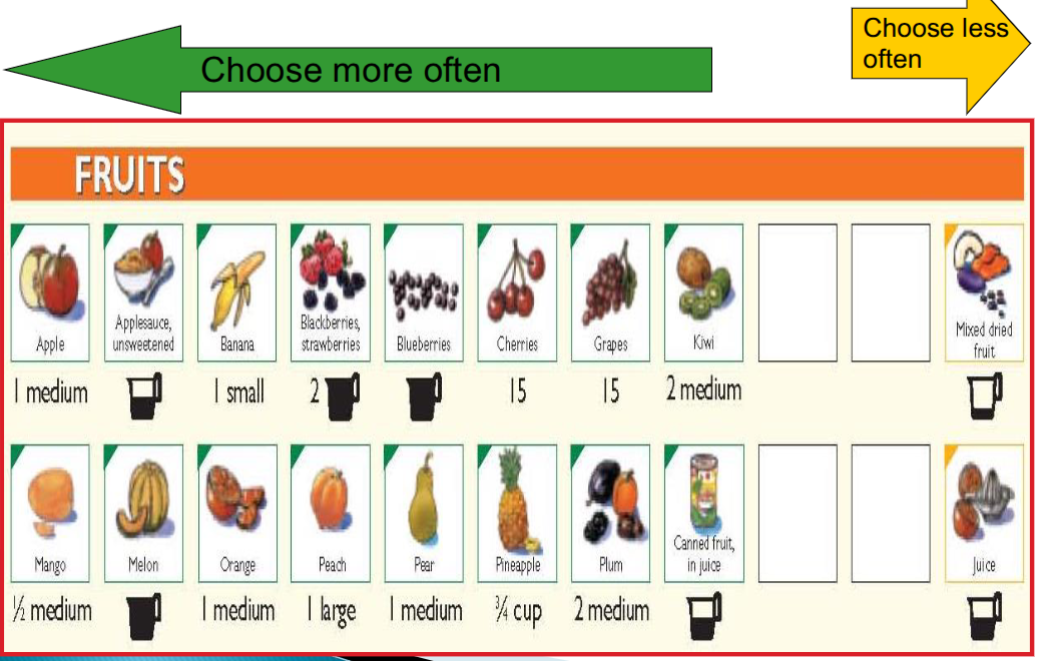
Fruits.
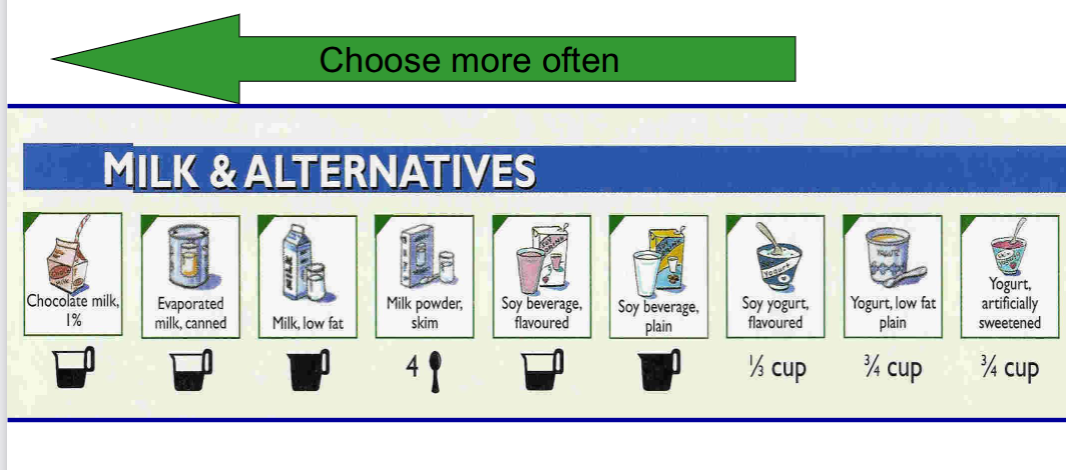
Milk and alternatives.
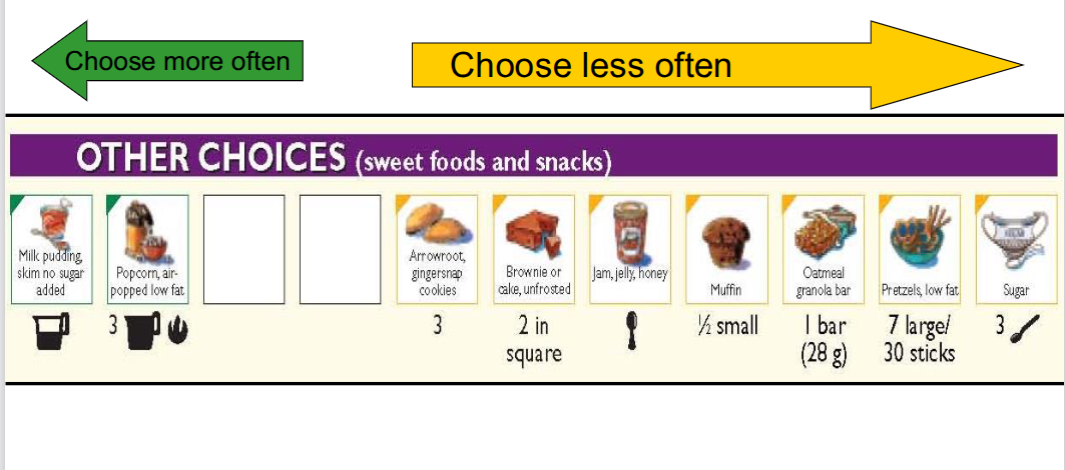
Other choices
^ all 15g CHO per serving.
Vegetables
^ 5g per serving.
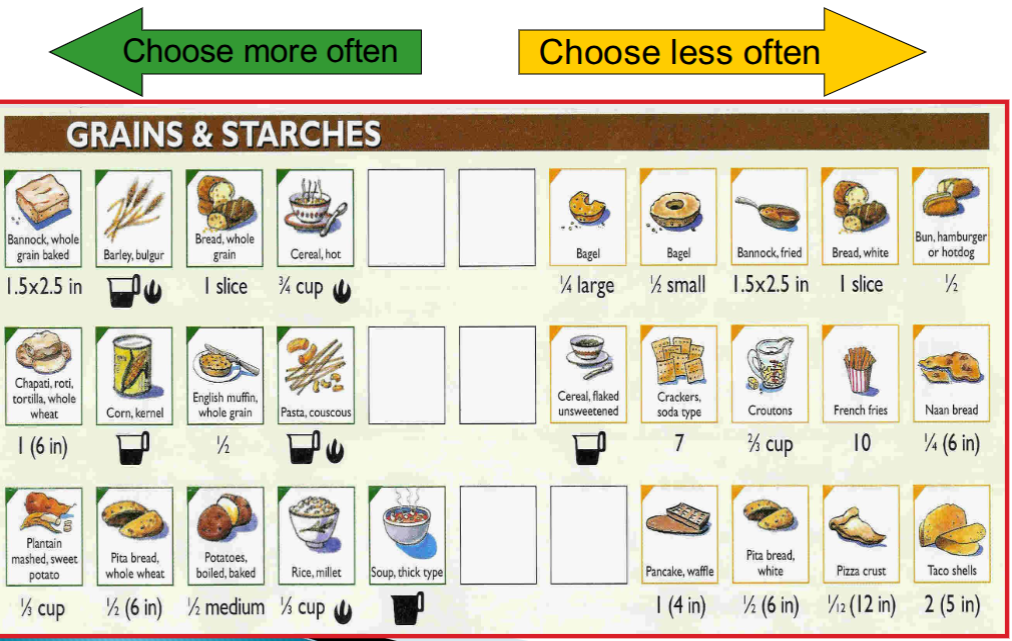
BTB grains and starches category.
Approx 15g CHO per serving. Emphasises whole grains.
Serving is based on available CHO and GI.
Subtract fibre and ½ sugar alcohols.
How many carbohydrate choices would be in a food item with 12g of total carbohydrates?
apx 1 CHO choice.
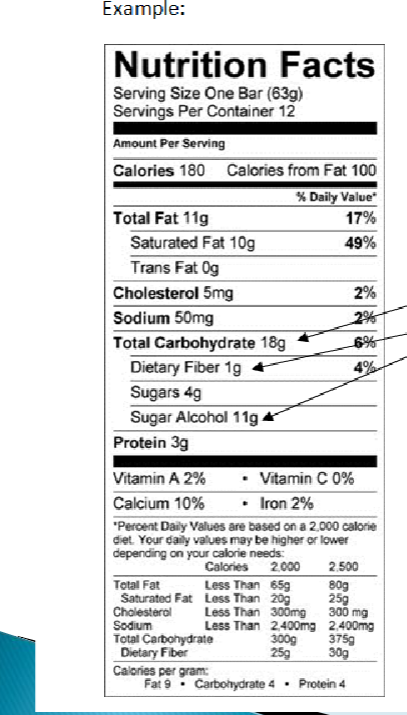
How many carbohydrate choices would be in this food?
18g total CHO - 1g fibre - 5.5g sugar alcohols = 11.5g available carbs.
Slightly less than one carb serving.
BTB vegetables and fruit category.
Fruit is apx 15g CHO per serving. Vegetables apx 5g CHO per serving.
Veggies are considered ‘free’ carbs to encourage eating more.
BTB milk and alt category.
15g CHO per serving. Includes fortified soy beverages.
BTB other choices category.
15g CHO per serving. Promote variety and choice. Suggested to eat less.
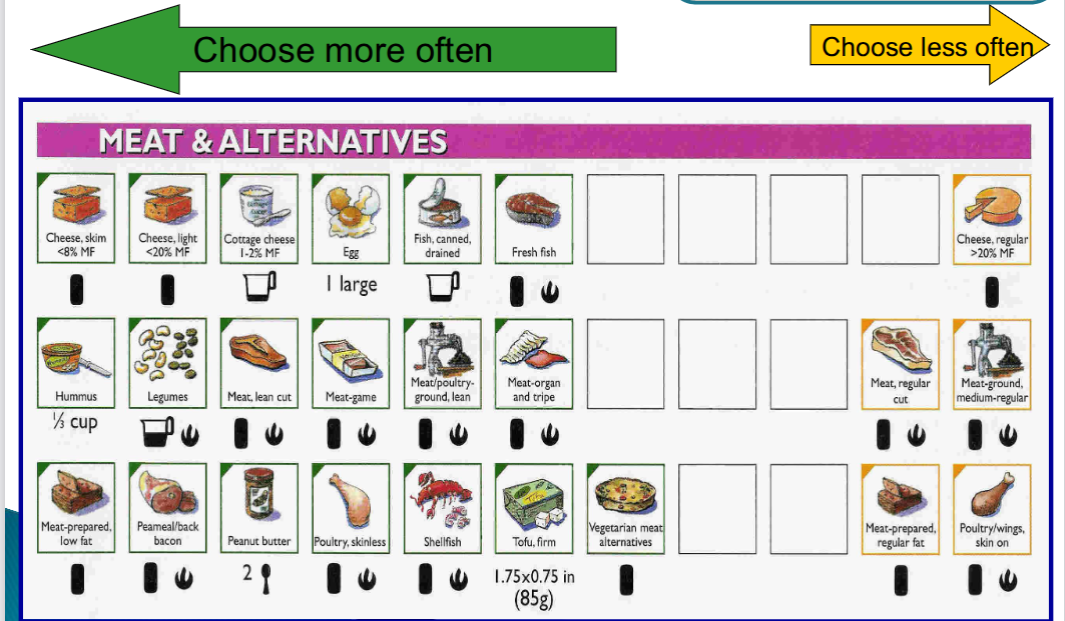
BTB Meat and Alternatives category.
Suggests lower fat, and suggests fish twice a week for Omega-3.
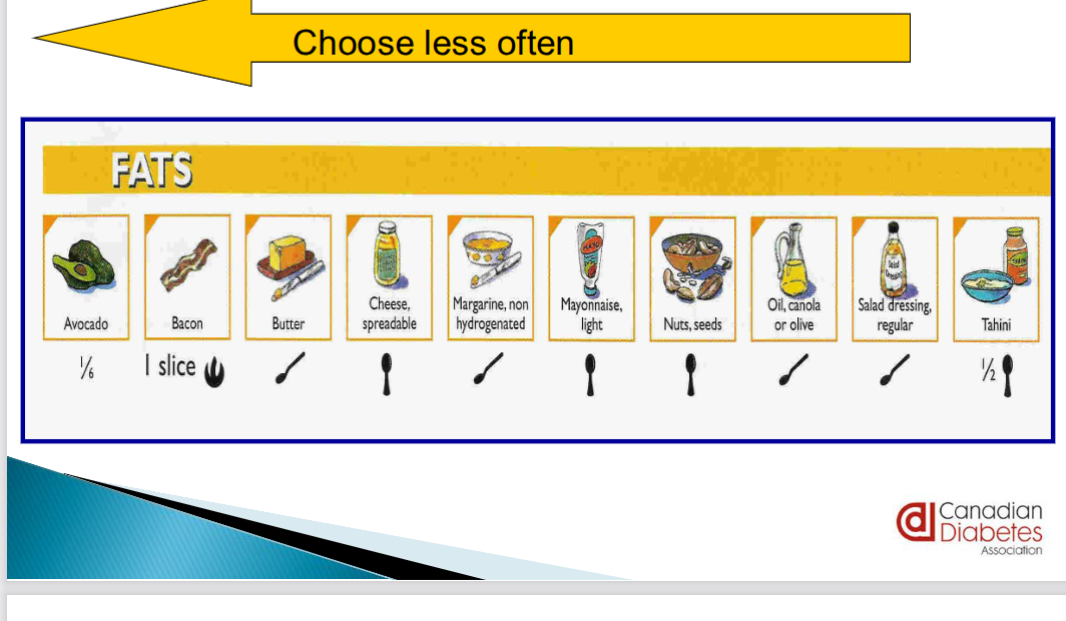
BTB fat category.
How to plan a BTB meal plan?
Determine energy requirements.
Determine % and grams CHO, protein, and fat.
Focus on CHO first.
Distribute CHO exchanges throughout the day.
Determine protein and fat grams in CHO exchanges, compare with goal, add as required.
Consider vegetable intake.
Ensure food groups makes sense for client.
Recheck calculations or use excel tool.