ECON2: Scarcity & Choice
1/106
Earn XP
Description and Tags
Scarcity & Choice
Name | Mastery | Learn | Test | Matching | Spaced | Call with Kai |
|---|
No analytics yet
Send a link to your students to track their progress
107 Terms
PPC (Production Possibilities Curve)
a model that illustrates scarcity & tradeoffs
Scarcity
When someone or something faces a constraint
Every choice has a cost =
opportunity cost
opportunity cost
What you have to give up to buy/obtain the other thing you want.
Curved PPC means
A curved PPC implies that the opportunity cost of the good on the horizontal axis is rising as more is produced
Productive efficiency means
producing to the maximum efficiency then when you want to produce more you will have to produce less of your other good
Recession
Unemployment above normal & economy not producing at its full potential
Comparative Advantage =
Low Opportunity Cost
Scarcity
High demand for a low availability good
Demand =
Consumers (buying side)
Is the demand curve slope positive or negative?
Negative
Supply =
Producers (selling side)
Is the demand curve slope positive or negative?
Positive
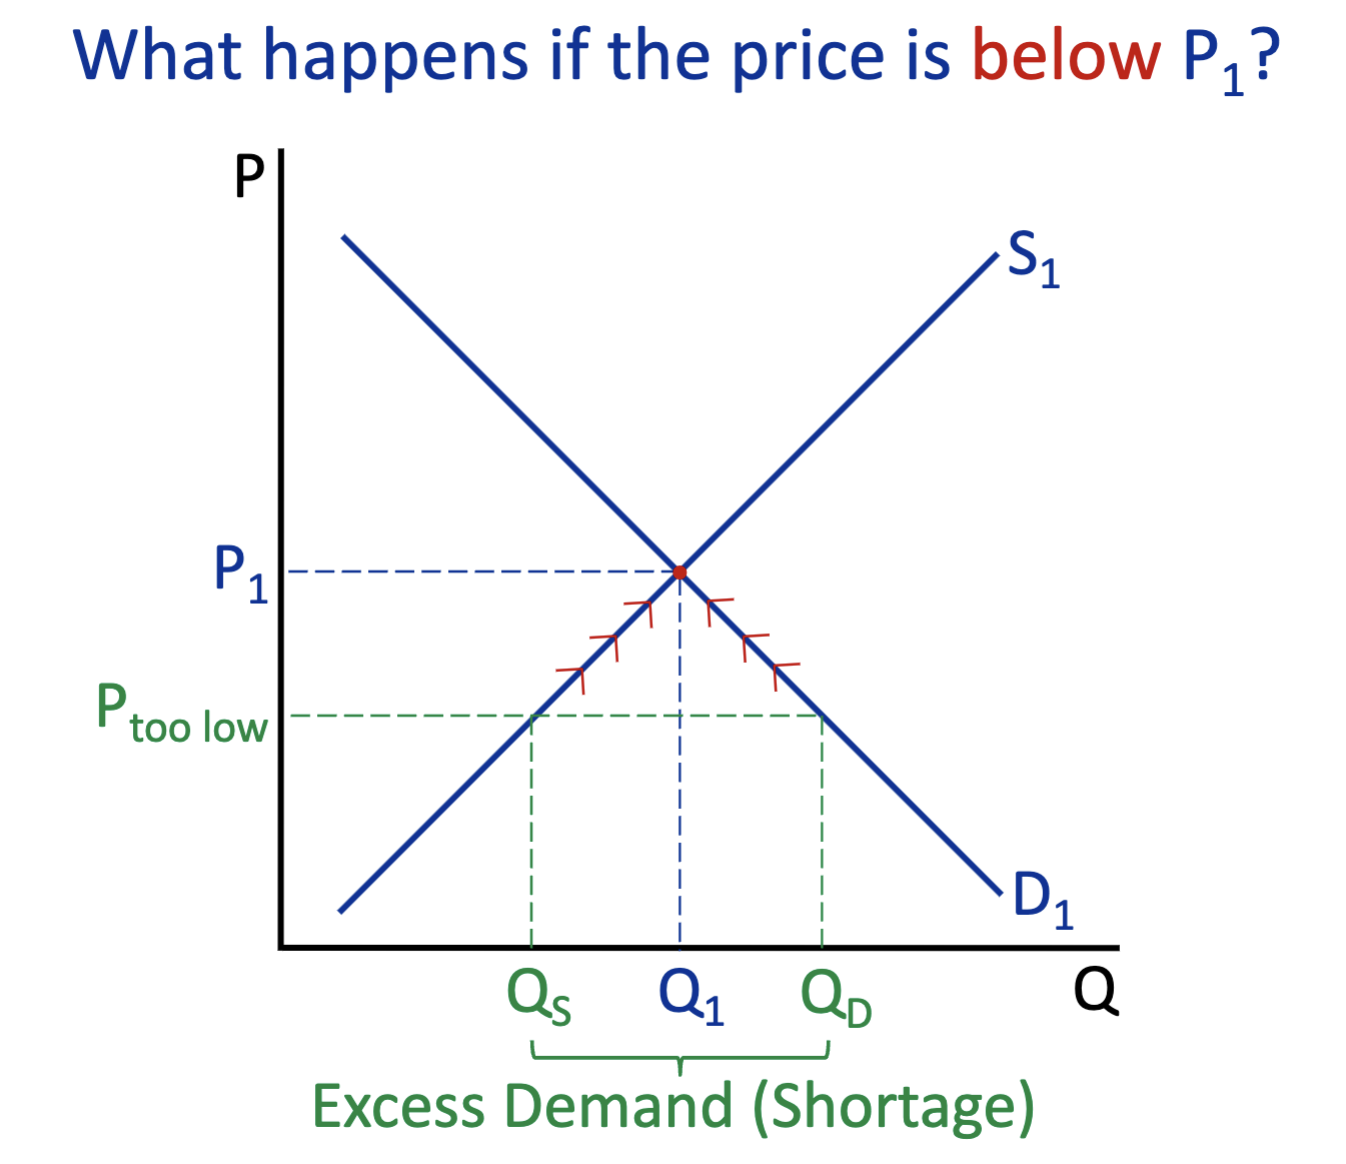
What happens below P1? (demand & supply)
Excess Demand (Shortage)
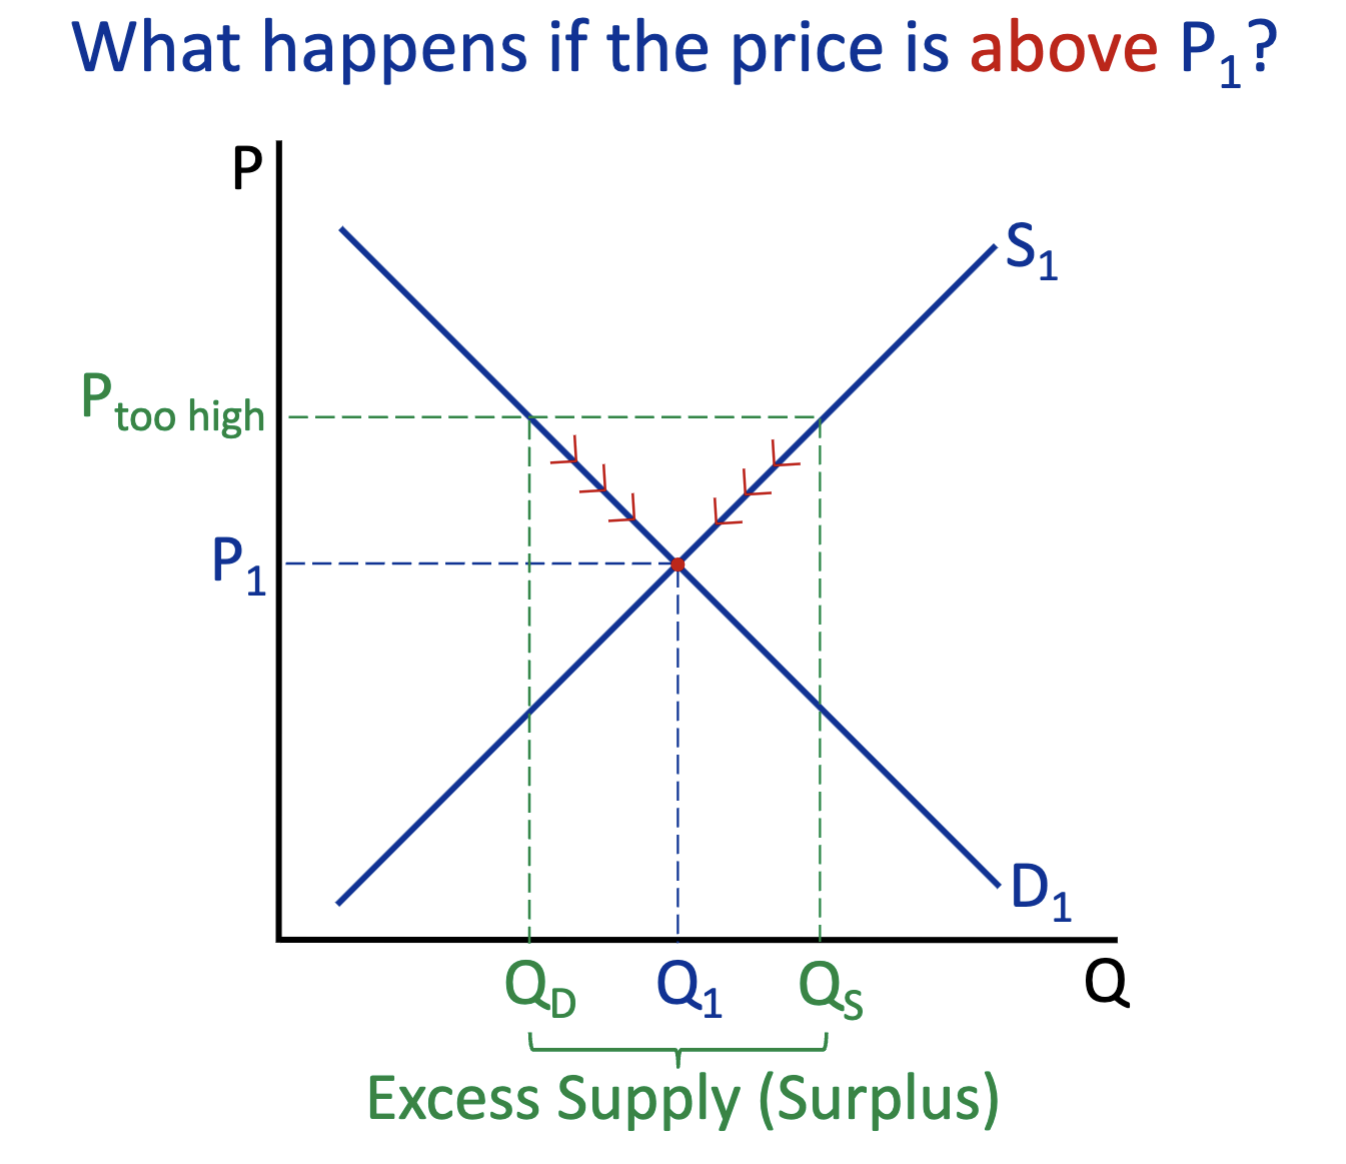
What happens above P1? (demand & supply)
Excess Supply (Surplus)
Ceteris Paribus
Everything equal but the price
Decrease costs of production, the supply curve shifts?
Shifts to the right
Innovation improvement, the supply curve shifts?
Shifts to the right
Increase in the number of producers, the supply curve shifts?
Shifts to the right
Increased cost of production, the supply curve shifts?
Shifts to the left
Natural disasters, the supply curve shifts?
Shifts to the left
Decrease in the number of producers, the supply curve shifts?
Shifts to the left
A tax, the supply curve shifts?
Shifts to the left
Change in taste, the demand curve shifts?
Shifts to the right
Increase in income, the demand curve shifts?
Shifts to the right
Increase in market population, the demand curve shifts?
Shifts to the right
Increase in price of a substitute good, the demand curve shifts?
Shifts to the right
Decrease in price of complementary, the demand curve shifts?
Shifts to the right
Change in taste, the demand curve shifts?
Shifts to the left
Decrease in income, the demand curve shifts?
Shifts to the left
Decrease in market population, the demand curve shifts?
Shifts to the left
Decrease in price of substitute good, the demand curve shifts?
Shifts to the left
Increase in price of complementary good, the demand curve shifts?
Shifts to the left
Price Ceiling
Sets the maximum amount a seller can charge for a good or service (normally a govn’t) eg: gas, medicine, and food
Price Floor
lowest legal price that can be paid in a market (min price)
Economic Surplus = the respective gains that a consumer or producer gets within an economic activity
Consumer Surplus + Producer Surplus = Total economic surplus
Marginal Benefit
max amount a consumer is willing to pay for an additional good or service
Marginal Cost
the change in total production cost that comes from making or producing one more unit.
Allocative Efficiency
ensures that resources are used so that their marginal benefit to society is equal to their marginal cost.
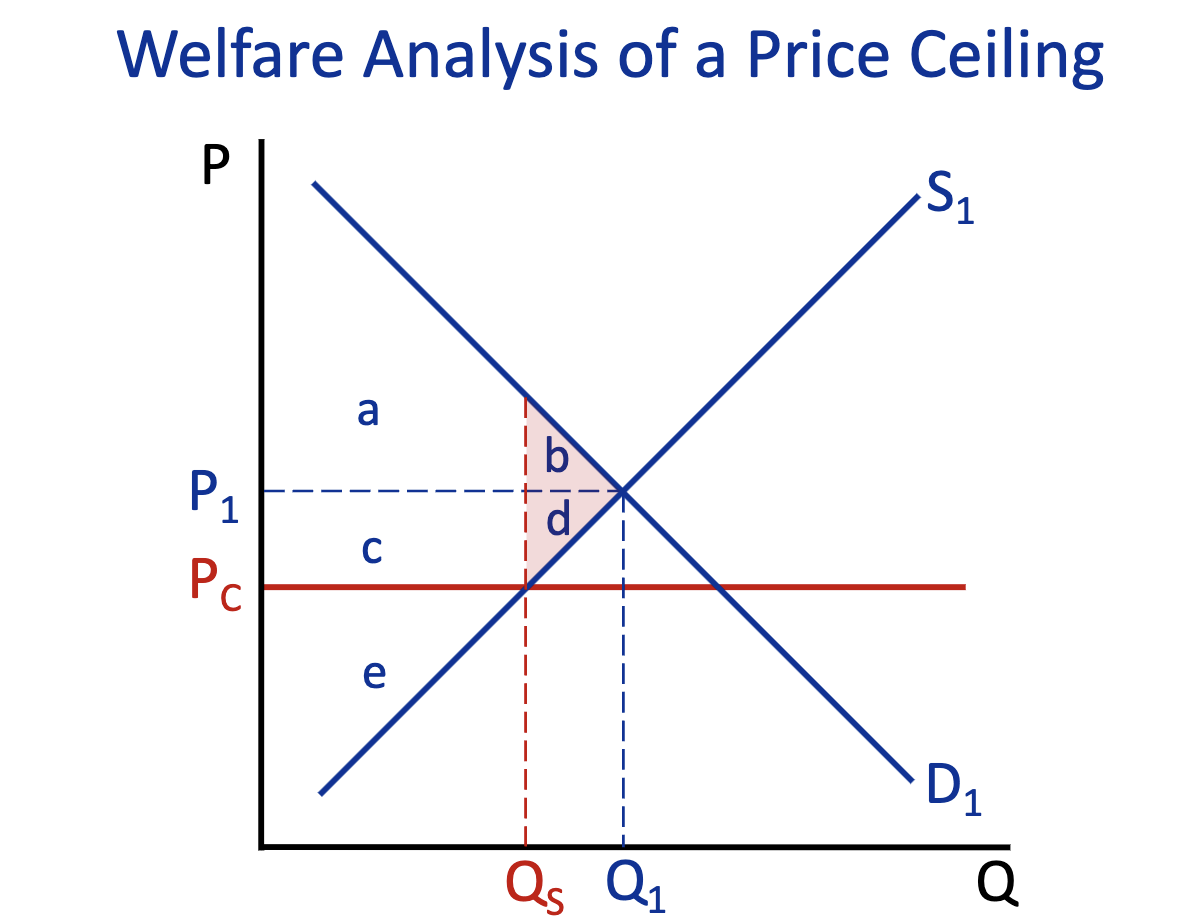
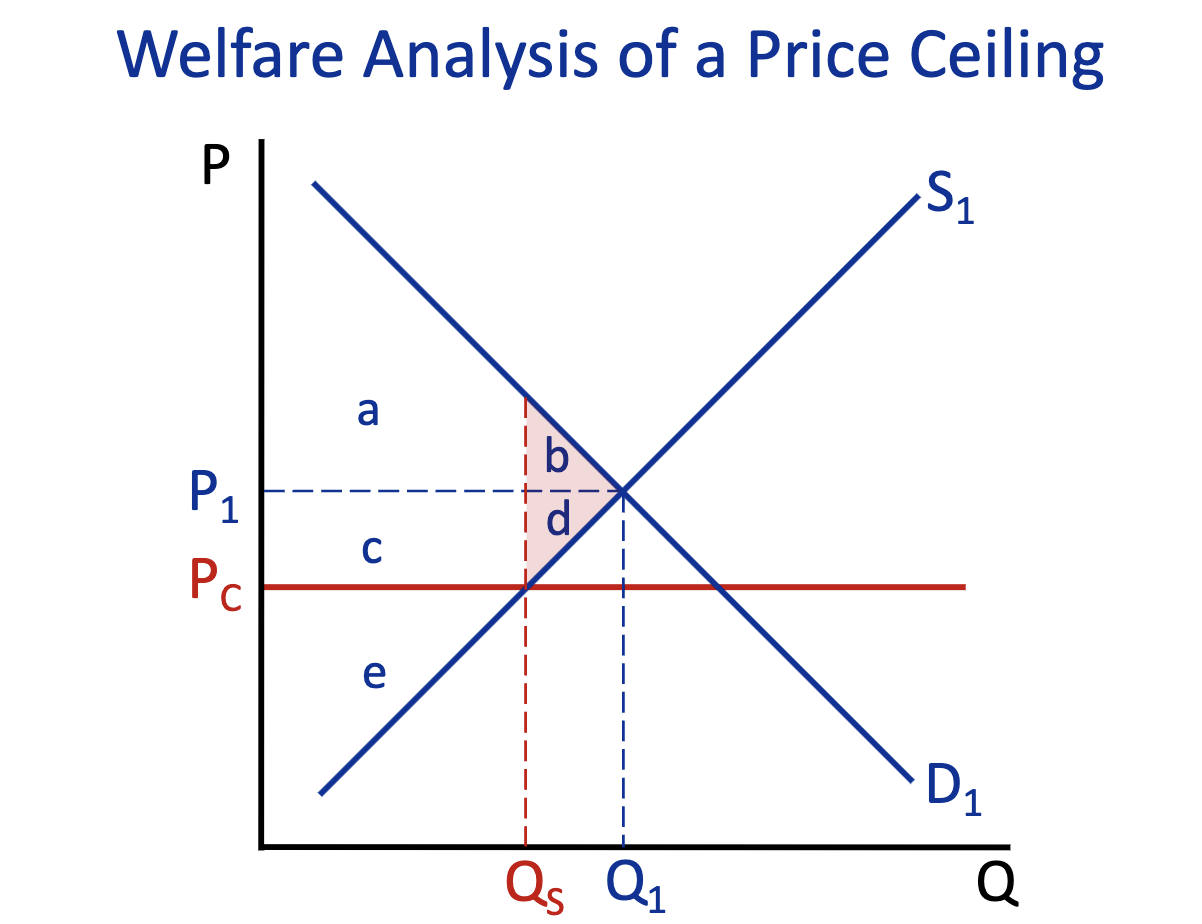
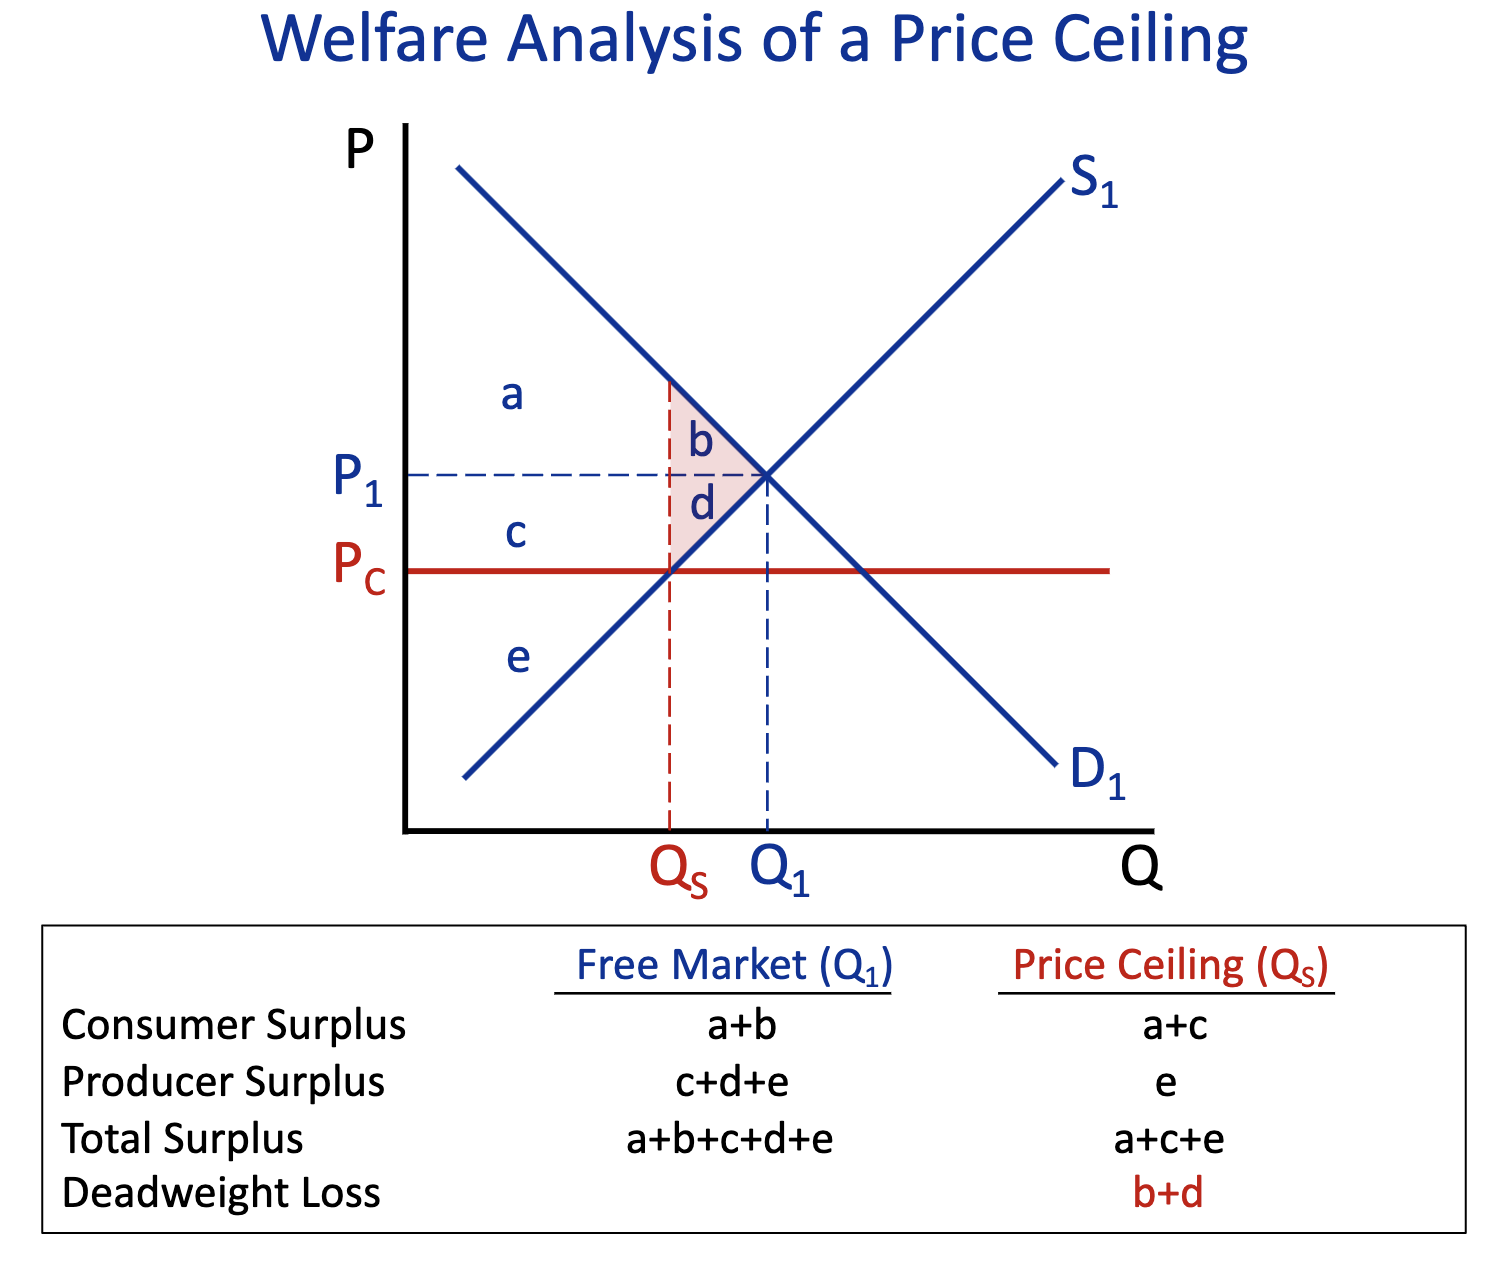
Consumer Surplus: Free Market (Q1) & Price Ceiling (Q2)
Free Market (Q1) : a+b
Price Ceiling (Q2) : a+c
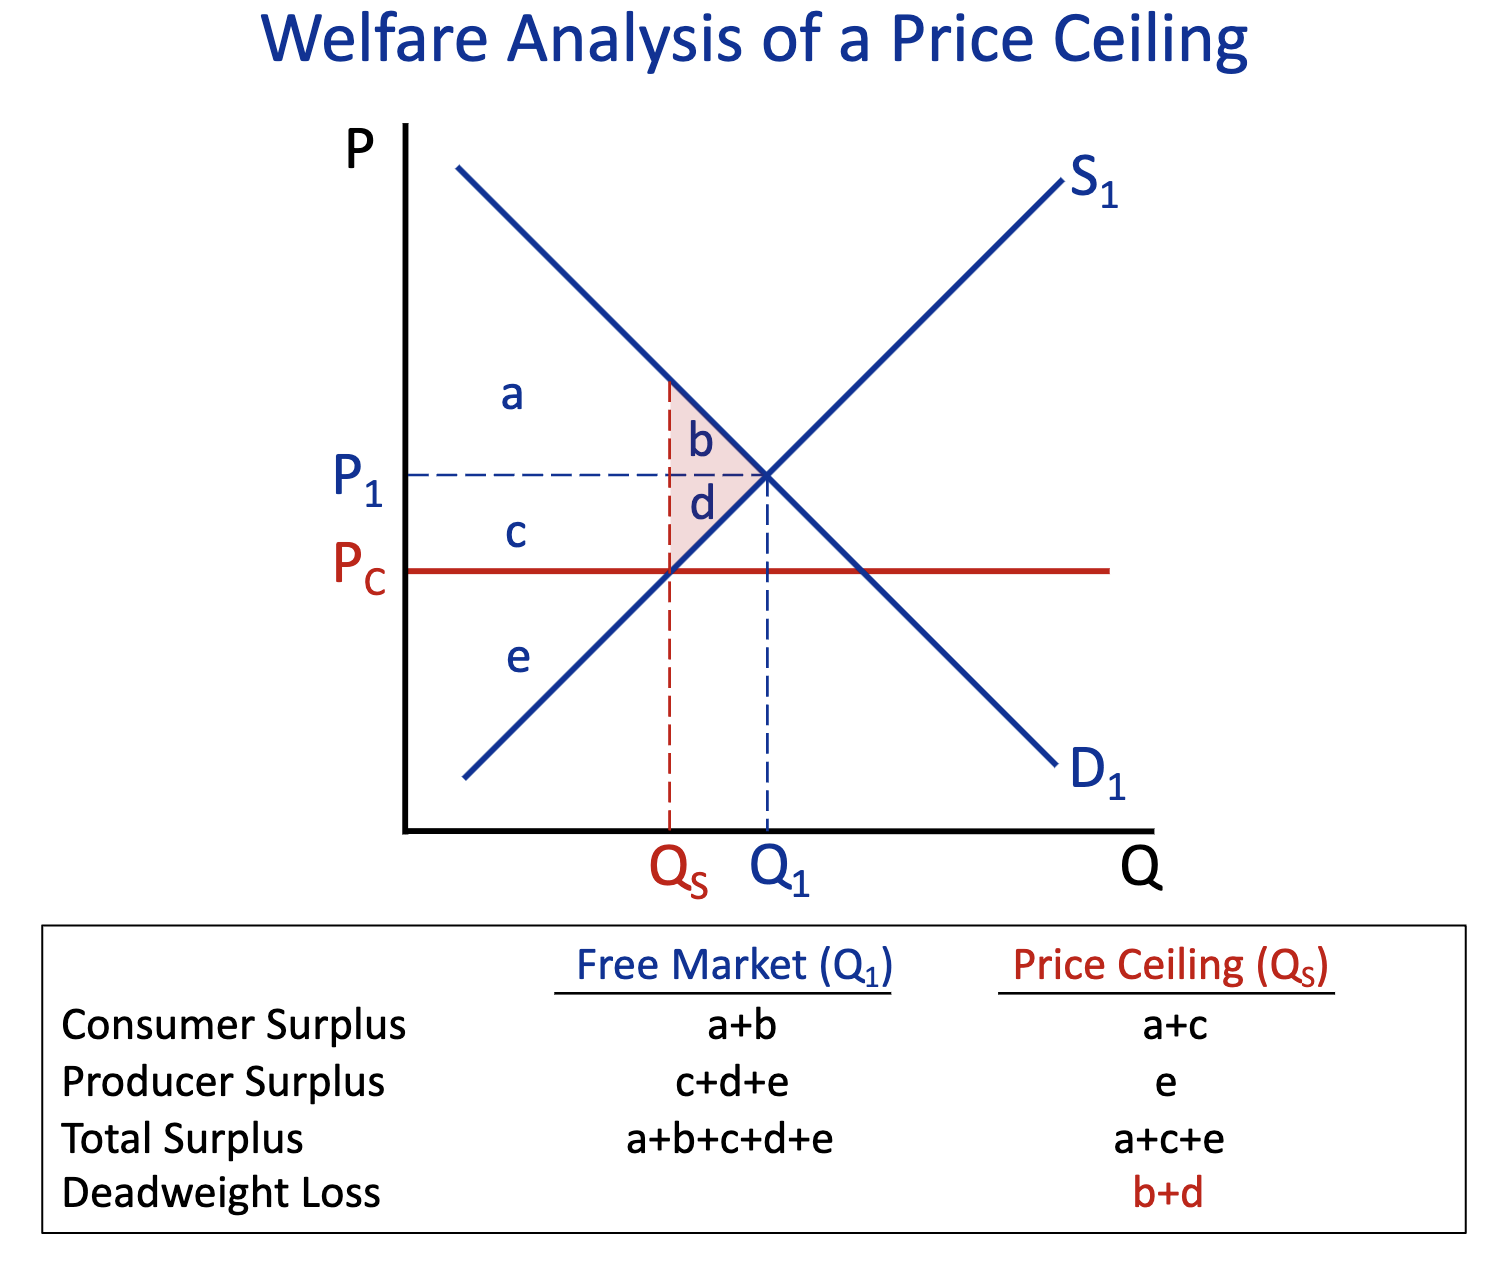
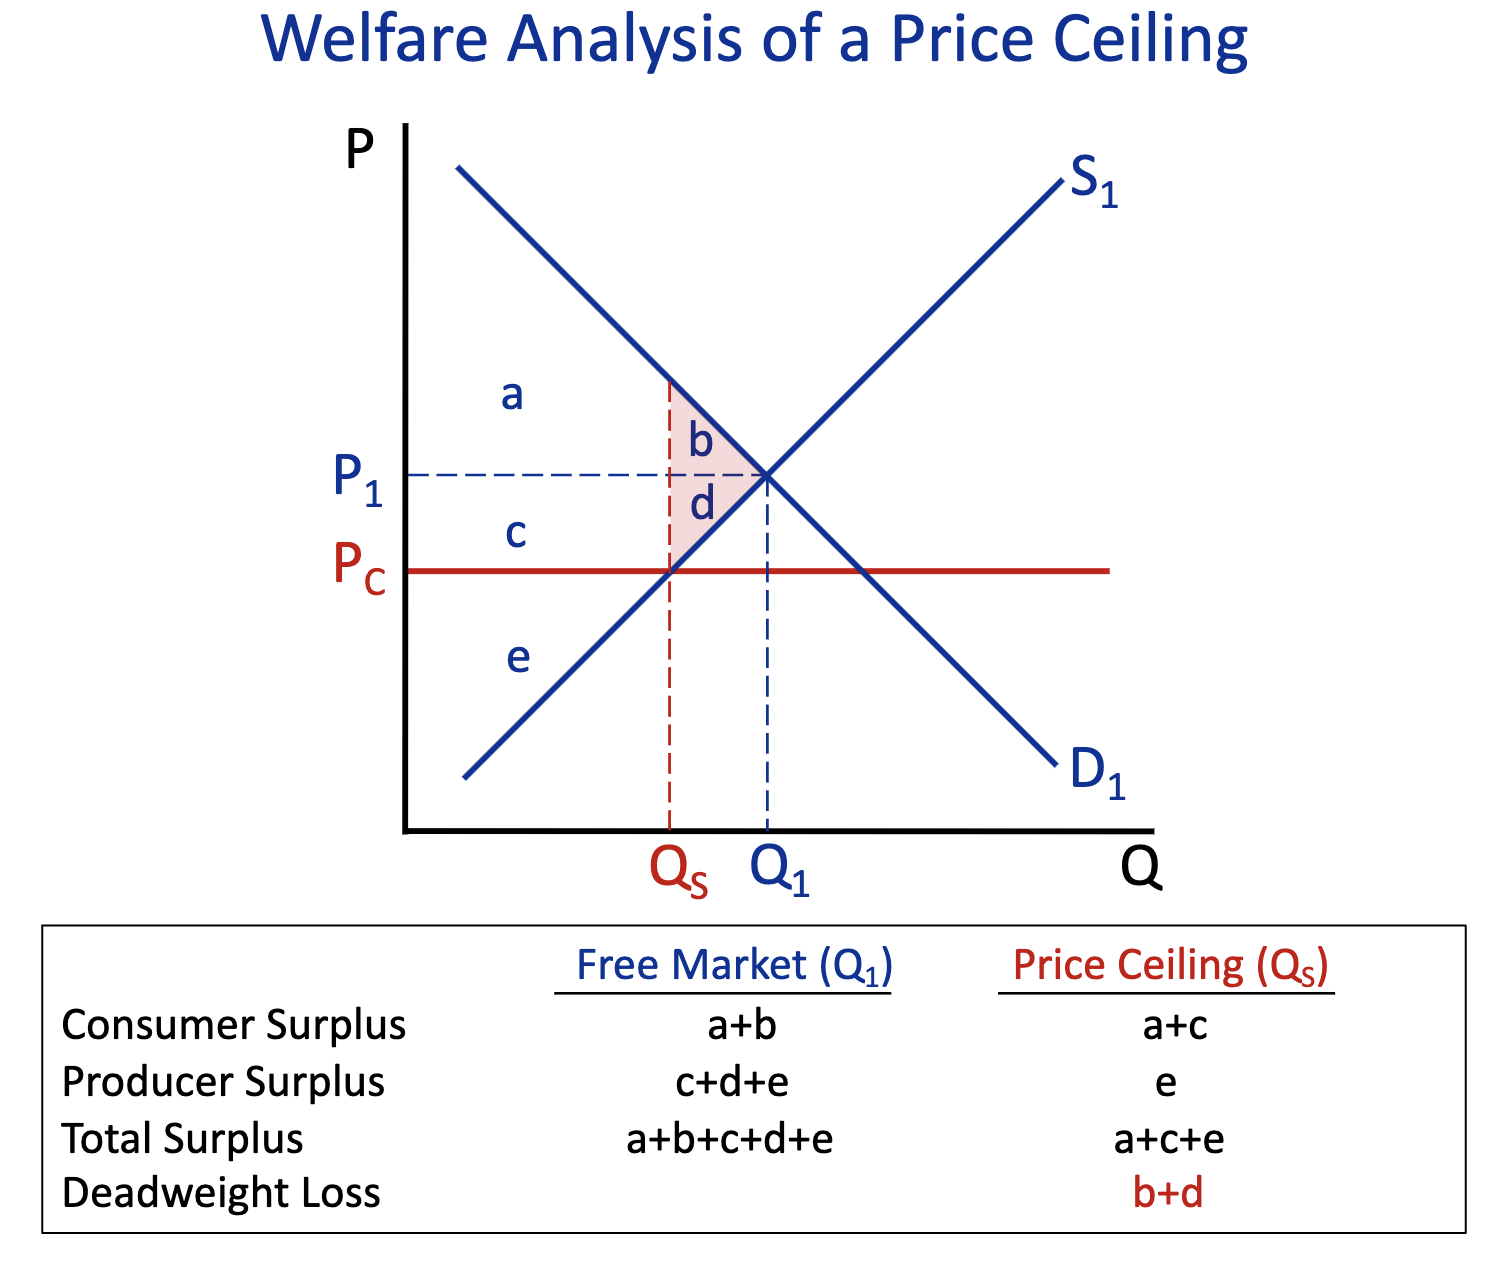
Producer Surplus: Free Market (Q1) & Price Ceiling (Q2)
Free Market (Q1) : c+d+e
Price Ceiling (Q2) : e
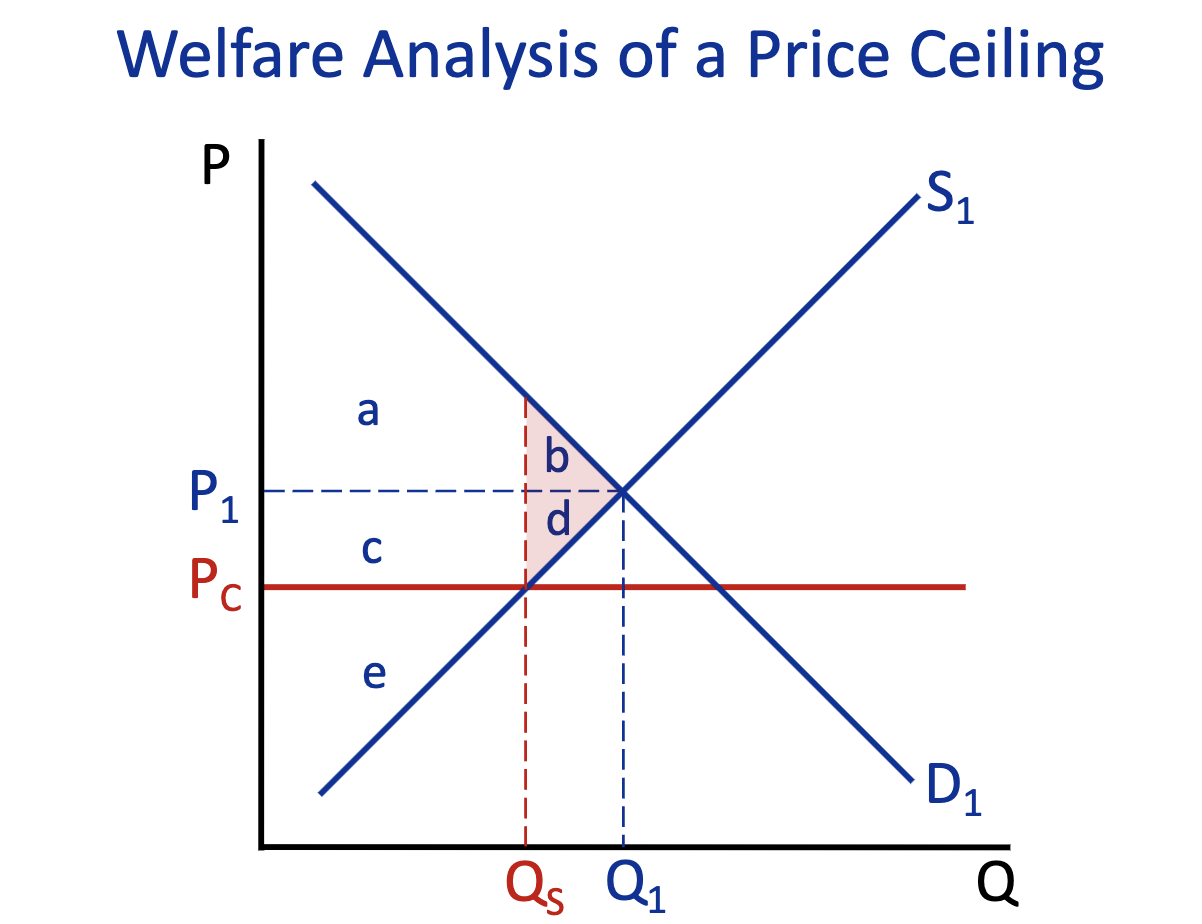
Total Surplus: Free Market (Q1) & Price Ceiling (Q2)
Free Market (Q1) : a+b+d+c+e
Price Ceiling (Q2) : a+c+e
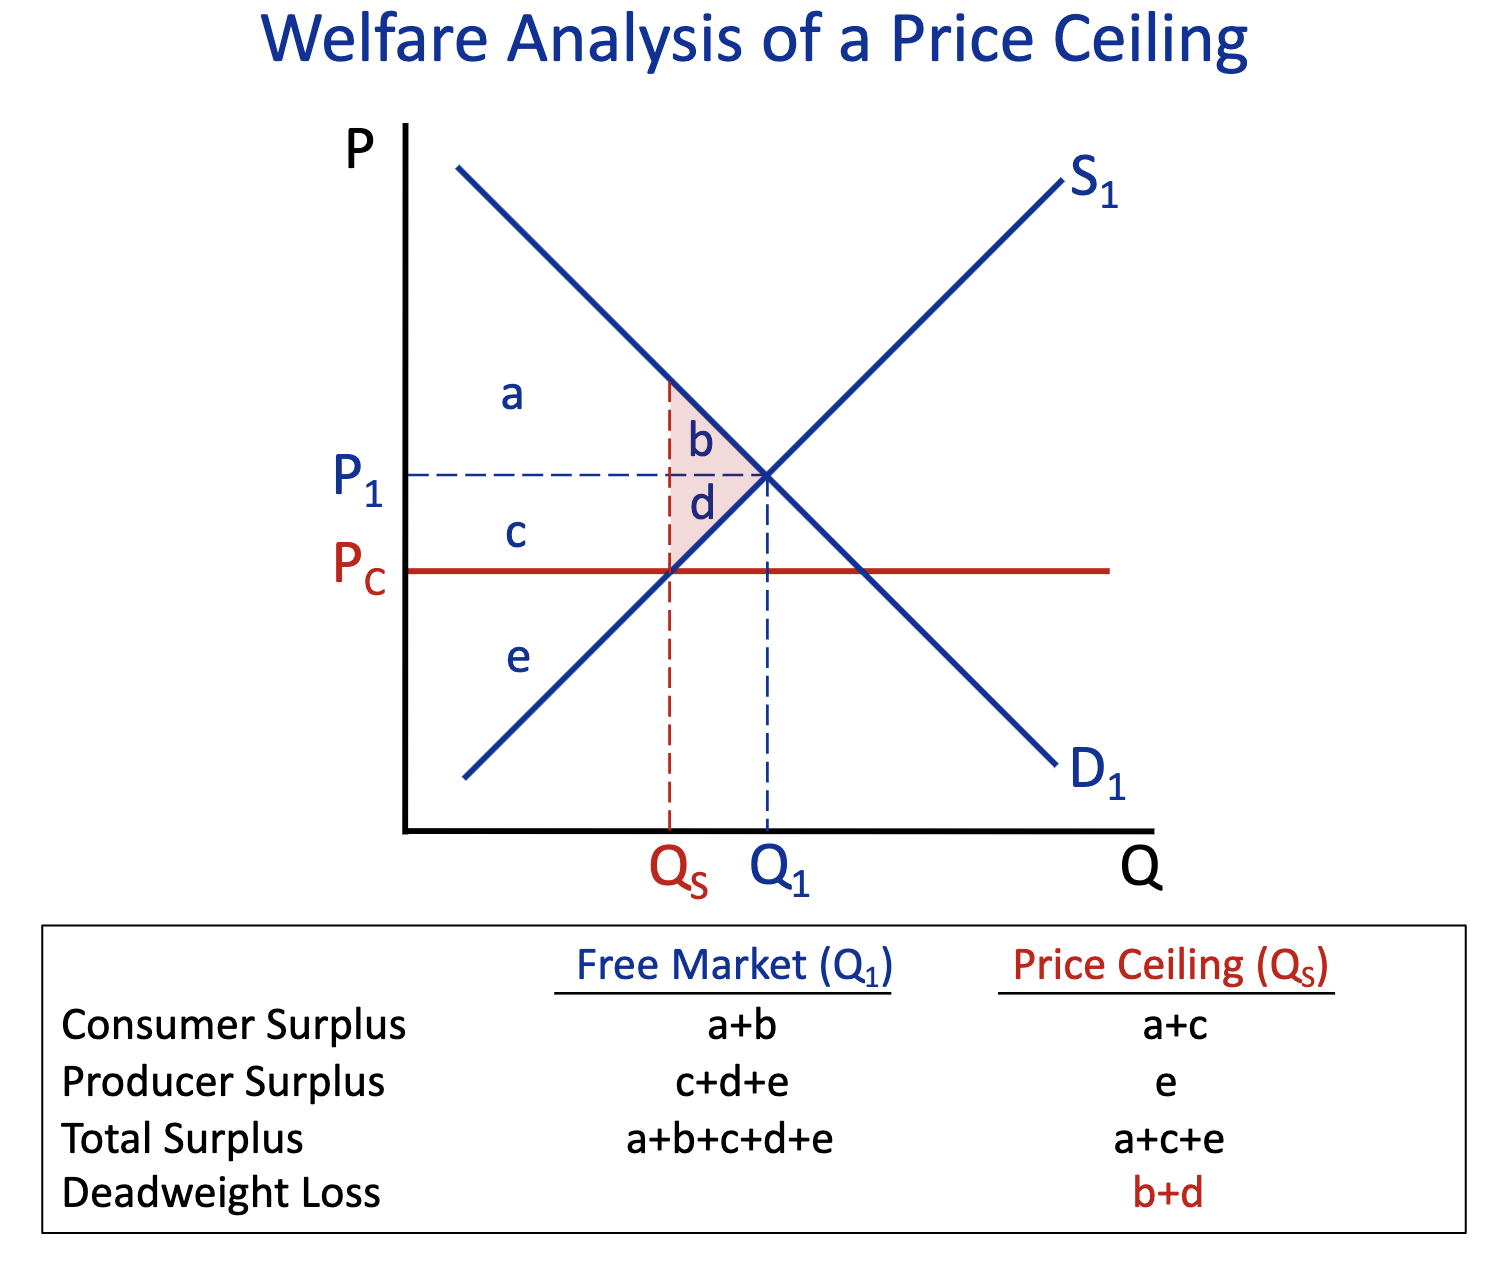
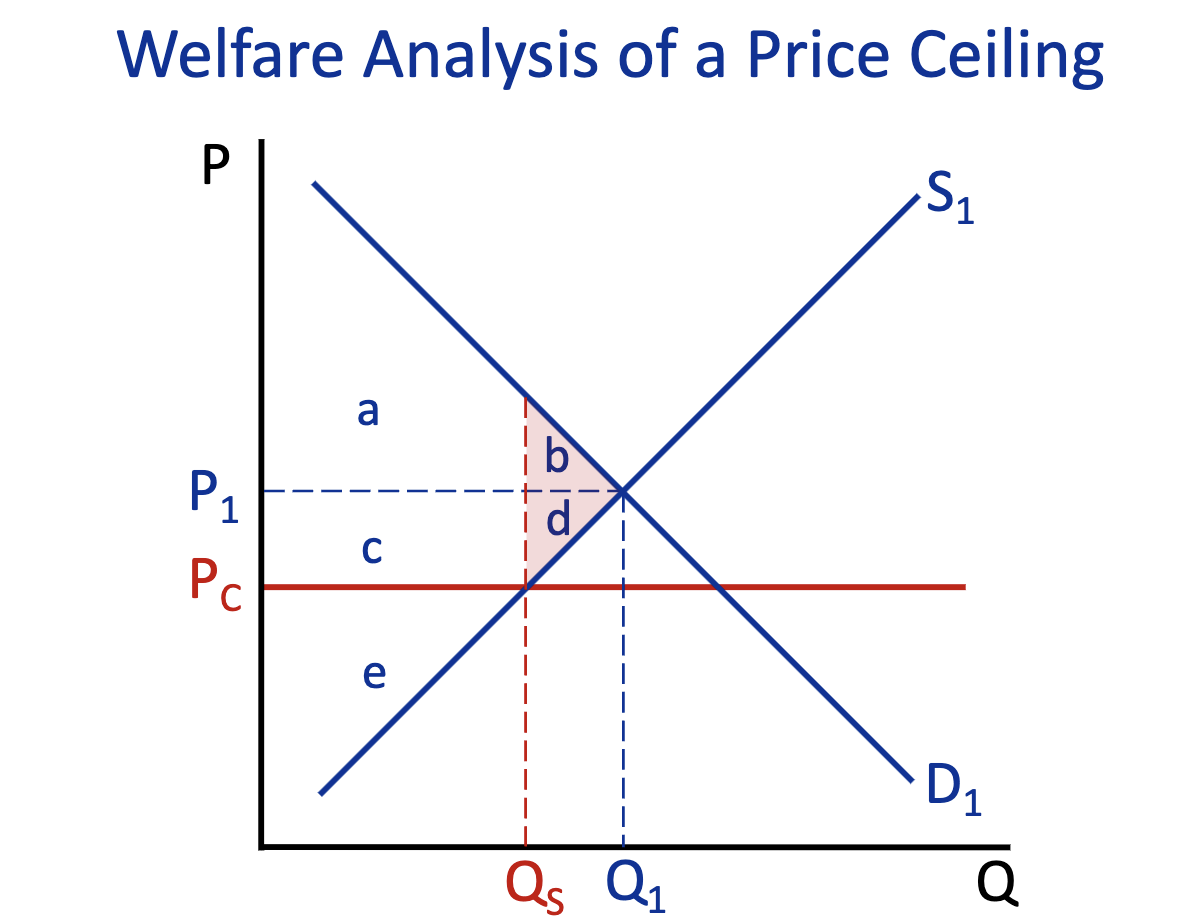
Deadweight Loss: Free Market (Q1) & Price Ceiling (Q2)
Free Market (Q1) :
Price Ceiling (Q2) : b+d
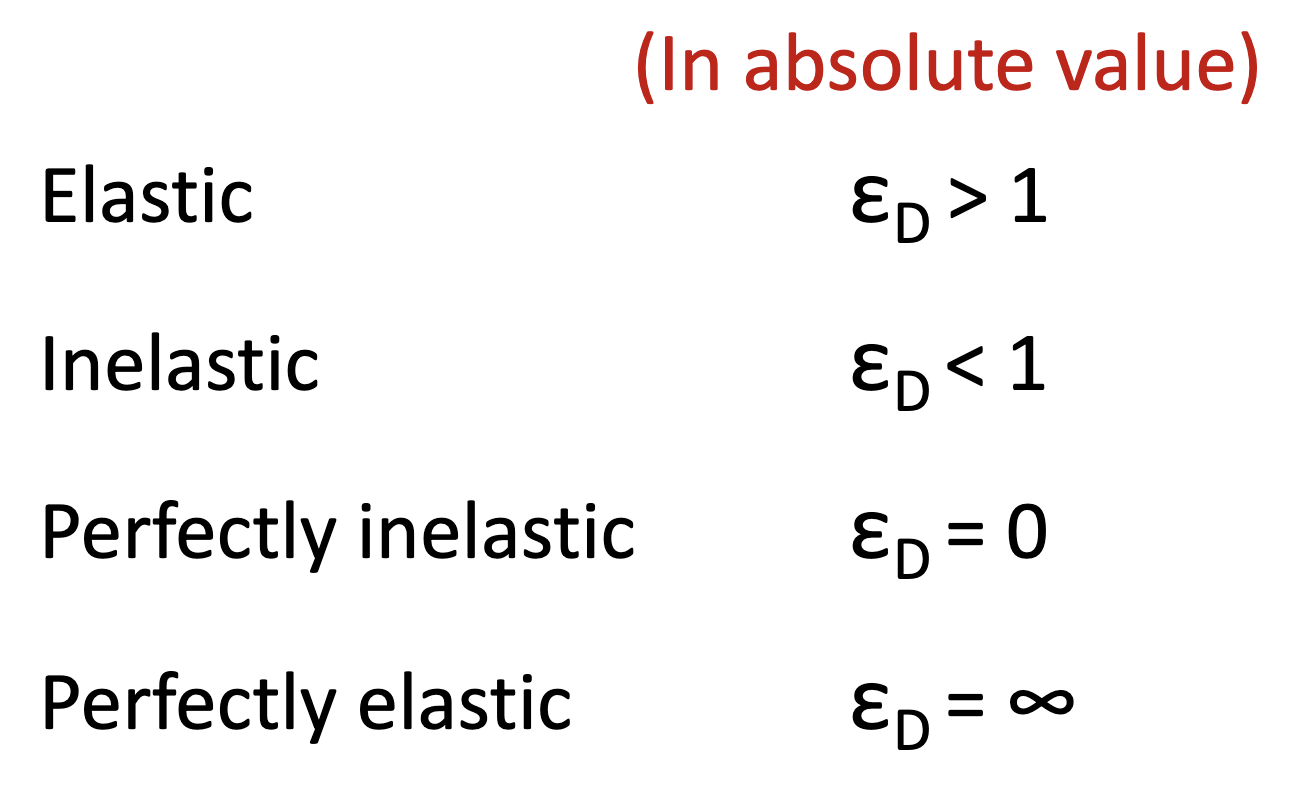
What is the equation for elasticity? (Demand & Supply)

Elasticity? Inelasticity? Perfectly Elasticity? Perfectly Inelasticity? (Demand & Supply)
When demand is inelastic?
When there is no close substitute good & consumers need this good.
When supply is inelastic?
When there is a resource constraint (short-run)
When demand is elastic?
When there is a close substitute or when consumers do not need this good
When supply is elastic?
When there are no hard resource constraint (long-run)
Total Expenditure means
what consumers spend on a product at a given price.
What is the total expenditure equation?
Price * Quantity = Total Expenditure
Inelastic or elastic if the total expenditure rises when the supply curve shifts back?
Inelastic
Inelastic or elastic if the total expenditure falls when the supply curve shifts back?
Elastic
What happens to the supply curve when tax is raised higher?
the supply curve shifts up/left
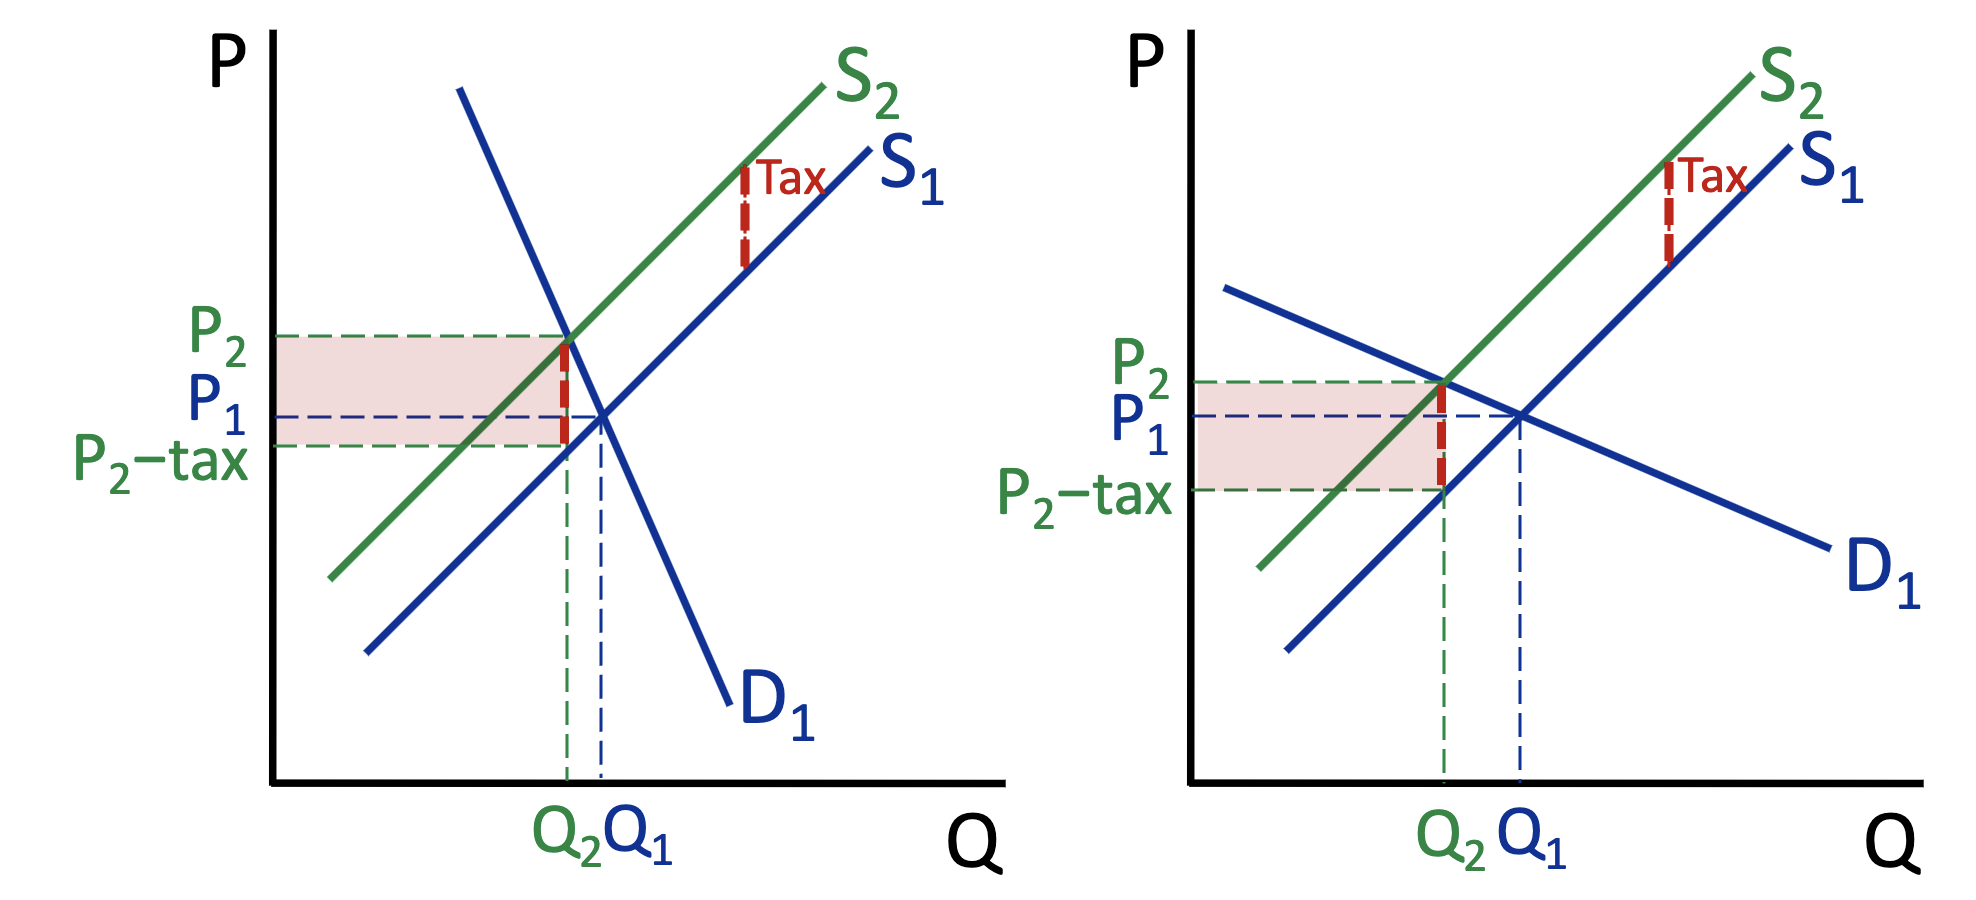
Which one is inelastic and elastic?
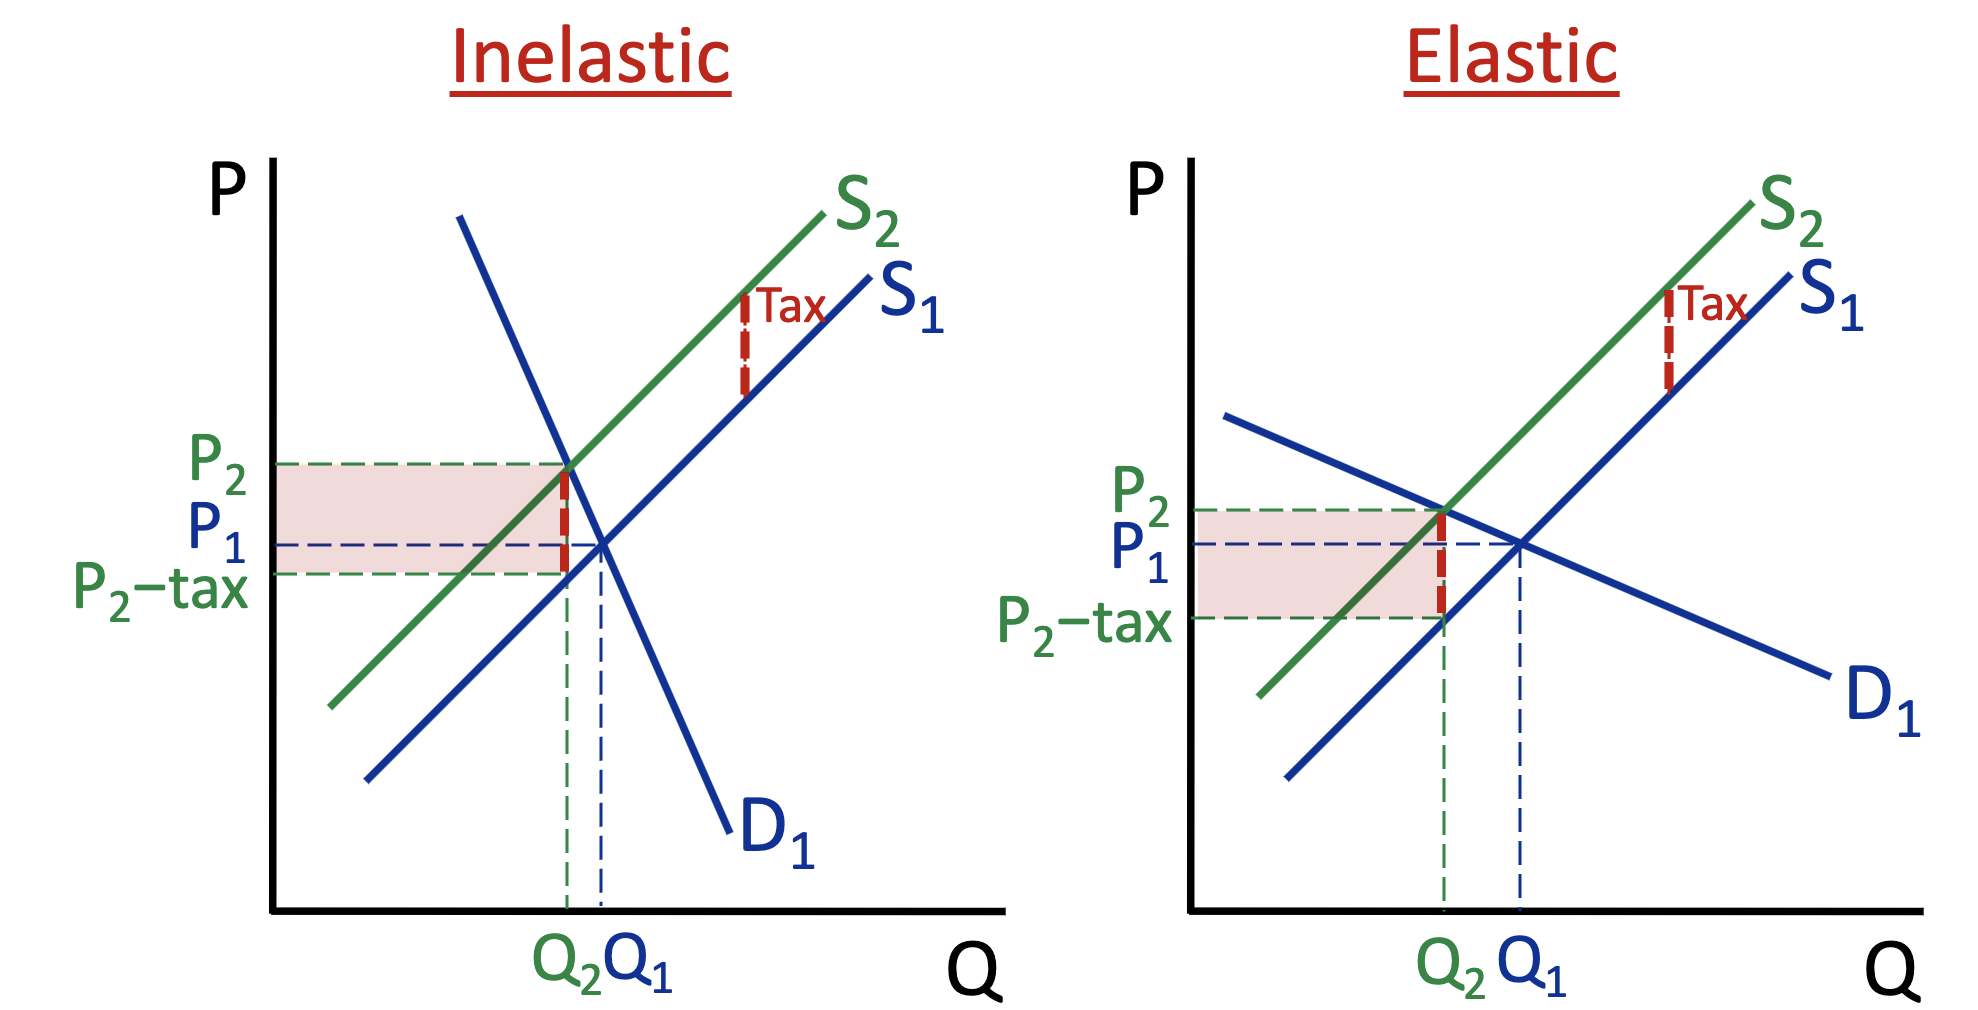
Do inelastic factors bear or avoid the tax?
bear
Do elastic factors bear or avoid the tax?
avoid
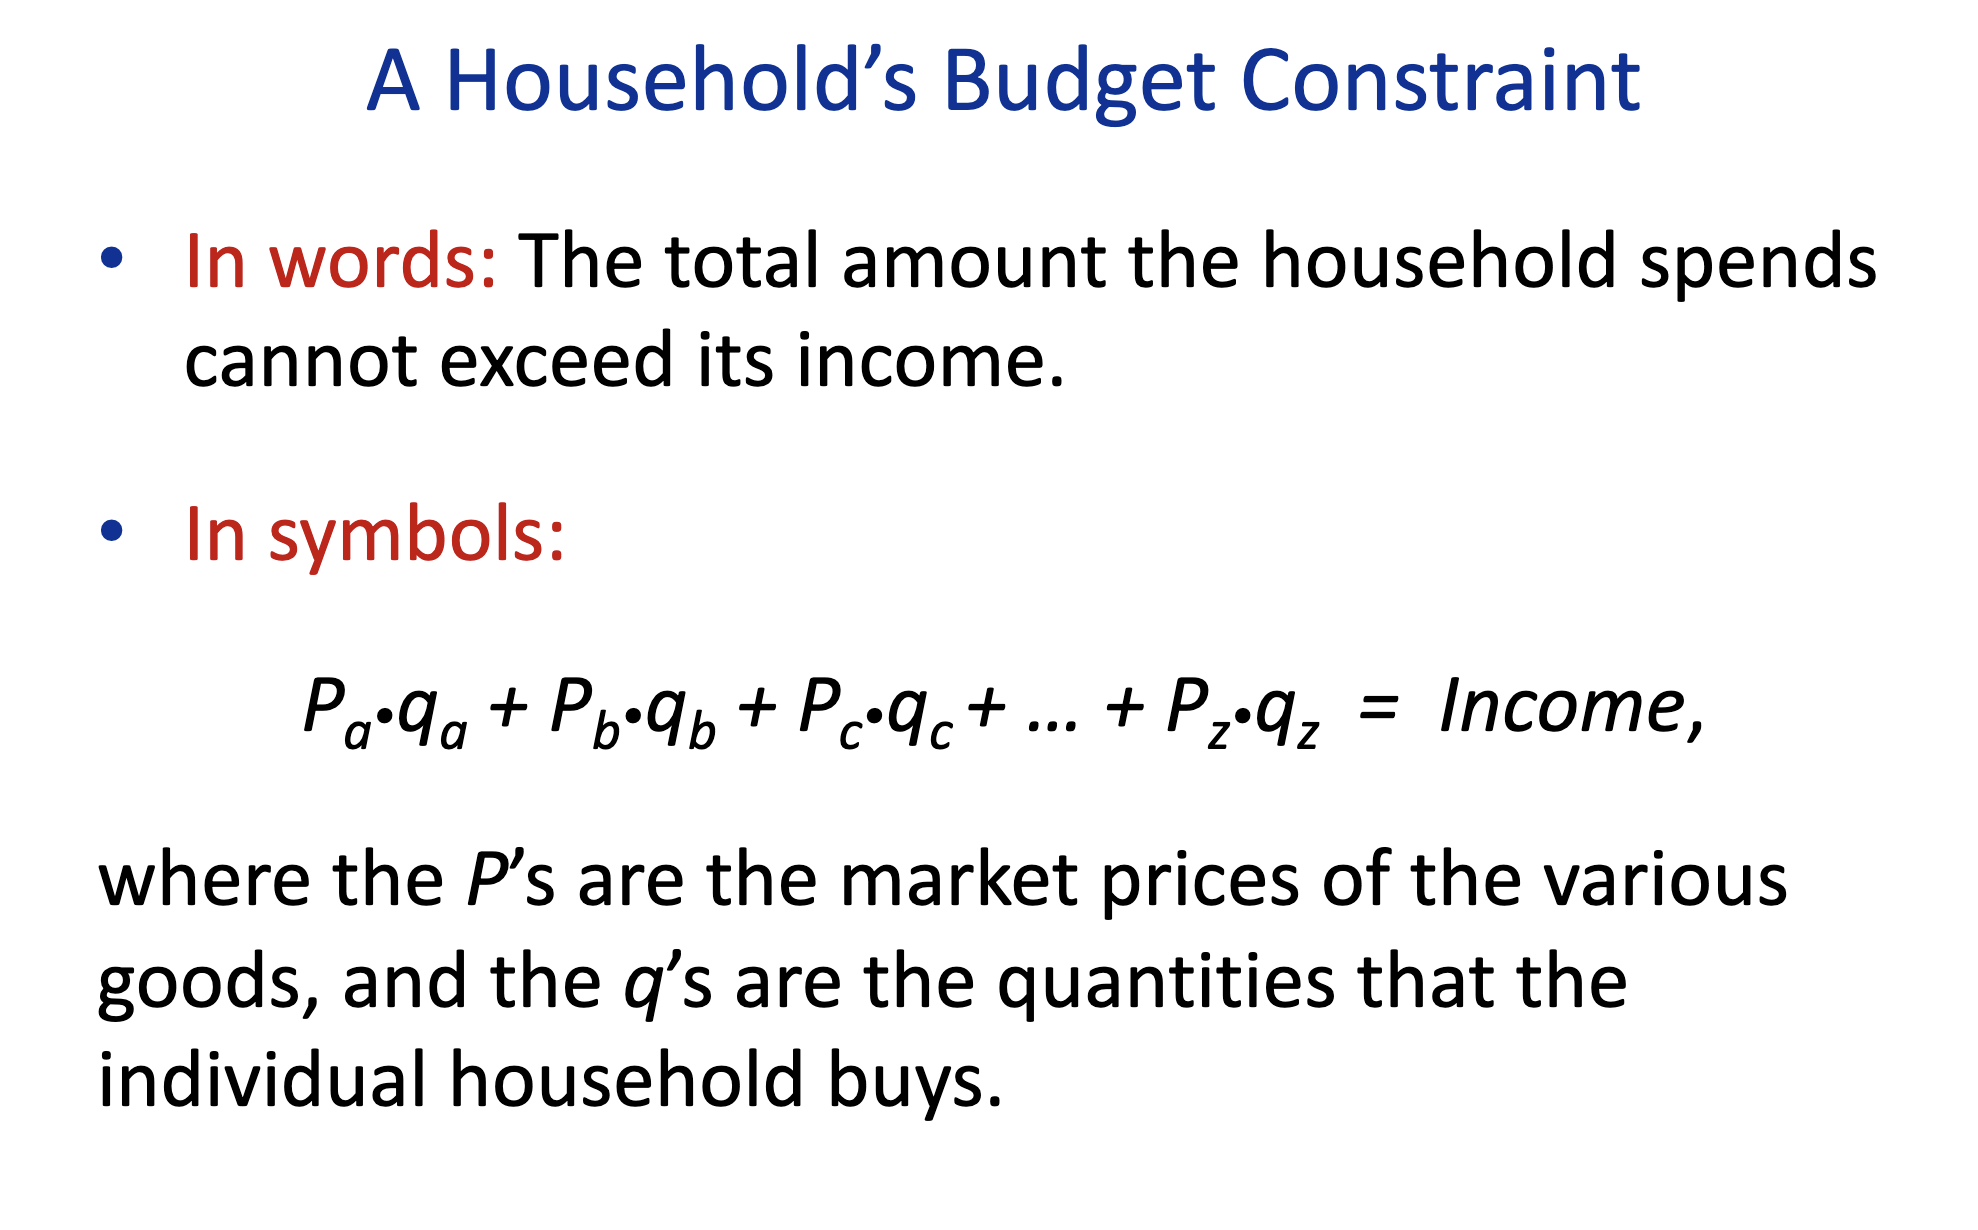
A household budget constraint equation:
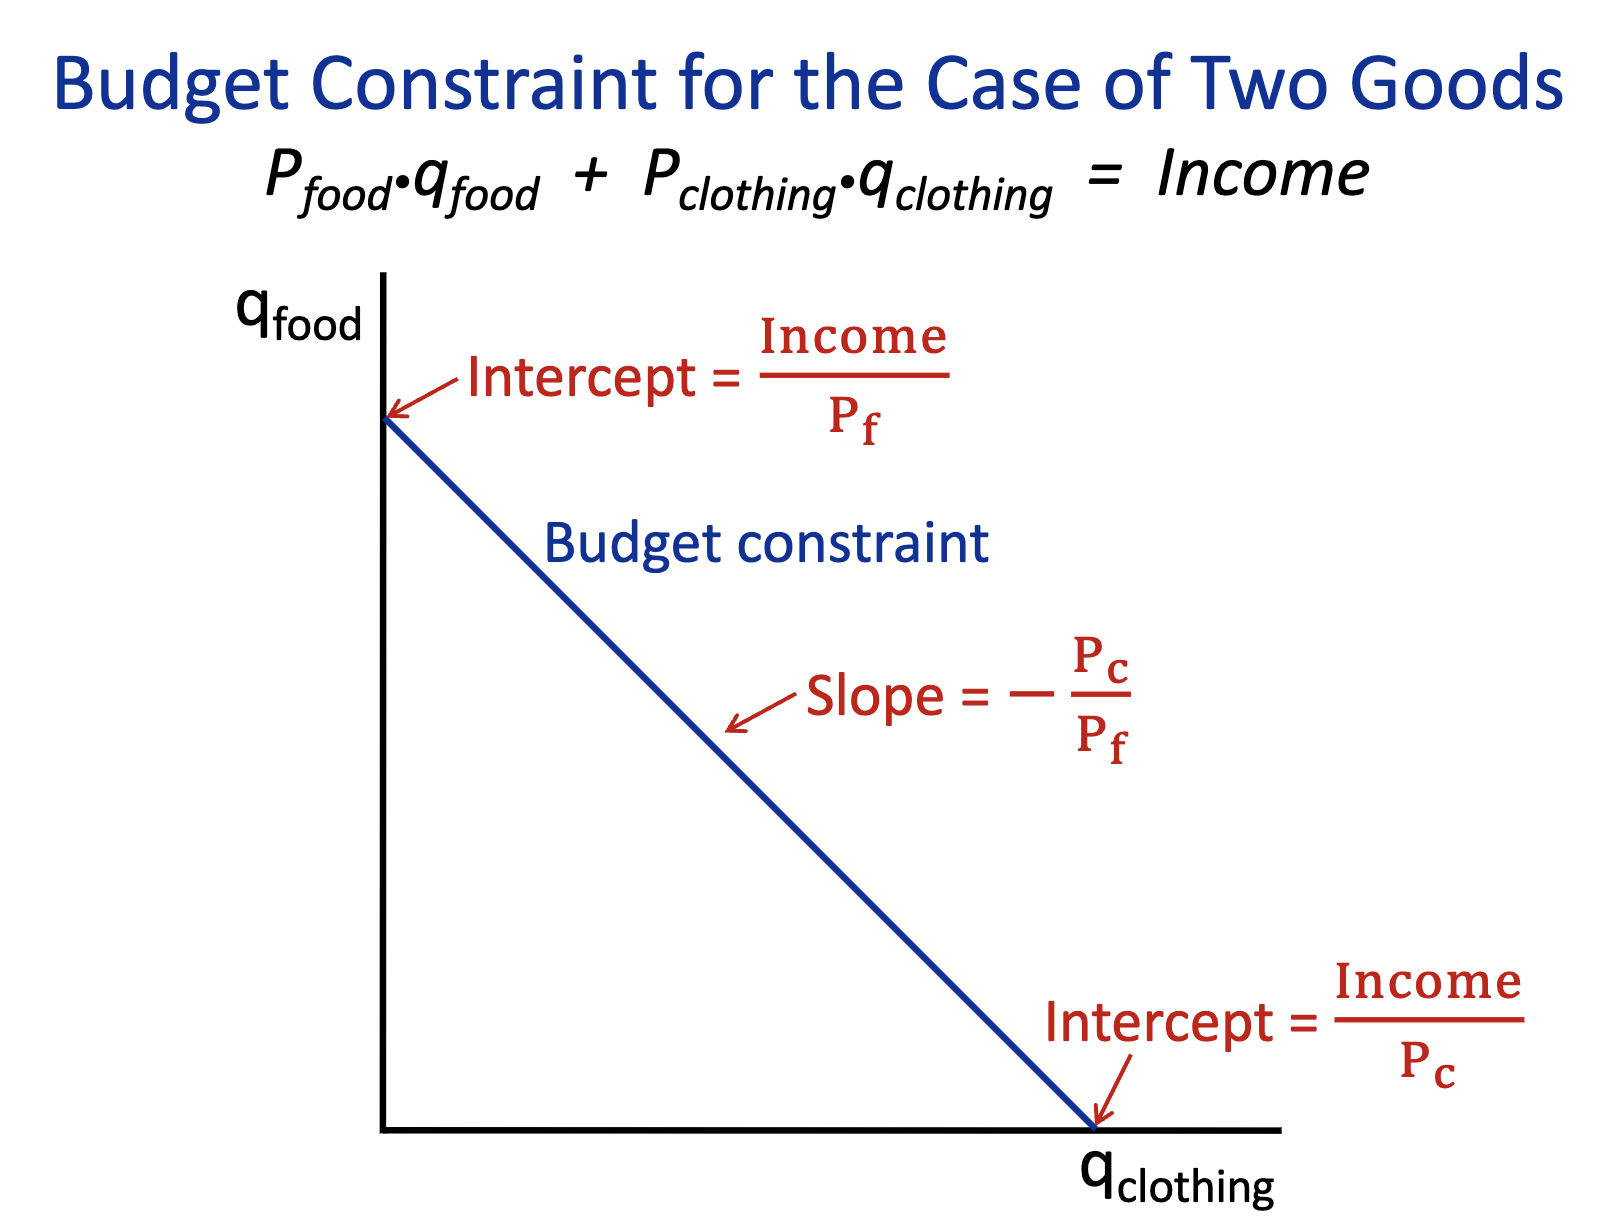
Budget Constraint equation for two goods:
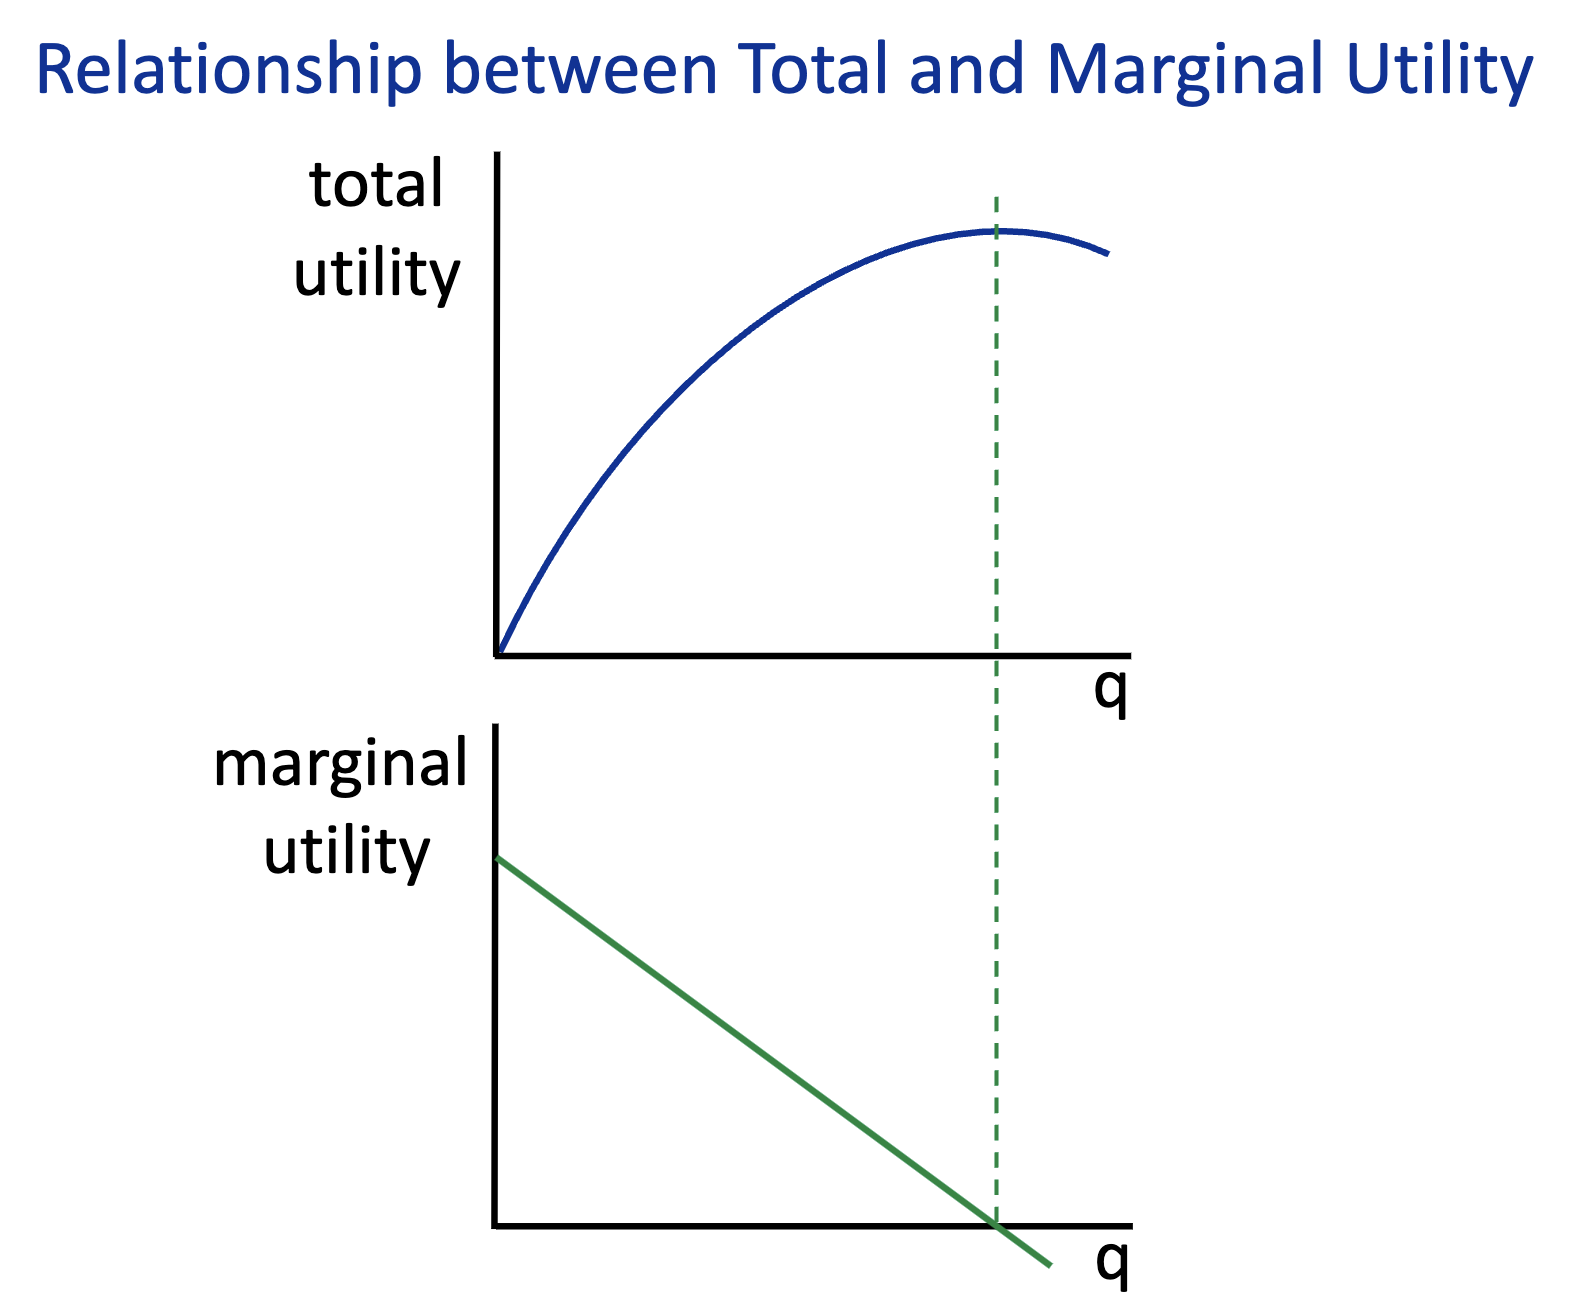
Total Utility
The total happiness one gets from consuming a given amount of a good
Marginal Utility
addition satisfaction a consumer gets from having one more unit of a good or service.
Diminishing Marginal Ulility
The marginal utility of a good or service declines as more of it is consumed by an individual.
What is the equation for the total utility?

What is the equation for the marginal utility?

Draw the graphs of total and marginal utility
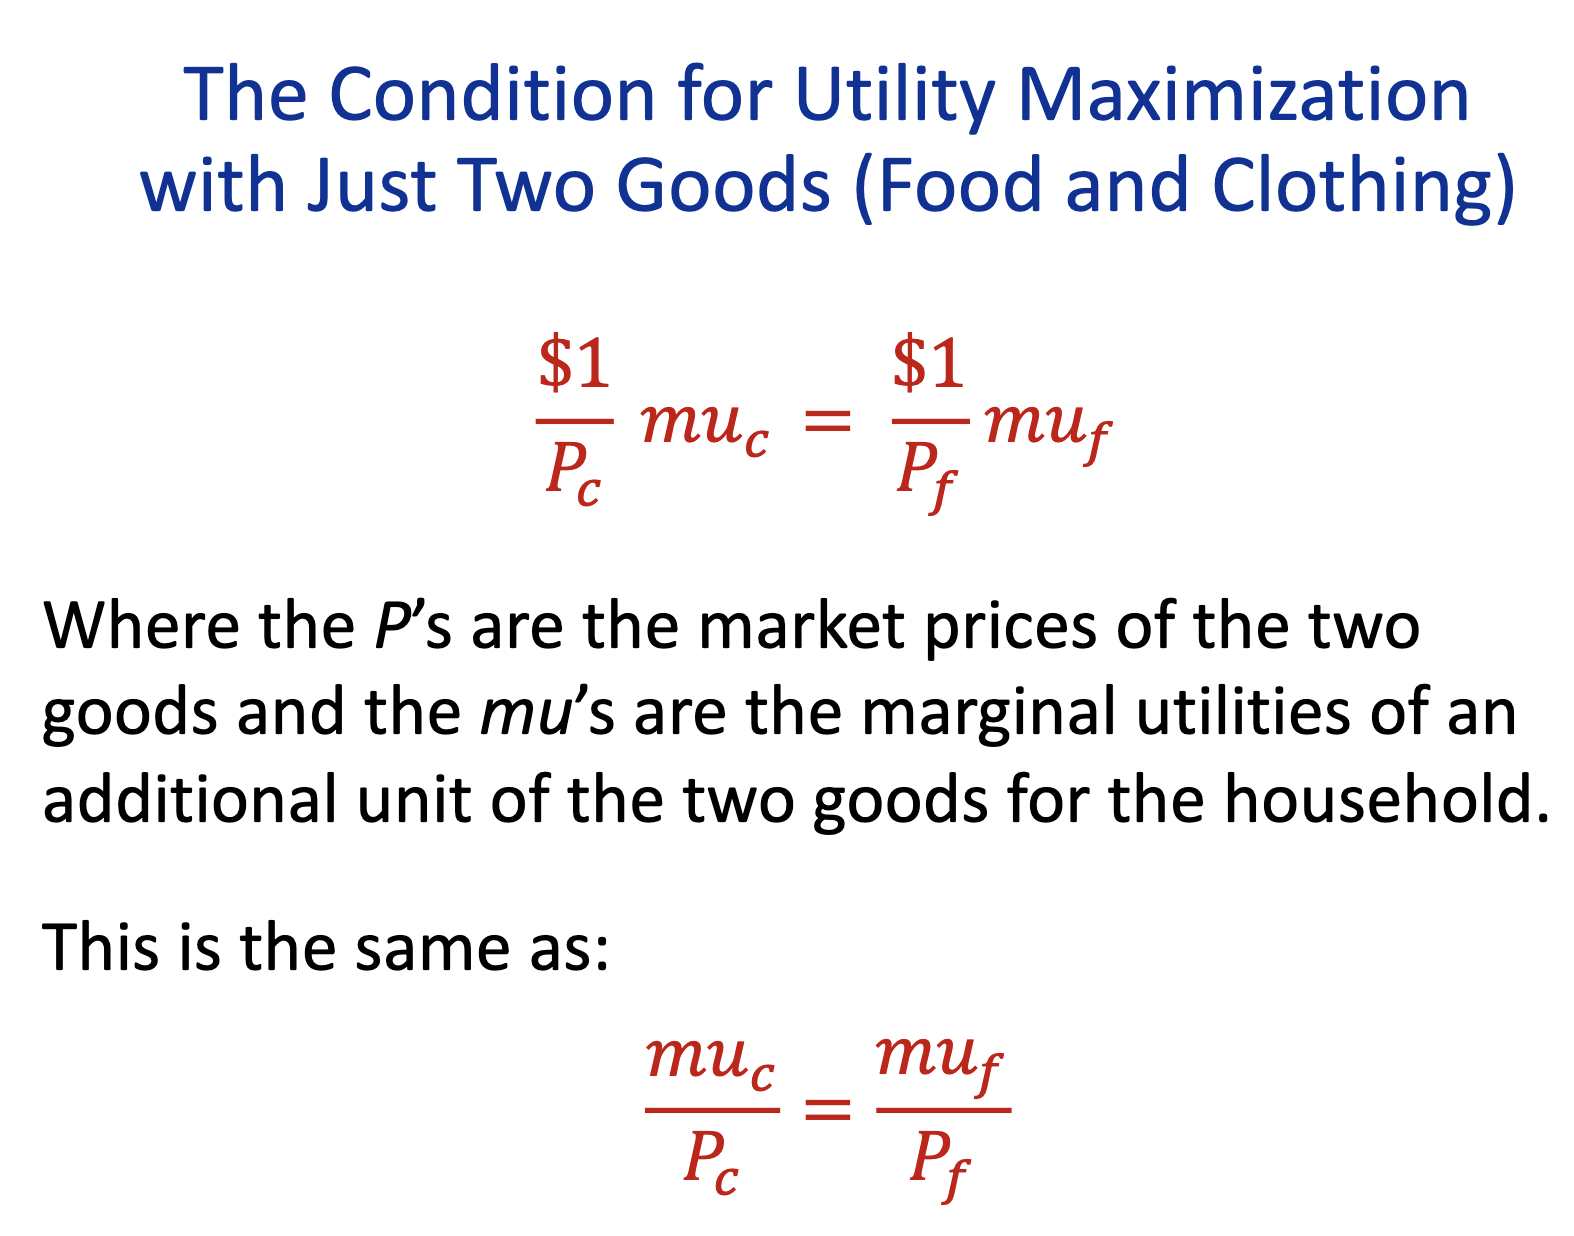
Utility Maximization Condition with just two goods =
Substitution Effect
A decrease in sales for a product bc consumers switch to cheaper alternatives when its price rises.
Income Effect
A decrease in sales when a good’s price rises. If price increases, I won’=Utilitarian
Libertarian
A kind of politics that says the government should have less control over people's lives. I
Utilitarian
For example, if you are choosing ice cream for yourself, the utilitarian view is that you should choose the flavor that will give you the most pleasure
How to find the total revenue (equation)?
Quantity sold * Price
Equation for average total cost:
Total cost/Quantity
How to find the total cost?
Opportunity cost of all inputs
What is the equation for Economic Profit?
Total Revenue - Total Cost = Profit
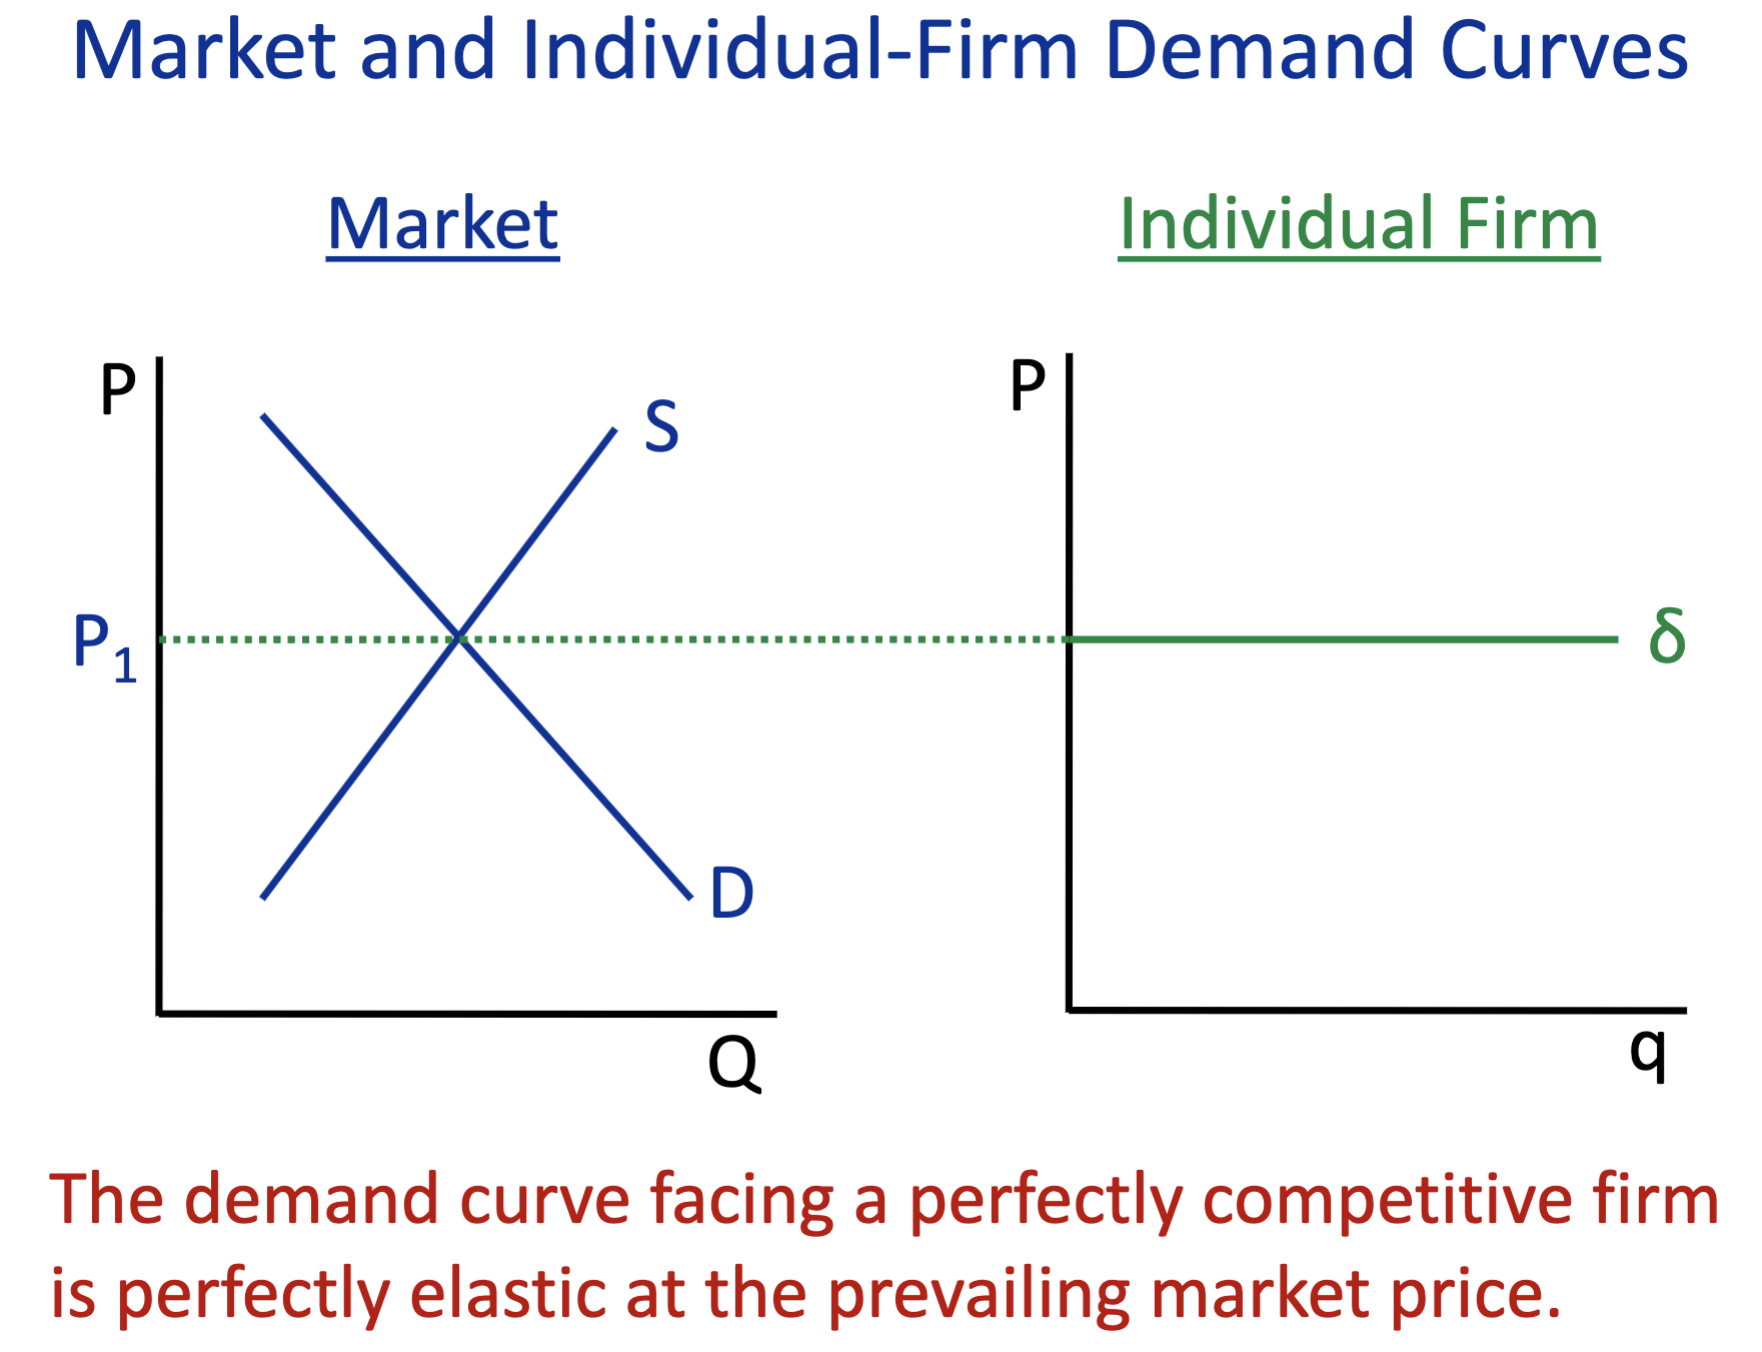
Draw a regular demand market then draw a individual firm demand market
Fixed Cost means
costs that are based on time rather than the quantity produced or sold by your business. ex. rent or bills
Variable Cost means
costs that change as the volume changes. ex. delivery cots, or credit card fees.
Total cost means
The sum of fixed and variable costs
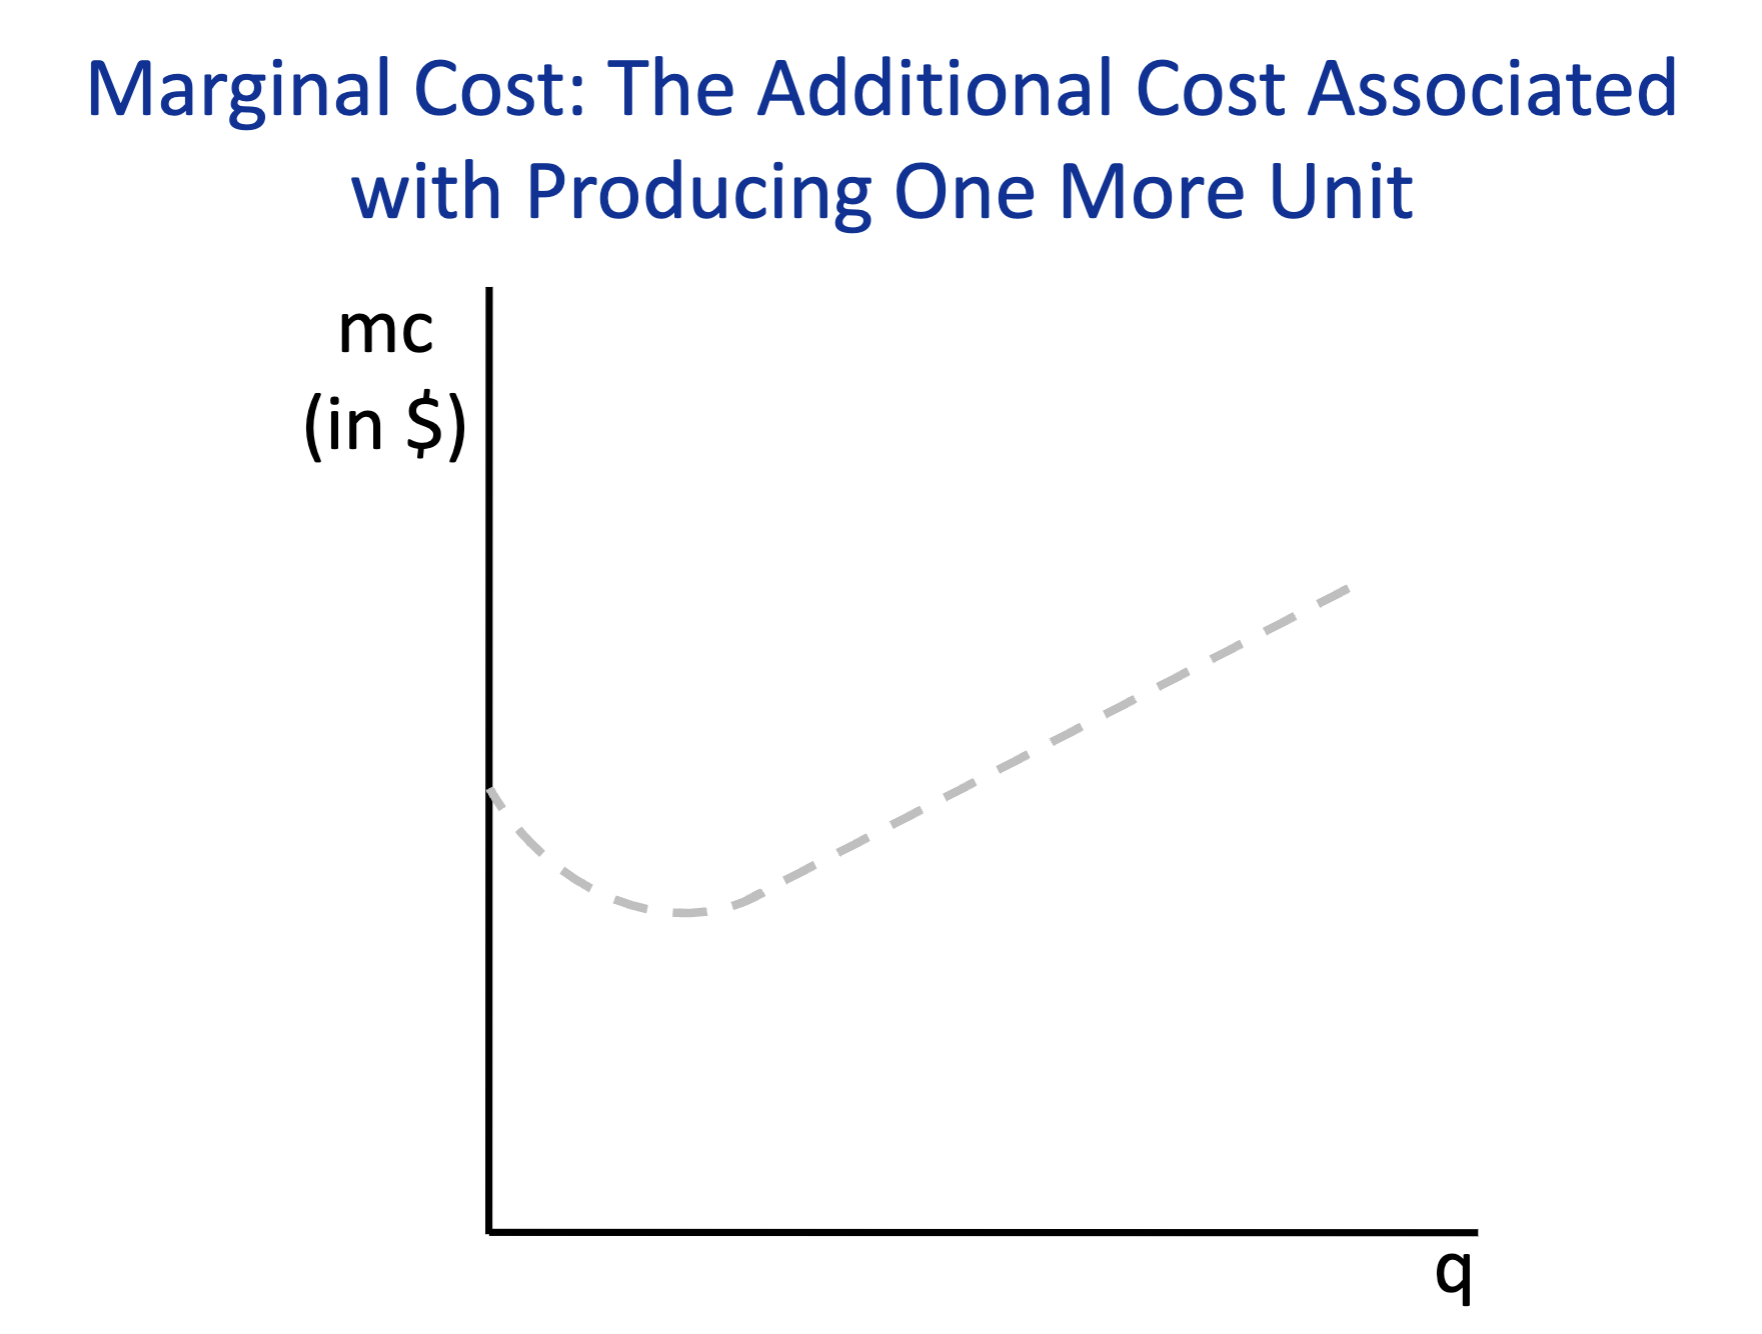
Marginal Cost
The change in total costs from producing one more unit.
Draw a line on how a marginal cost looks like on a graph?
In a perfect competitive firm, Price =
marginal cost/marginal renvenue
Draw a regular supply market then draw a individual firm supply market
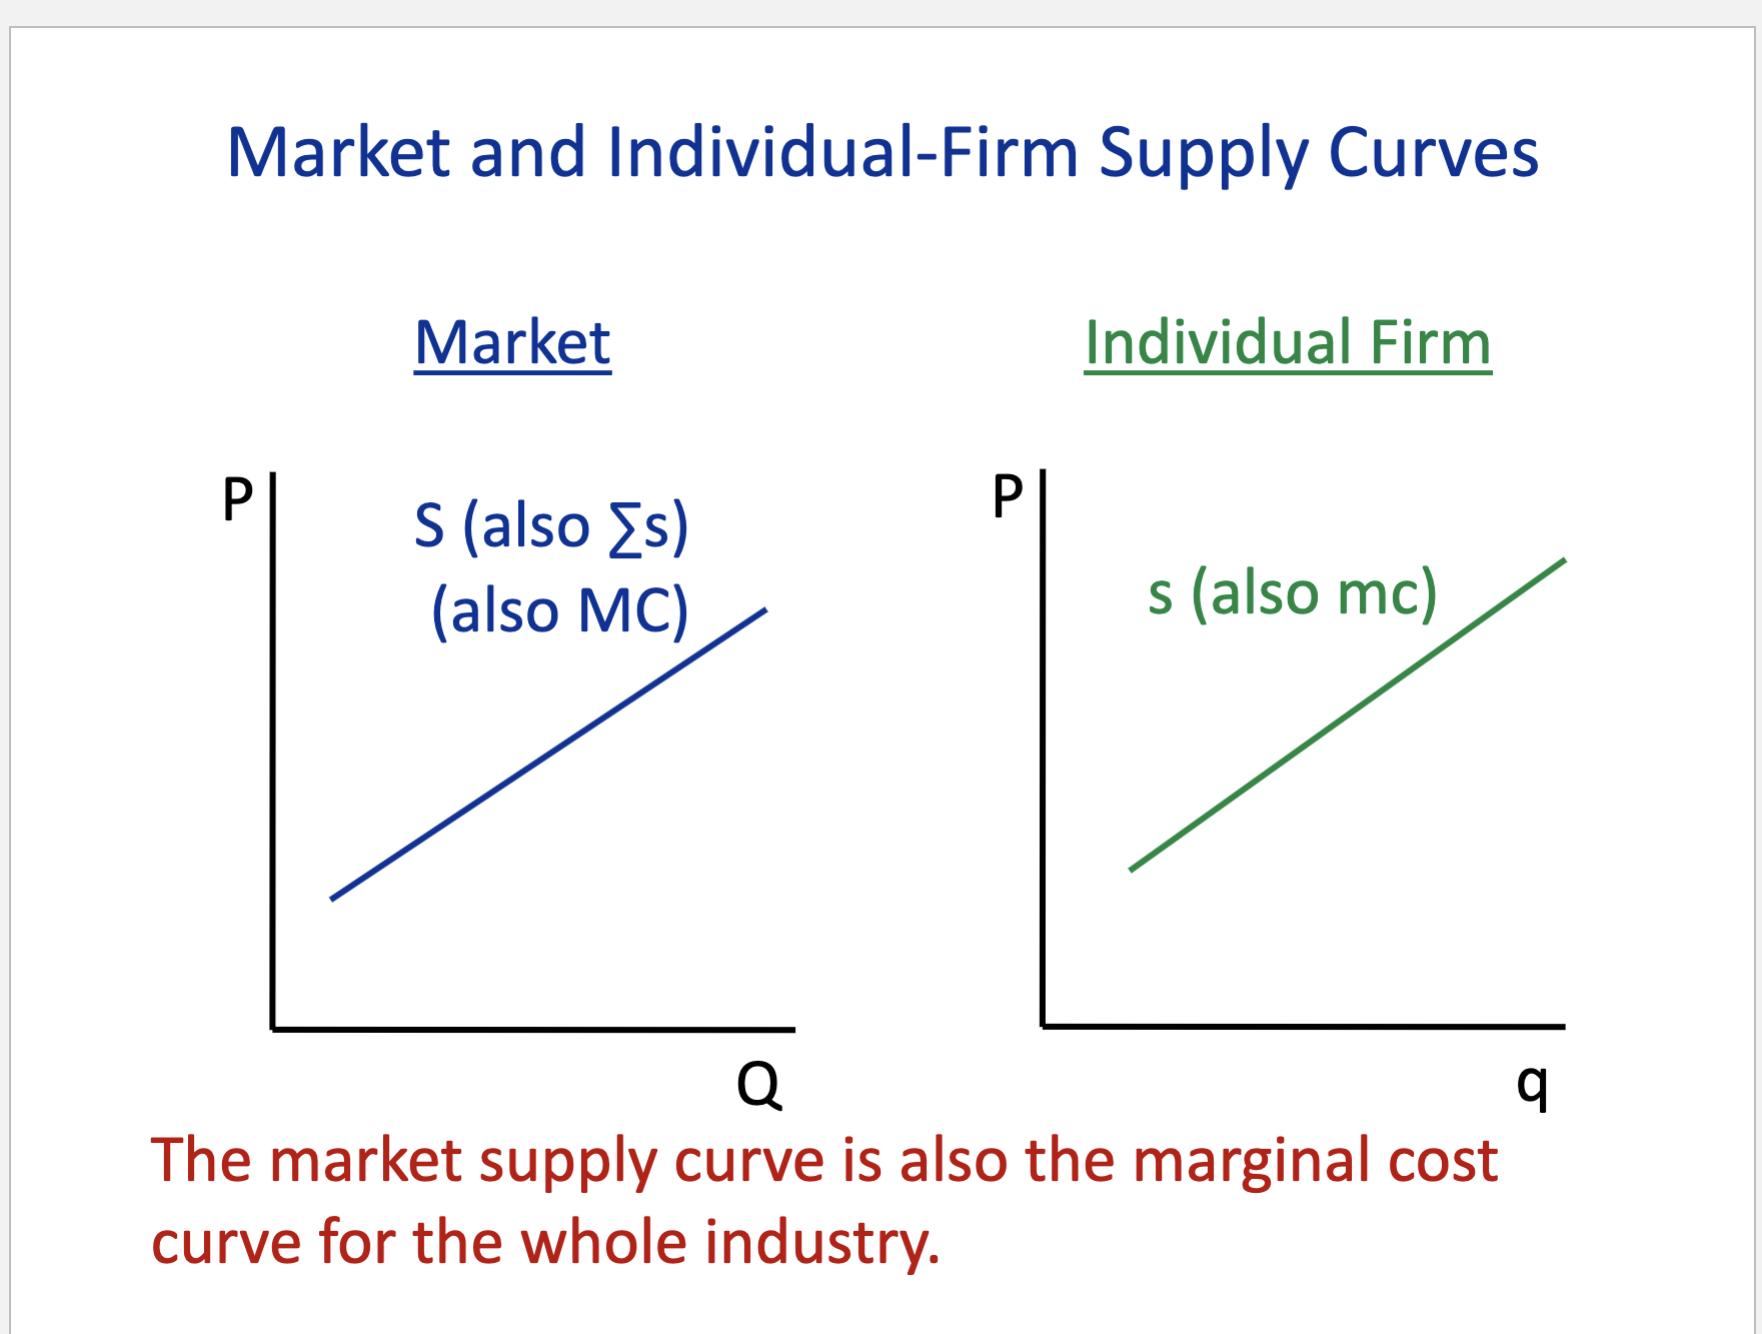
The horizontal sum of individual firms’ supply curves =
Market supply curve
The Industry Supply Curve =
Industry Marginal Cost Curve
Monopoly
when there is only one supplier for a good with no close substitutes → they can set the price and normally yield the largest possible profit. but the demand can fall because of this price point. ex. mircosoft and windows
Natural Monopoly
Only one most effective firm whose supply meets the demand efficiently in the entire market. able to produce at ar (Watch ACDC econ)
Monopoly equation