Disease frequency
1/12
There's no tags or description
Looks like no tags are added yet.
Name | Mastery | Learn | Test | Matching | Spaced |
|---|
No study sessions yet.
13 Terms
Measure of disease frequency
Incidence rate: determines number of new cases of disease
USEFUL FOR HEALTHCARE PLANNING
Need to consider disease relapse and if people are undiagnosed and population instability

Denominator population
people at risk of getting the disease
Comparing rates
Can be misleading to compare rates between calender years if population structure changes can over come with
Standardisation
Comparing by categories e.g age
Stratify: seperate into groups
Prevalence
Focus on disease status depends on disease incidence and duration
Point prevalence: specific point in time
Period prevalence: at mid point of the period
adjust denominator subtracting people that die or leave
between 0-1

risk
Risk can be expressed as probability of outcome / hazard of outcome / incidence of outcome
How can we measure effect
Comparing by absolute measures and relative measure e.g. ratio
Calculating absolute risk
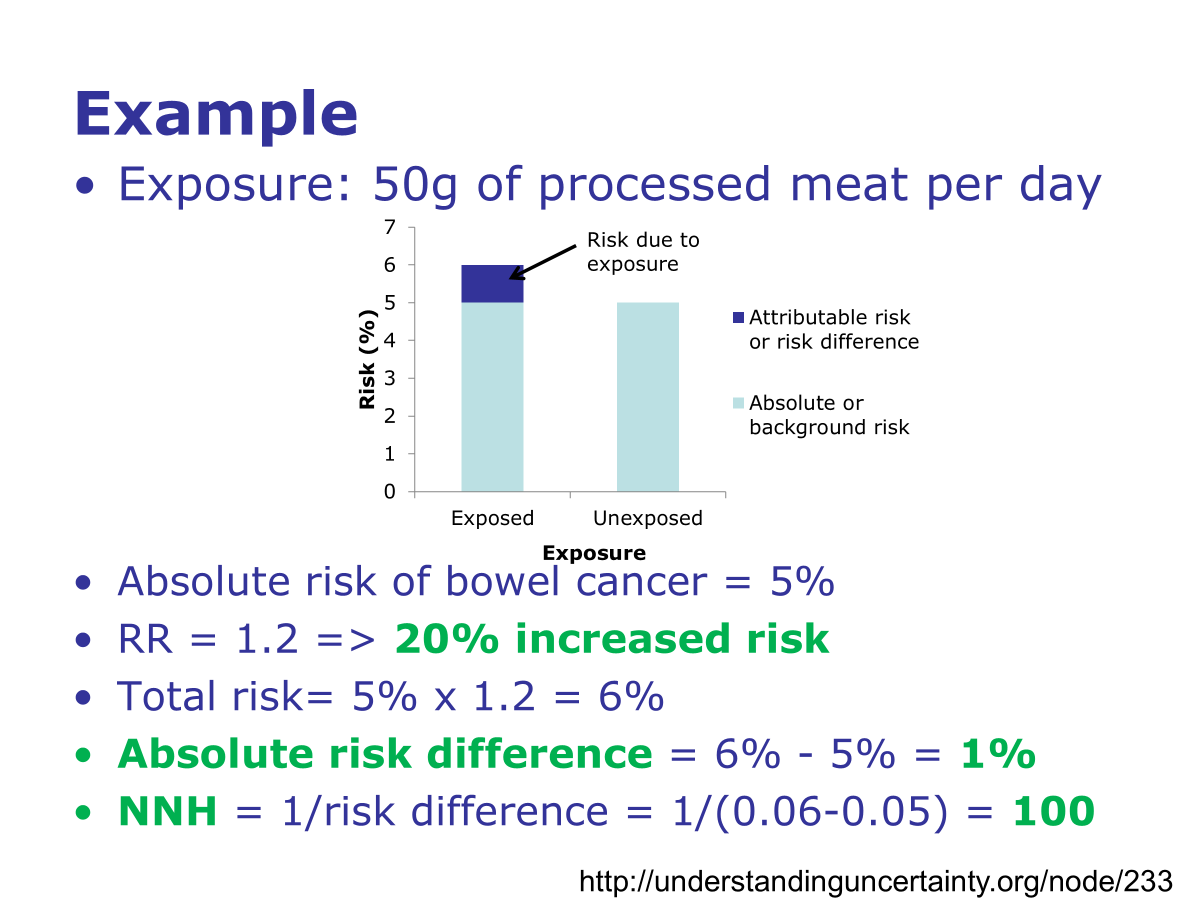
People not eating processed meat already have 5% risk, unexposed
Exposed people risk increases by 20% (1.2) risk ratio
Risk ratio

gives number as a percentage e.g. 4%
Attributable risk
gives the risk in a given population e.g. 150 out of 1000
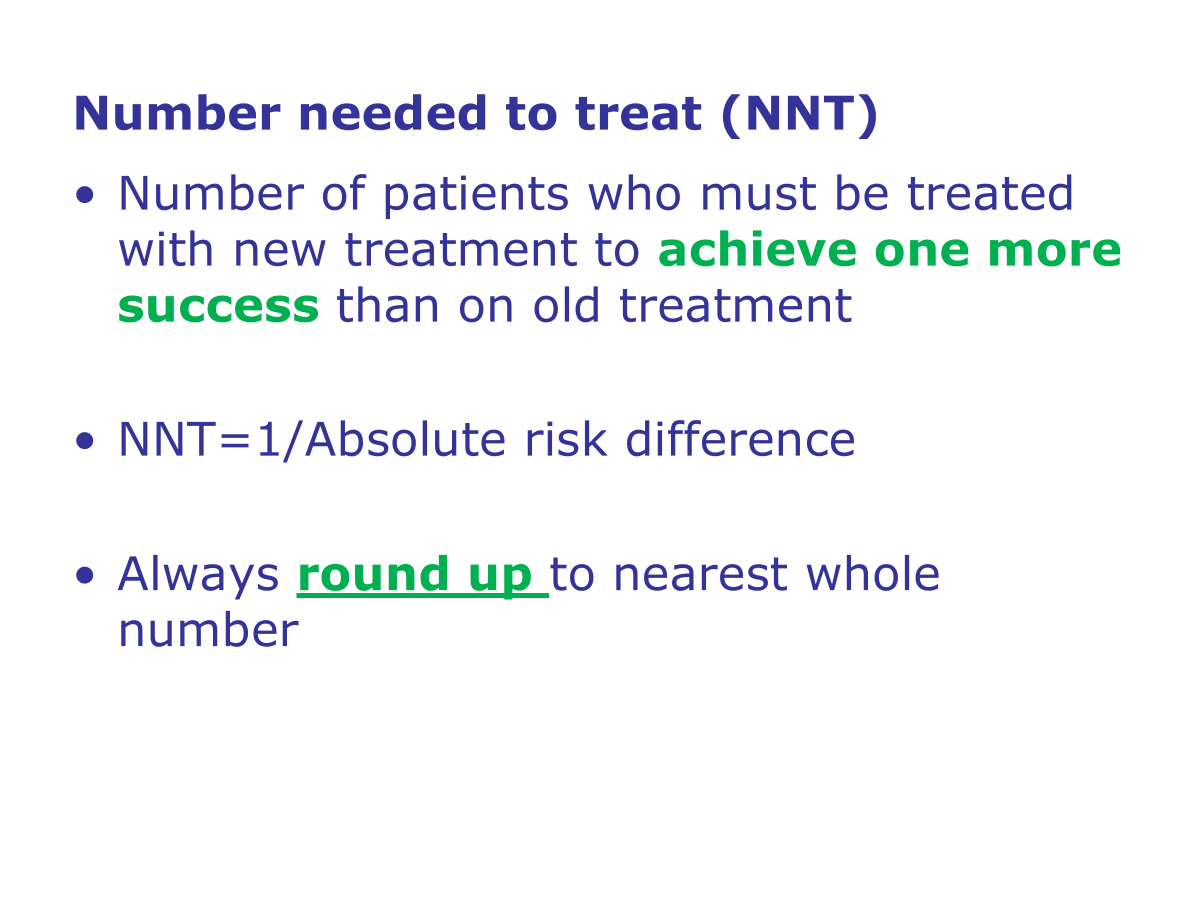
Number needed to treat
Can indicate ineffective treatment
Number needed to harm
Number of people when treated has harmful outcome. Assesses adverse impacts of a treatment.
•NNH=1/Absolute risk difference
•Always round down to nearest whole number
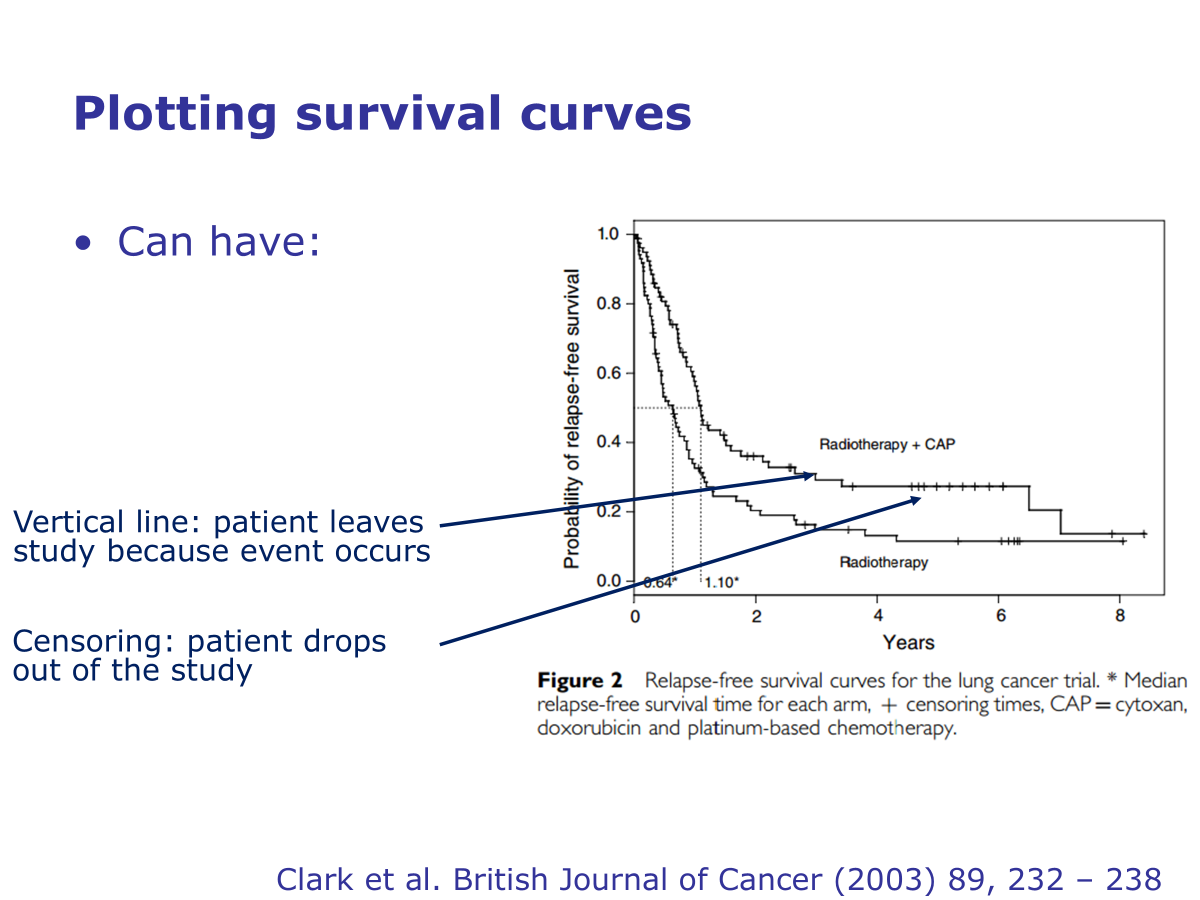
Survival curves
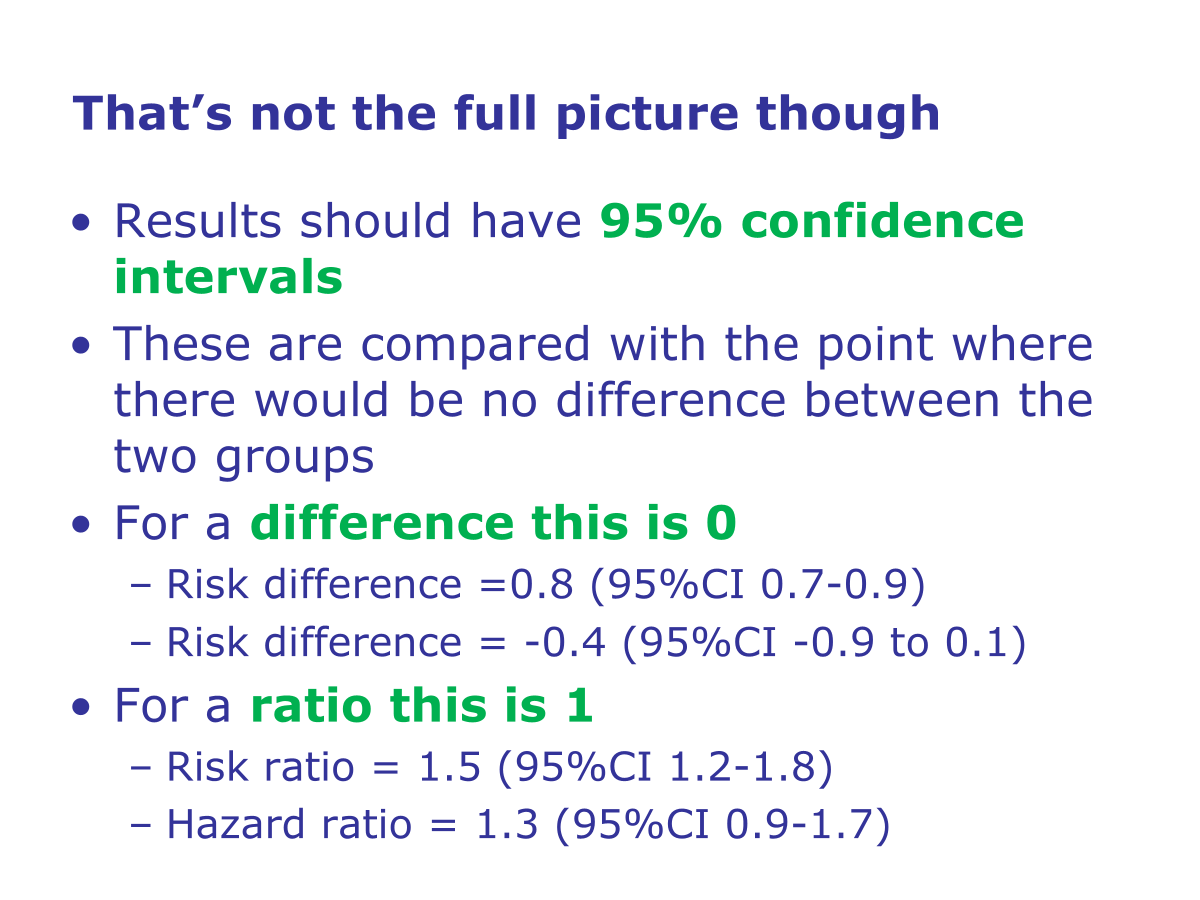
95% confidence intervals