Chapter 6 - Statistical Inference & Generalizations
1/30
There's no tags or description
Looks like no tags are added yet.
Name | Mastery | Learn | Test | Matching | Spaced | Call with Kai |
|---|
No analytics yet
Send a link to your students to track their progress
31 Terms
Statistical inference (Inductive)
The process of using specific examples or observations to make general conclusions.
Basically a way of using information from a smaller group (called a sample) to make a guess or conclusion about a larger group (called a population).
Imagine you’re looking at the test scores of 10 students in a class. You could use those 10 scores to make conclusions about how the whole class might perform (that's statistical inference).
Statistical Generalization (Inductive)
Sample - population.
Features found in a sample (or individuals) as a premise and draws a conclusion about the features of a population. Making a guess about a big group of things based on what you see in a smaller group.
A poll surveys 1,000 people about who they'll vote for:
40% plan to vote for Candidate A
35% for Candidate B
25% for Candidate C
Based on this sample, they predict that the voting preferences of the entire population will be similar (40% for A, 35% for B, 25% for C).
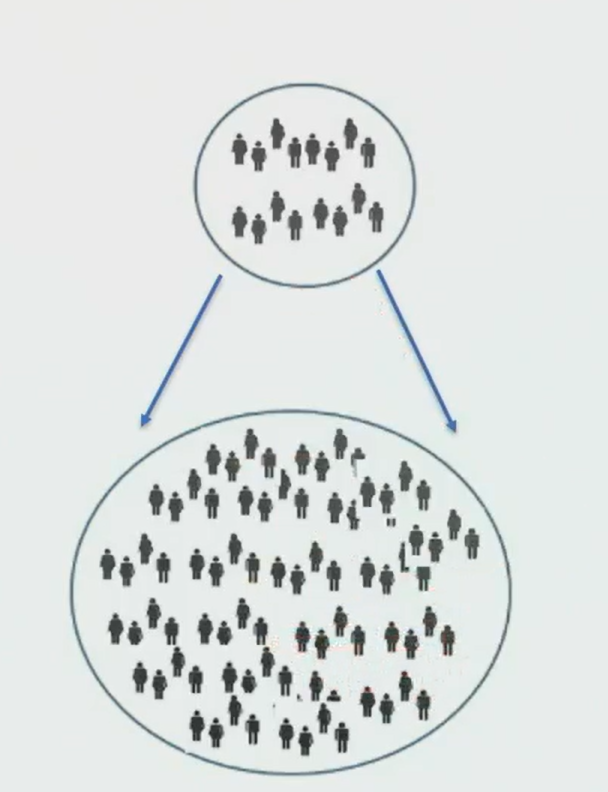
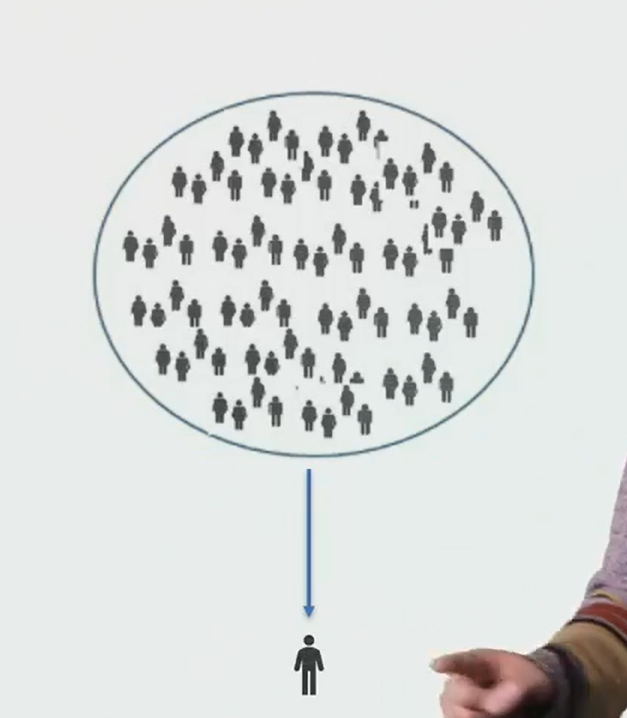
Statistical Instantiation (Inductive)
Population - sample.
Uses features about a population as a premise and draws a conclusion about a sample (or individual) within that population. Moves inward from a fact about the larger group to draw a conclusion about a sample.
If you know something about a big group, you can use that information to make an educated guess about a smaller part of that group.
You notice that 80% of employees who worked overtime met their performance goals.
8 out of 10 overtime workers met their goals. You predict that the next employee who works overtime is likely to meet their goals too.
Strength Test (2)
The probability that the E would support the H if it were true.
The probability that the E would would support the H if it were false
Sampling Bias (Selection Effect)
Occurs when the individuals or units selected for a sample are not representative of the larger population you're trying to study. This leads to inaccurate or skewed results because the sample doesn't reflect the true diversity or characteristics of the entire population.
A restaurant surveys only lunchtime customers about their menu, but these customers are mostly office workers.
The Law of Large Numbers
The larger our sample, the more likely it is that its proportions closely resemble those of the population as a whole.
This is why we want a specifically large sample size. As we increase our sample size our confidence in our evidence increases.
Two Major Problems to Avoid with Statistical Generalization
Selection effects
Small sample size
These two issues share the same issues related to making it too likely that we would have made this observation even if our hypothesis was false.
Margin of Error
How much we can expect the results of a survey or poll to vary from the true result. Reflects the uncertainty or potential error in the results due to sampling.
For example, if you ask 100 people about their favorite ice cream flavor and 60% say chocolate, your margin of error tells you how much the real percentage of chocolate lovers could vary if you asked everyone.
Accounts for the inherent uncertainty in any survey or poll due to the fact that only a sample is being surveyed, not the entire population
Stratifying Random Sampling
A method where you divide the population into smaller groups based on important characteristics (like age or gender). Then, you randomly select people from each group in proportion to how big those groups are in the overall population. This helps make sure your sample accurately reflects the whole population.
Ensure that every group that matters to your study is proportionally represented.
Randomness (Randomize)
Means to make something random or to introduce randomness into a process. In simple terms, it means to mix things up so that there is no predictable pattern.
Every individual in the population has an equal chance of being selected for the sample, without any bias or predetermined pattern.
Stratification supplements but does not substitute for randomness.
But random sampling is a fair approach, it might under-represent or over-represent certain groups, especially if there are large differences between them (e.g., certain age groups, income groups, or geographic areas).
Participation biases
A selection effect arising from differences in the target population with regard to willingness to participate in a survey. Those who choose to respond might be importantly different from those who choose not to respond.
For example, those with strong opinions and who are less busy are more likely to take part in a survey than those who lack strong opinions or who are busier.
A sample may fail to be representative even if the initial selection of potential participants was perfectly random.
Response Bias (Selection Effect)
Happens when people answer survey questions in a way that doesn't reflect their true thoughts or feelings. This can happen because they think there’s a certain answer expected, or they’re worried about what others will think of their response.
Summary statistics
The practice of summarizing and reporting statistical data. This involves making decisions about what the most important facts are, and how best to present them. Ask questions such as:
what features of the data are most important to us?
what's the clearest way to present those features?
Central Tendency (& Different Ways to Measure)
A way to find a single value that represents the "typical" or "average" point in a set of data. It helps summarize a bunch of numbers by showing us where most of the values are centered.
There are different ways to measure central tendency, like:
Mean (average): Add up all the numbers and divide by how many numbers there are.
Median: The middle number when the data is sorted from lowest to highest.
Mode: The number that appears the most.
Geometric mean: A type of average that multiplies all the numbers together and then takes the root.
Truncated mean: Similar to the mean but ignores some extreme values at the ends.
The choice of which one to use depends on the data and what you want to measure. To provide a sense of what value the trait has for a typical individual.
Outlier
An observation that is very distant from a dataset’s central tendency, conventionally three standard deviations.
When we say that an outlier is "three standard deviations away," it means that this number is so far from the average (mean) that it’s very unlikely to happen in a typical set of data. In other words, it's far enough away from the rest of the data that it stands out as unusual or extreme

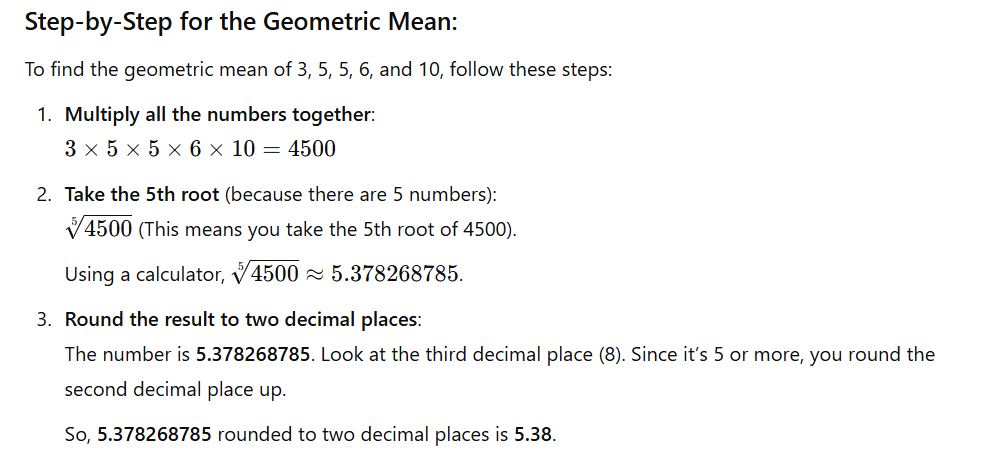
Geometric mean
A way to find the average of a set of numbers, but it’s different from the regular average (mean). Multipy all the numbers together and then take the root (like the square root, cube root, etc.) based on how many numbers you have.
It’s often used when you want to find the average of things like growth rates or percent changes over time. For example, if something grows by 10% in the first year and 20% in the second year, the geometric mean gives a better idea of the overall growth than a simple average would.
Standard Deviation
Measure of how spread out or different the numbers in a set of data are from the average (mean).
Here’s a simple way to think about it:
If the standard deviation is low, it means the numbers are close to the average (they’re similar).
If the standard deviation is high, it means the numbers are spread out more widely (they’re different from the average).
Truncated
Refers to when you remove or ignore the extreme values (either the highest or lowest) from a set of data.
For example, if you're looking at people's incomes, you might truncate the data by removing the very highest and lowest incomes because they might be extreme outliers.
You can do this when it is deemed unnecessary for the analysis or data.
Cherry Picking Data
When someone selects only the pieces of data that support their argument or point of view, while ignoring data that might contradict it.
Loose Generalization
When we associate one kind of thing or person with an attribute but we are unclear what proportions we take to be involved.
For example, we might believe that Canadians are polite without having much sense of what this means, statistically speaking.
Loose generalizations can be expressed using bare plurals or with "many" as in "Many Canadians are polite".
Representativeness Heuristic
A mental shortcut we use when we're trying to figure out how likely something is based on how well it seems to match our mental picture or stereotype of that thing.
Instead of looking at actual statistics or evidence, we rely on our gut feeling or mental association between two things.
You meet a person who loves reading and is very quiet. Based on this, you assume they are a librarian, because they fit the stereotype of someone who enjoys books and is introverted.
Base Rate
Refers to how common something is in a larger group or population. The general prevalence or frequency of an event or characteristic within a particular population or context.
A disease affects 1% of the population, and a test is 90% accurate.
If you test positive, you might think you have the disease. But because the disease is so rare (1%), the base rate means the likelihood you actually have it is still low, despite the positive result.
The base rate is the overall probability of something happening (like having a disease), and it’s important to consider it when interpreting specific data, like test results.
Confidence interval
Helps us understand the uncertainty or precision of an estimate. It provides a range of values within which we expect the true value of a population parameter (like a mean, proportion, or difference) to lie, with a certain level of confidence.
For example, if you wanted to know the average height of all people in a country, but you only measure a sample, a 95% confidence interval means you can be 95% sure that the true average height for everyone in the country falls within that range.
The size of this interval in either direction from the given value is called the margin of error.
Convenience Sample
A group of observations or data that is chosen in a quick and easy way, without much care or planning.
For example, you might survey the people who are closest to you, or the first 10 people who walk by, because it's the easiest way to get data.
Representative Sample
A small group that accurately reflects the larger group you're studying. It means that the people or things you select for the sample should have the same characteristics or variety as the larger population in a way that might affect the result you’re looking for.
For example, if you want to know how people in a country feel about a political issue, you need your sample to have the same balance of Democrats, Republicans, and other groups that exist in the country. This way, the sample is a mini version of the whole population.
Steps to Find Geometric Mean
Multiply all the numbers together.
For example, if your numbers are 2, 4, and 8, you would multiply them: 2 × 4 × 8 = 64.
Take the root of the result based on how many numbers you have.
If you have 3 numbers, take the cube root (because 3 is the number of values).
If you have 4 numbers, take the 4th root, and so on.
For 3 numbers, the cube root of 64 is about 4.
So the geometric mean of 2, 4, and 8 is 4.
In short:
Multiply all the numbers.
Take the root based on how many numbers you started with.
Median
The middle number in a set of data when the numbers are arranged in order (from smallest to largest).
Here’s how you find the median:
Arrange the numbers in order.
If there’s an odd number of numbers, the median is the middle one.
If there’s an even number of numbers, the median is the average of the two middle numbers.
For example:
If you have 3, 5, 7, the numbers are already in order, and the middle number is 5, so the median is 5.
If you have 2, 4, 6, 8, the middle numbers are 4 and 6, so the median is the average of these two: (4 + 6) ÷ 2 = 5.
Mode
The number that appears the most in a set of data.
For example:
If you have the numbers 2, 4, 4, 5, 7, the mode is 4 because it appears twice, more than any other number.
If all the numbers appear only once (like 2, 3, 5, 7), there is no mode.
Mean
What we usually call the average. It’s a way to find the typical value in a set of numbers.
Here’s how you find it:
Add up all the numbers in the set.
Divide the total by how many numbers there are.
For example:
If you have the numbers 3, 5, and 7:
Add them together: 3 + 5 + 7 = 15.
Divide by how many numbers there are (3 numbers): 15 ÷ 3 = 5.
So, the mean (average) of 3, 5, and 7 is 5.
Induction
Modes of reasoning that link facts / beliefs about observations with facts/beliefs about unobserved phenomena.
Lend probable cause to the conclusion.