LSU ISDS 2000 Test 1 Study Guide: David Whitchurch
1/91
There's no tags or description
Looks like no tags are added yet.
Name | Mastery | Learn | Test | Matching | Spaced | Call with Kai |
|---|
No analytics yet
Send a link to your students to track their progress
92 Terms
Statistics
a branch of applied mathematics which involves the collection, organization, analysis, interpretation, and presentation of data
The study of statistics consists of two branches
descriptive statistics and inferential statistics
Population
includes ALL observations for which conclusions are to be made. In many situations, it is either impossible or not practical to collect information from this, so the analyst will take a sample instead
Sample
a subset of the population
descriptive statistics
methods used to summarize your data so that you can explain the important characteristics
descriptive statistics examples
Examples include creating pie charts, histograms, or line graphs, calculating the mean, median, mode of home values by geographic region, reporting crime rates by types of crimes, unemployment rate over time, DJIA, the number of freshman entering LSU this past fall by academic major, etc.
inferential statistics
methods that use data from a sample to make conclusions and decisions about the population
inferential statistics example
According to the Centers for Disease Control, 'people who smoke cigarettes are 15 to 30 times more likely to get lung cancer or die from lung cancer than people who do not smoke.'
Parameter
a summary measure that describes a characteristic of an entire population
Statistic
a summary measure that describes a characteristic of a sample
Cross-sectional data
contains measurements of observations at one point in time (e.g., results from a survey taken on January 1, 2024)
Time series data
contains measurements of observations over multiple periods of time (e.g., results from a survey taken every year from 2019- 2024)
Structured data
data stored in spreadsheets or relational databases and have a pre-defined row-column format
Unstructured data
has no structure and does not follow a pre-defined format.
Examples of unstructured data include
email messages, blogs, customer comments, medical imaging, photos, videos, music clips
Big data
a collection of large, complex data sets, including structured and unstructured data, which cannot be analyzed using traditional database methods and tools
Variable
the characteristic of an observation that is apt to change or vary
Data
the values associated with each variable
Categorical Variables (also known as Qualitative variables)
have values that facilitate placing an observation into a specific category
Categorical Variables examples
Examples: gender, political affiliation, city of birth, whether a product is defective (yes or no), product quality (superior, good, fair, poor)
Numerical Variables (also known as Quantitative Variables)
have values that represent quantities and are the result of a measuring process
Numerical Variables Examples
salary, revenue, expenses, return on investment, amount spent, number of items purchased, salary, return on investment, GPA, number of children
Subtypes of numerical variables include
Discrete and Continuous
Discrete
result of counting
continous
measurements can take on infinitely many values within an interval
Variables are also identified by their
scales or levels of measure
The four scales of measures
Nominal, Ordinal, Interval, Ratio
a categorical variable has a nominal scale if
its values allow us only to categorize observations into mutually exclusive groups
Nominal examples
gender, academic major, race, state of birth, commute to campus or not, etc.
a categorical variable has an ordinal scale if
its values allow us to both categorize and rank the observations according to some quantity or trait
Ordinal examples
grade in your class (A, B, C, D, or F), customer rating when purchasing a product (Excellent, Good, Fair, Poor), Skip Class (Never, Very Rarely, Somewhat Often, Very Often), Salary (Low, Middle, High), etc
a numeric variable has an interval scale if
its values allow us to both categorize and rank observations, and, in addition, the differences in values have a consistent meaning
Interval examples
Temperature in Fahrenheit or Celsius. Ninety degrees is hotter than 80 degrees, and a 10-degree difference has the same meaning across its entire range. (i.e.: equivalent to the difference between 30 degrees and 20 degrees)
a numeric variable has a ratio scale if
it has all characteristics of an interval-scaled variable and has a true zero point
Ratio examples
example: salary
Variables having nominal and ordinal scales of measurement are always
categorical
Variables having interval and ratio scales are always
numerical
Frequency Table
a tabular summary of a data showing the frequency (or percent) of items in each of the distinct categories represented by the categorical.
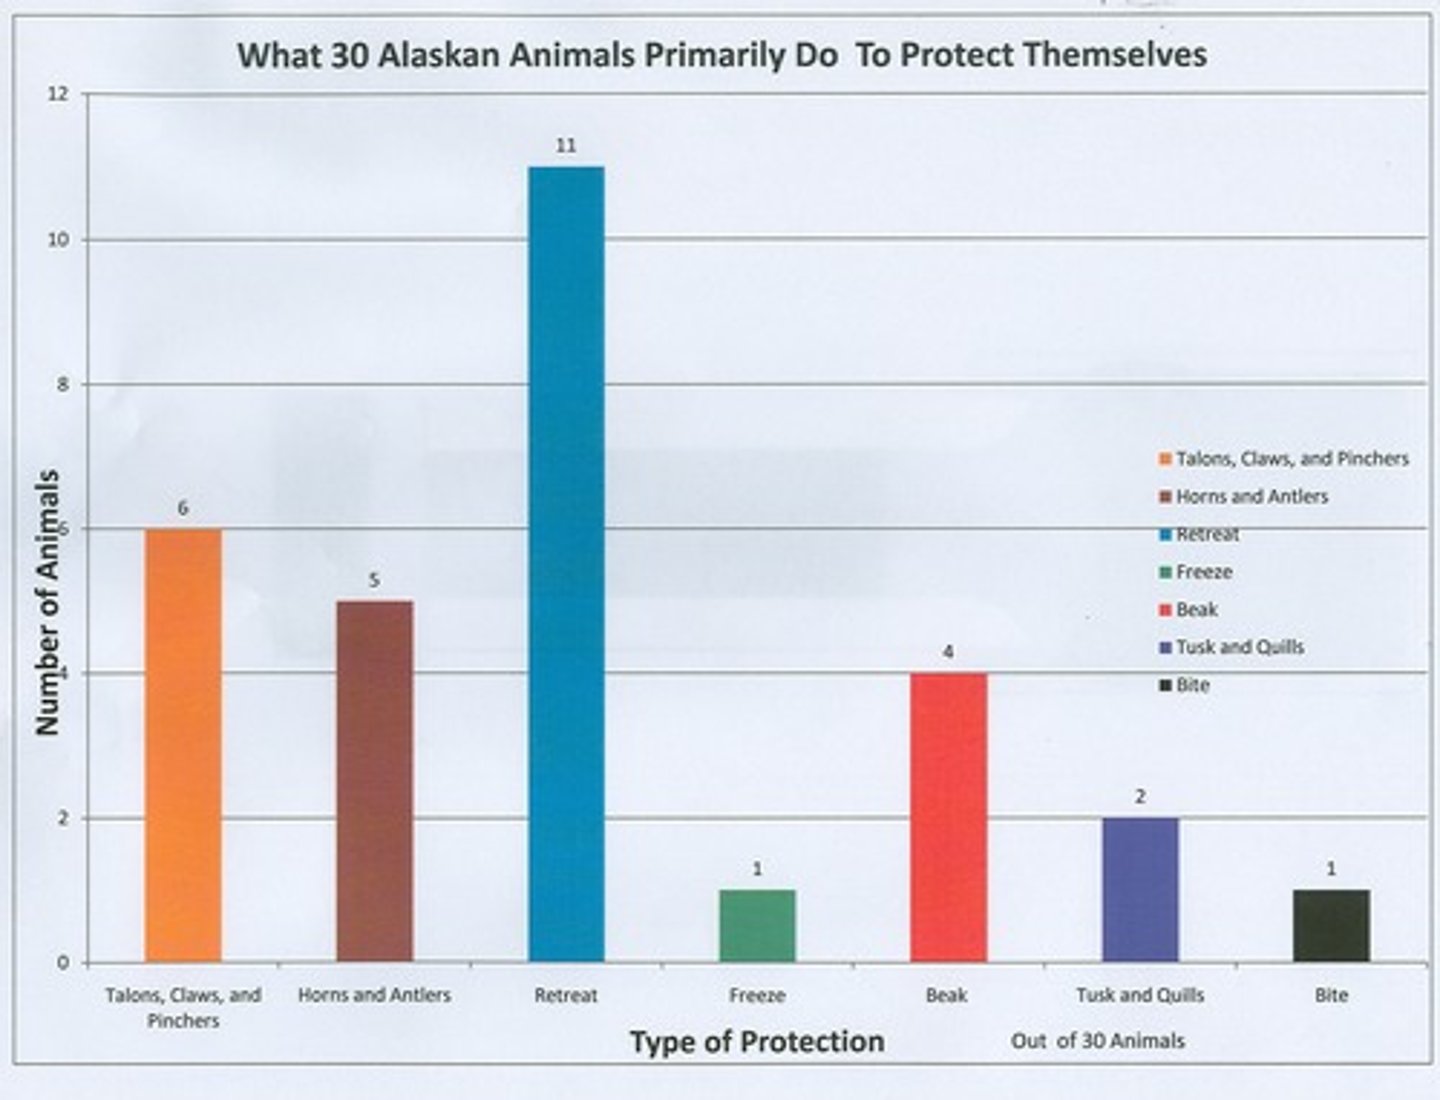
Bar Graph
a graphical display of data where each category is depicted by a unique bar with the height of the bar representing the frequency, or proportion, of observations in that category
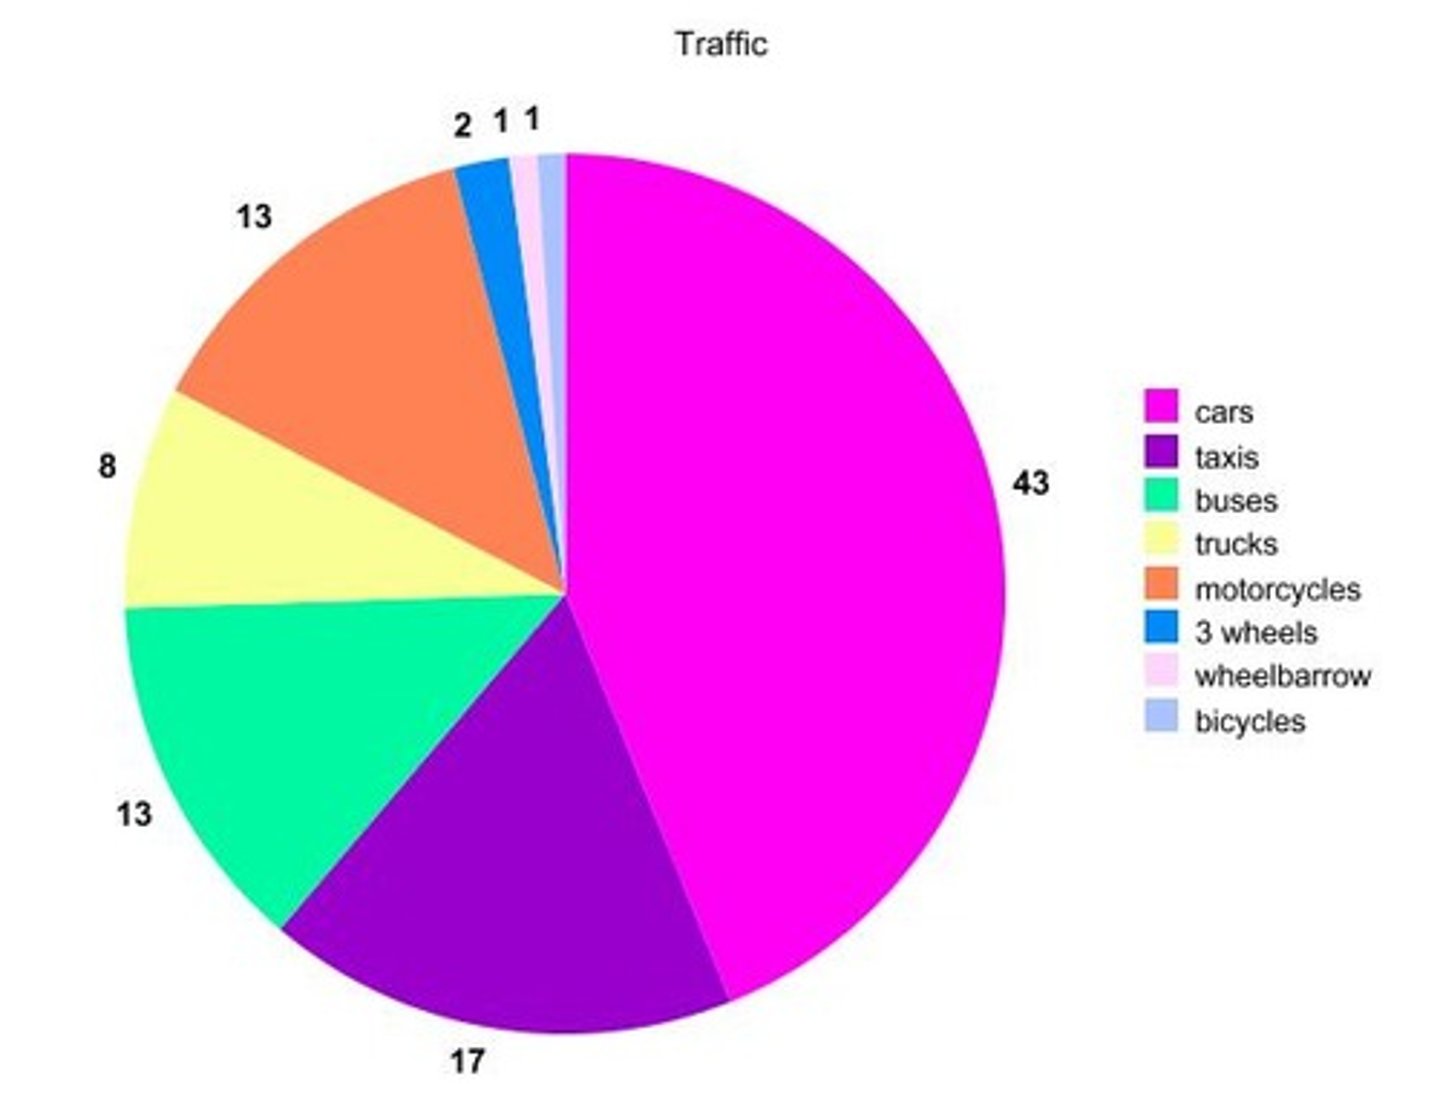
Pie Chart
a graphical display of data where each category is depicted by a unique slice of the pie, in degrees, which represents the frequency, or proportion,
of observations in that category
The number of categories usually ranges from ___________, depending upon the data
set size
5 to 20
Larger data sets require _________ categories, whereas smaller data sets require ________ categories; # of classes = # of bars in the histogram.
more, less
The categories are _____________ so that they do not overlap, and each observation is placed in only one category
mutually exclusive
The categories are exhaustive in that they all cover the....
entire range of data
The endpoints and width of the categories are.....
(note that the width is the same across all categories)
easy to interpret
Steps to Construct a Frequency Table for a Numerical Variable
1. Determine the range of the data from an ordered array
2. Specify the number of categories and calculate the WIDTH of each category
3. Determine the limits, or interval, that make up each category
4. Using the ordered array, count and record the number of observations
Width =
Max - min / # of categories
When creating a frequency table, the original observations are lost in the grouping process, but you gain...
the power of interpretation that you don't have with the original list of raw numbers
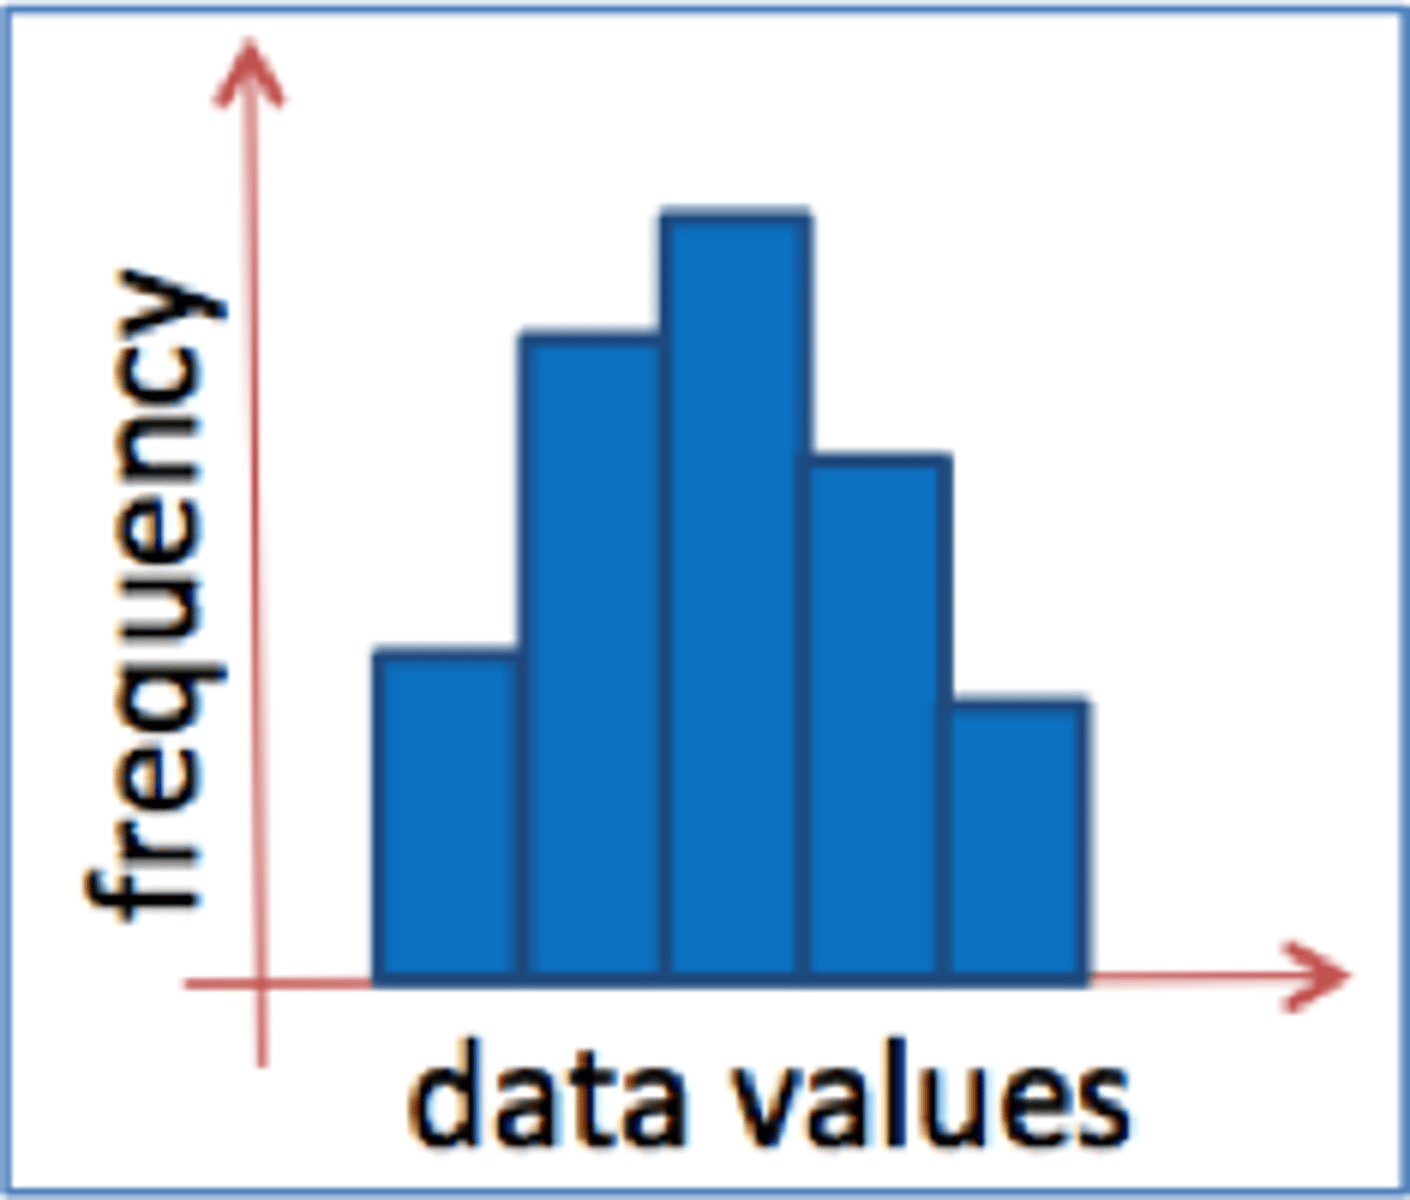
Histogram
a visual representation of numerical data where the horizontal axis represents the values of the variable of interest and the vertical axis (or the height of the bars) represents the frequencies or relative frequencies in each of the category.
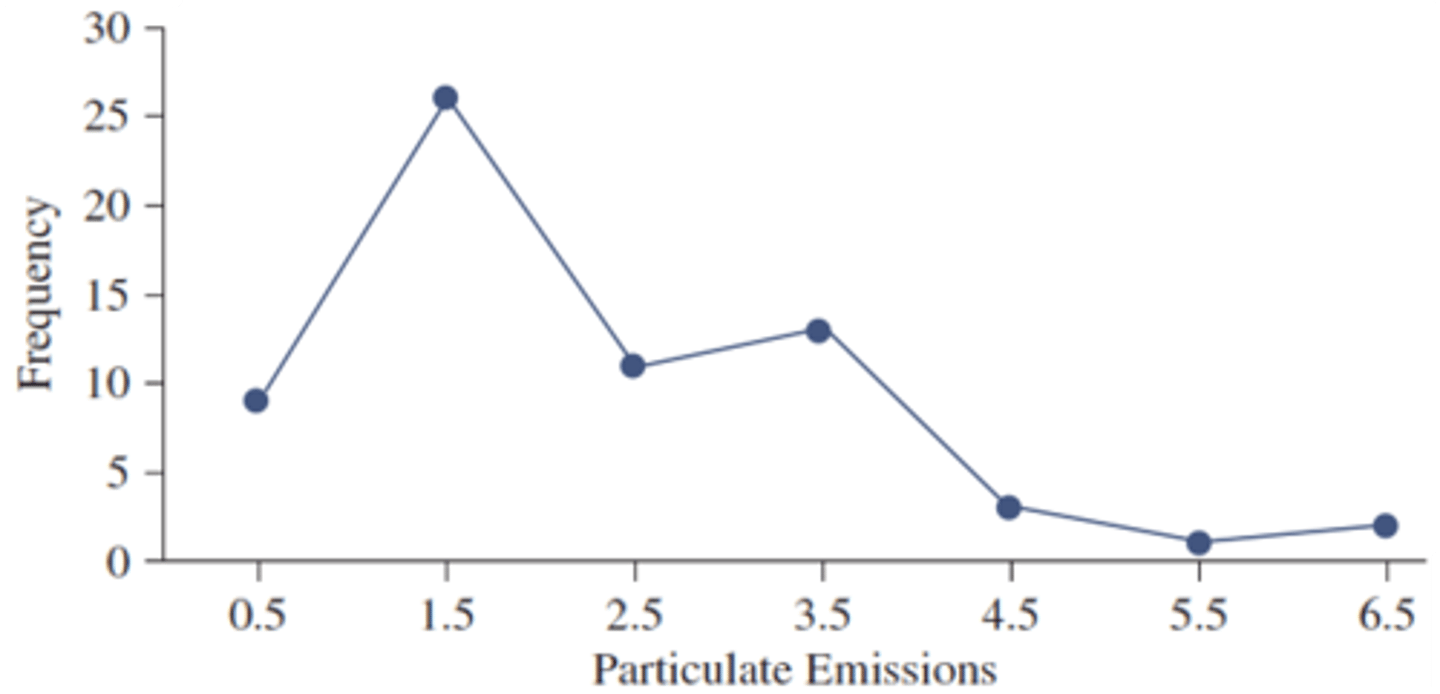
Frequency Polygon
alternative to histogram, formed by connecting the midpoints at the top bar of each category, then anchoring on the x-axis on each side, maintaining the same width
If you have too many categories, where the frequencies in each category are low, your resulting histogram may suffer from the...
pancake effect (a histogram that is too wide and flat)
If you have too few categories, the frequencies will 'pile up' in those categories, and you may see the ______________ _______________ within your histogram results
skyscraper effect (a histogram that is tall and narrow)
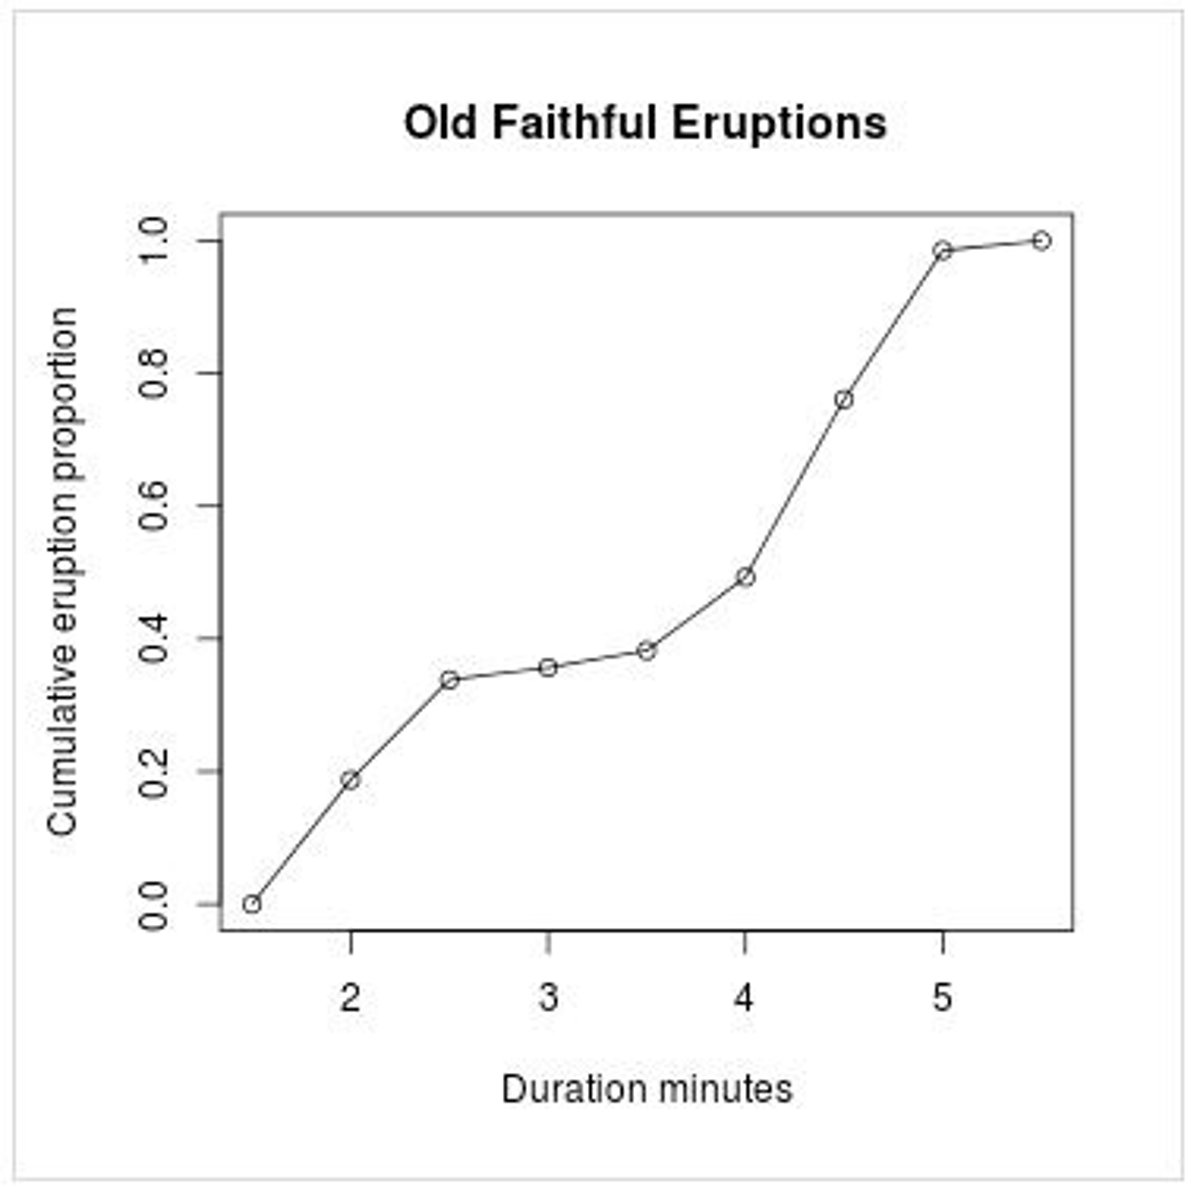
Ogive
a graphical representation of cumulative values (either cumulative frequencies or cumulative relative frequencies), where the X-coordinates represent the upper limit of each category, and the Y-coordinates represent the cumulative values in the corresponding category
A Stem-and-Leaf Diagram
separates data into leaves, each made up of the right most single digit of each number, and the stems, made up of the leftmost remaining digits of each number after the leaf has been lopped off

Four attributes of steam and leaf diagram
1. is most effective for relatively small data sets
2. can be used to determine minimum, maximum, range, mode, and shape
3. gives an idea of how the individual values are distributed across the range of the data
4. retains all the original data so that each observation remains distinctly identifiable
The numeric indices describe three major properties of numeric data:
1. Center
2. Variation (Dispersion or Spread)
3. Shape
Measures of Center
are used to describe a typical value, the center, and where data seem to cluster.
There are three types: (1) mean, (2) median, and (3) mode
When describing the histogram, the _______ is the balance point of histogram.
It is calculated by adding all the observations and dividing the sum by the total number of observations in the data set.
mean
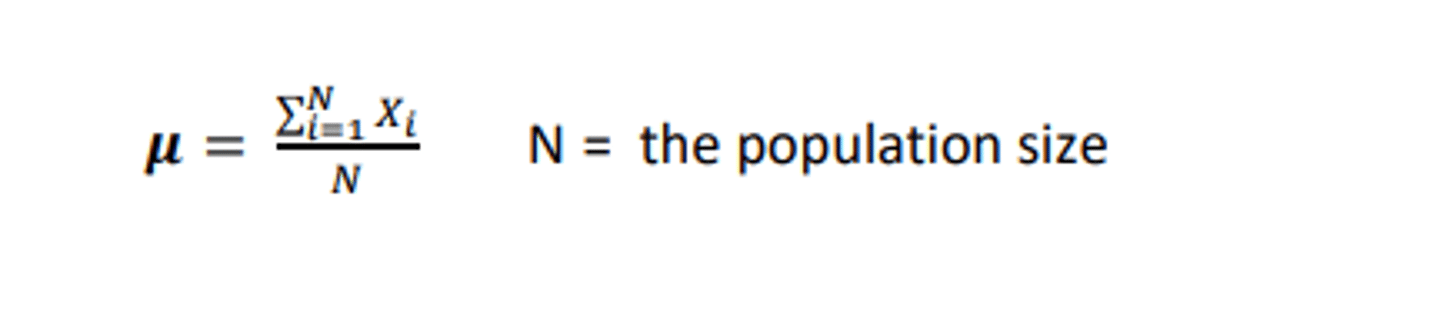
Population mean, denoted by µ, is calculated using:
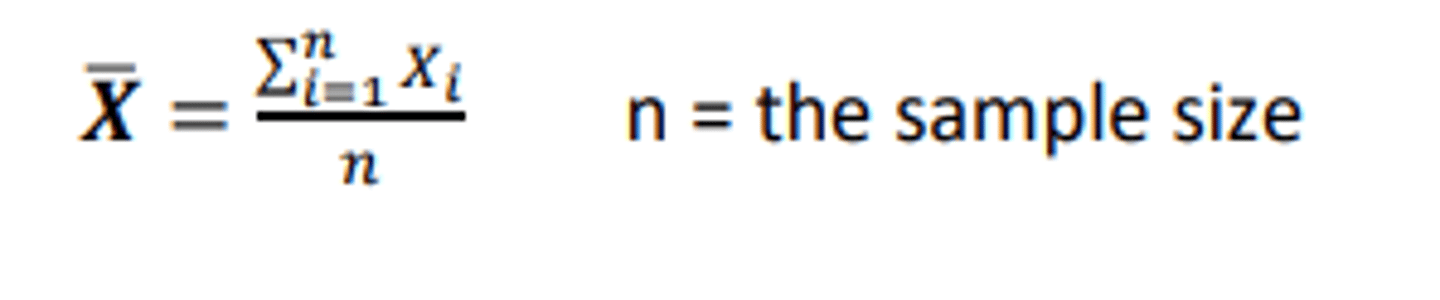
Sample mean is calculated using:
median
the point, in an ordered array, at which half the data lie above and half the lie below.
the median is calculated:
n = size of data set
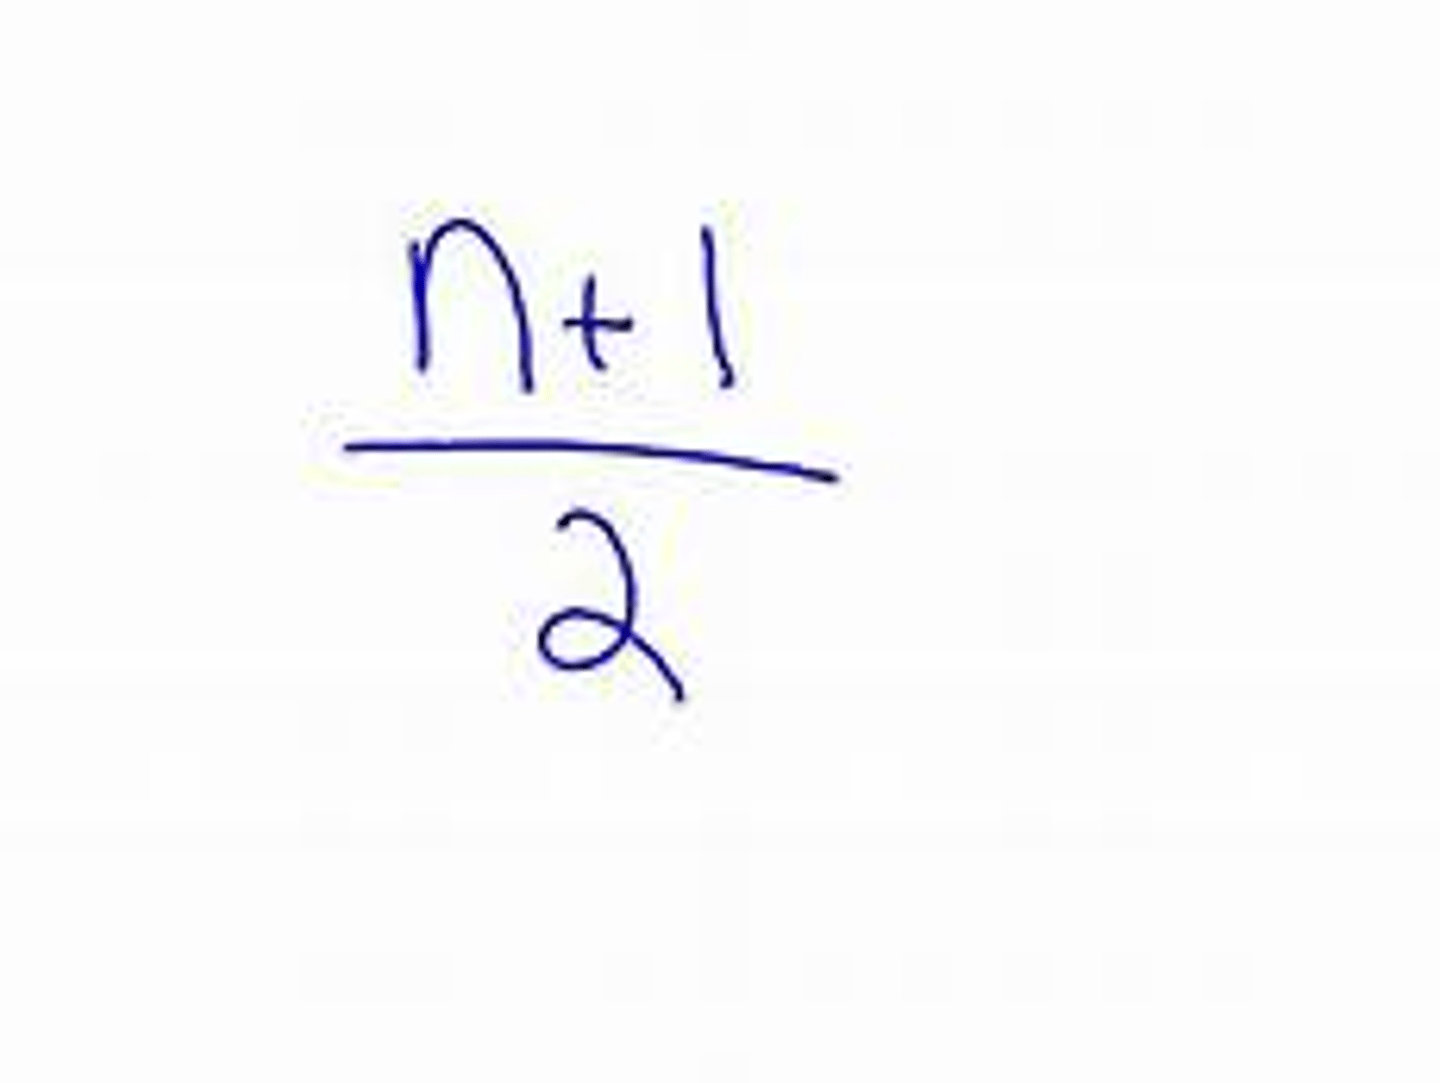
If the size of the data set is _________, the median is the average of the two middle
even
If the size of the data set is _________, the median is the middle value.
odd
the _________ is a better reflection of the center when data are skewed or have outliers.
median
Mode
the data value that occurs most often
Measures of variation are used to
describe the spread or dispersion of the data.
3 measures of variation
(1) range, (2) variance, and (3) standard deviation.
Range
the difference between the maximum value and the minimum value and is influenced by outliers
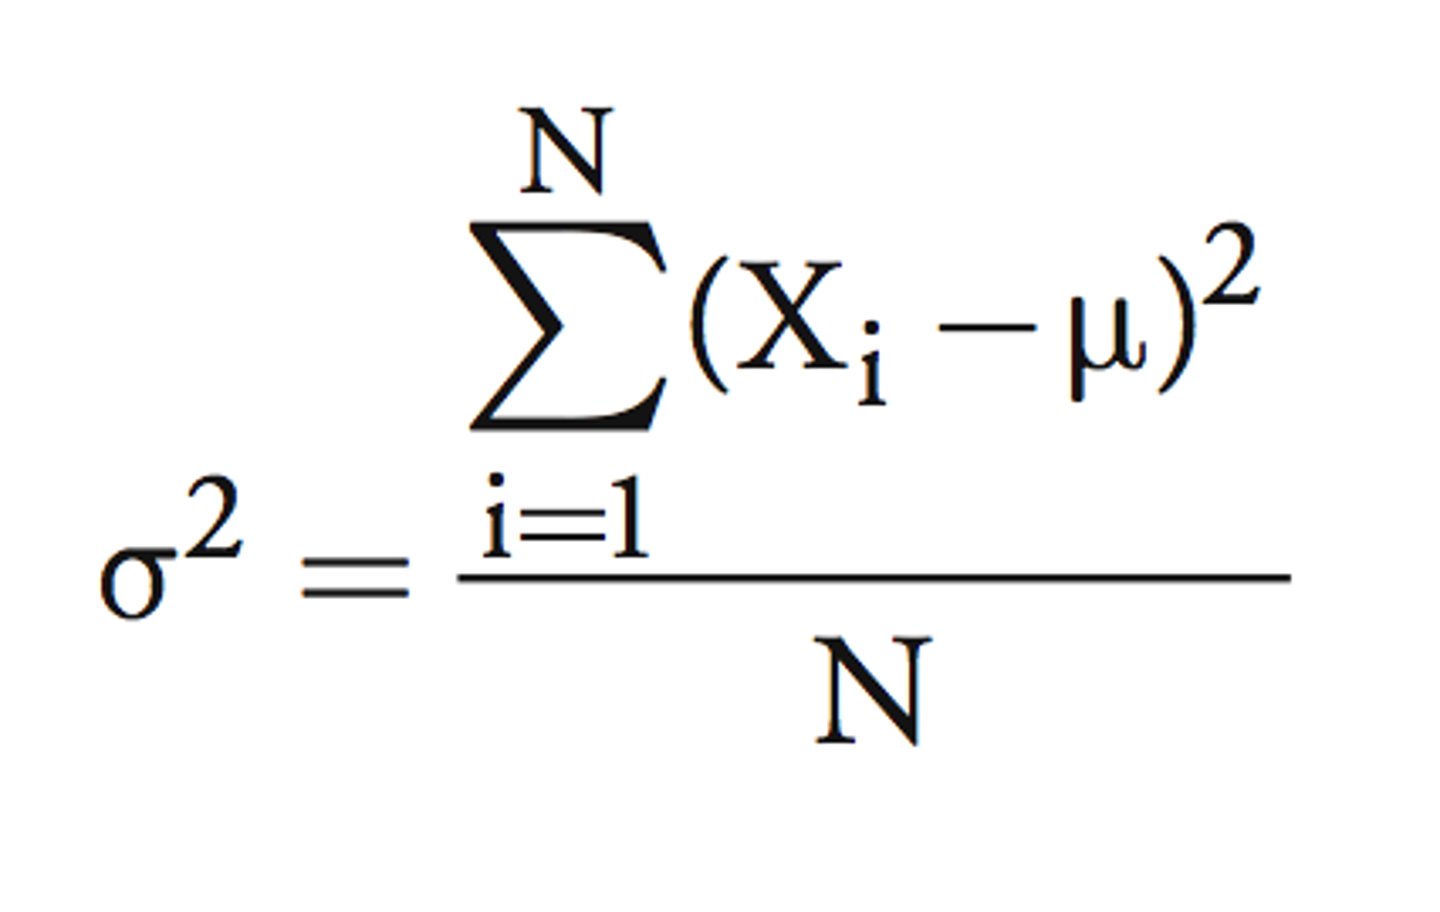
Variance
a measure of variability that utilizes all data values and reflects how the observations vary or deviate from the mean.
population variance formula
sample variance formula

Characteristics of both the population and sample variances:
(1) Both population and sample variances are influenced by outliers.
(2) Both are either zero or positive (never negative).
(3) As data spread out, variance increases.
(4) As data become more concentrated, variance decreases. (5) Data where all values are the same have no variation (variance = 0).
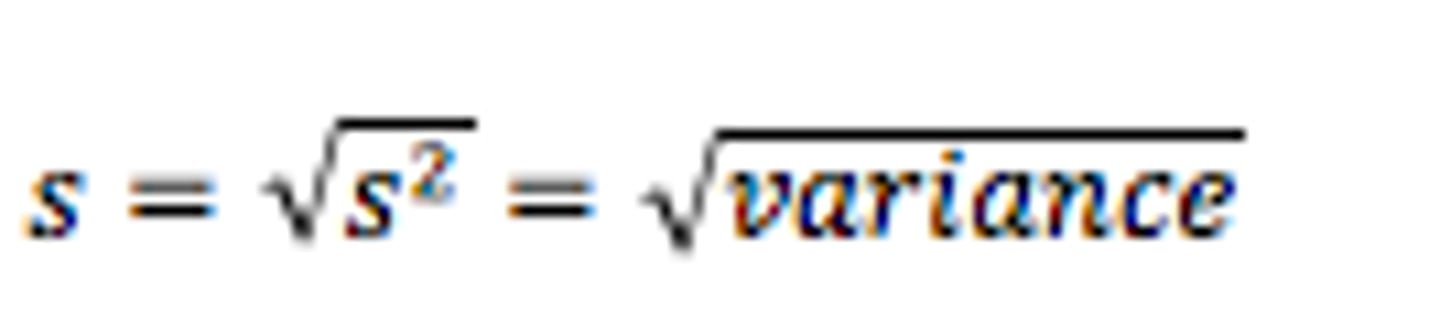
Standard deviation
- square root of variance
Sample standard deviation (s)
the square root of the sample variance
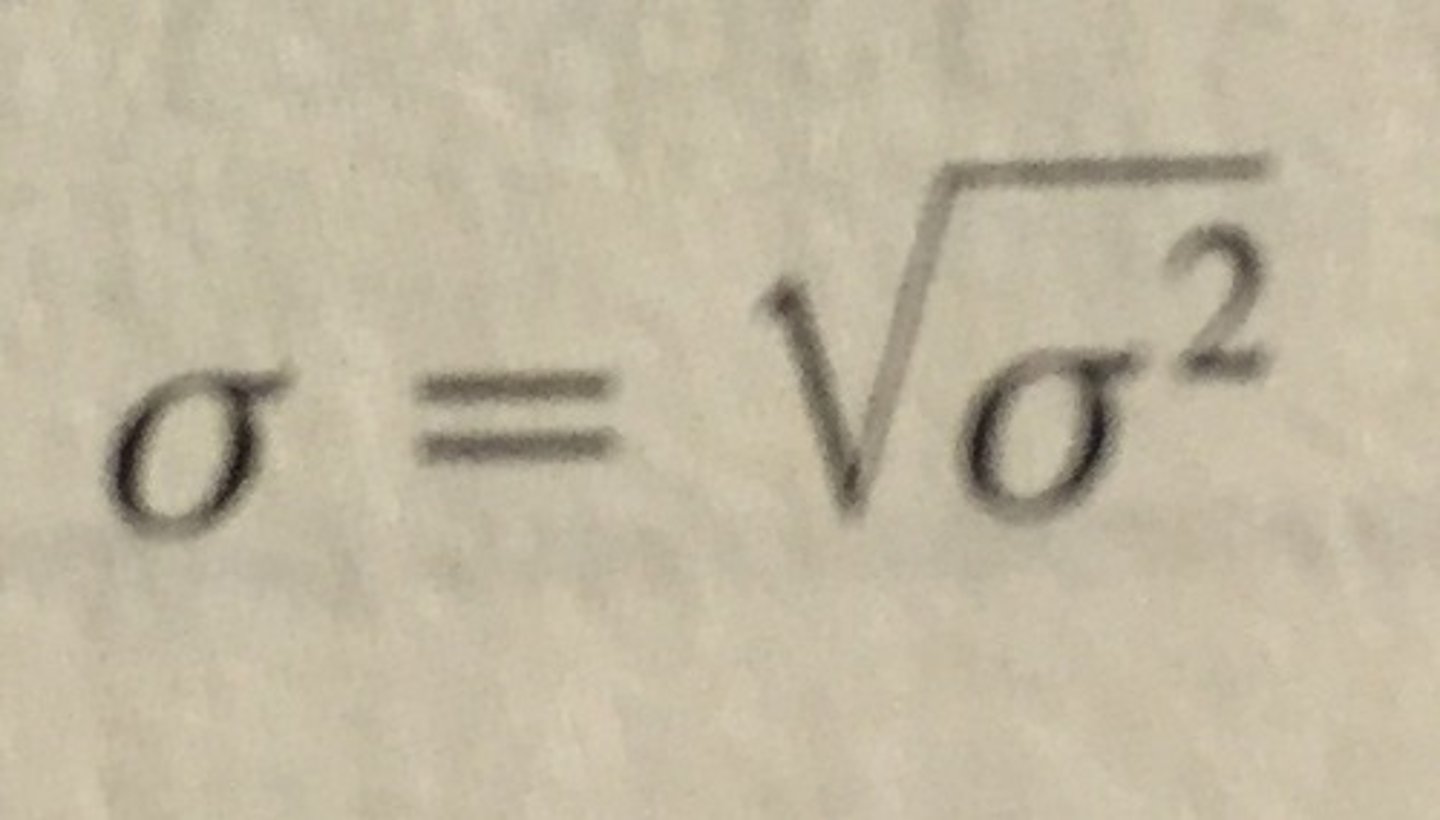
Population standard deviation
the square root of the population variance
The Shape describes the .
distribution or pattern of the values within the dataset
The shape of data is either
symmetric or skewed
Data are considered __________ if one half of the data is a mirror image of the other half
symmetric
Data are considered skewed if they are
not symmetric and are considered either right-skewed or left-skewed
if mean > mode, median > mode, then the data are
right-skewed
How often does mean > median > mode and what skew
most of the time, right skewed
If mean < mode, median < mode, then the data are; and most of the time:
left skewed
How often does mean < median < mode and what skew
most of the time, left skewed
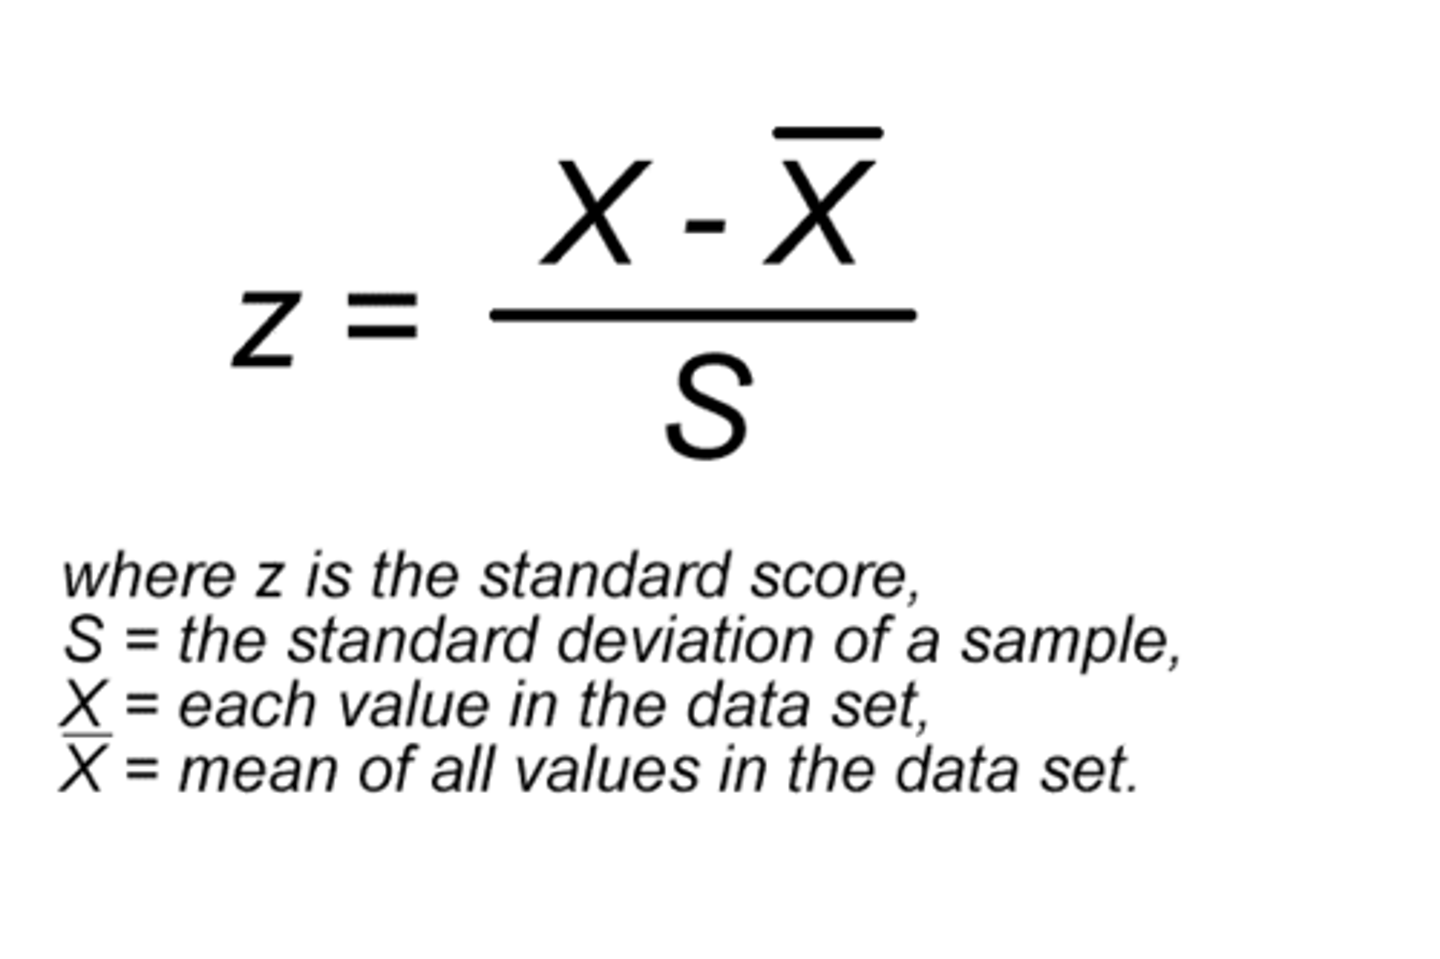
The Z-Score is a
measure of relative location that describes how far an individual observation is from the mean
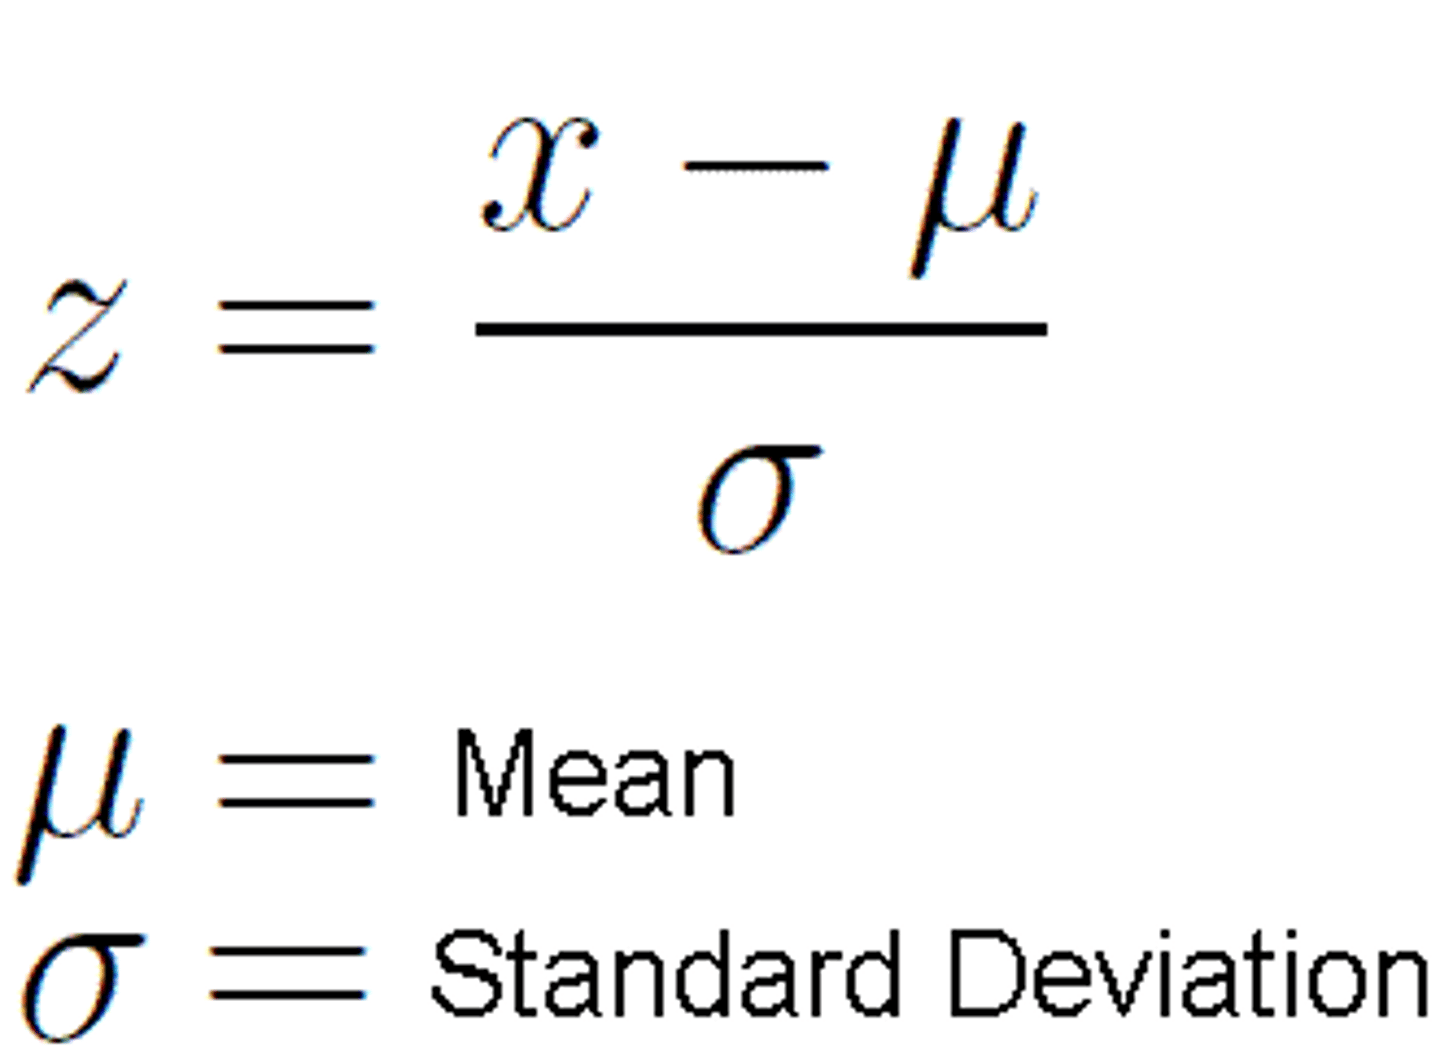
sample z-score
When data are bell-shaped, probabilities about the distance from the mean can be estimated using the
Empirical Rule
Approximately __% of the observations are within 1 standard deviation of the mean
68
Approximately ___% of the observations are within 2 standard deviations of the mean
95
Approximately ___% of the observations are within 3 standard deviations of the mean (𝑋𝑋� ± 3).
100
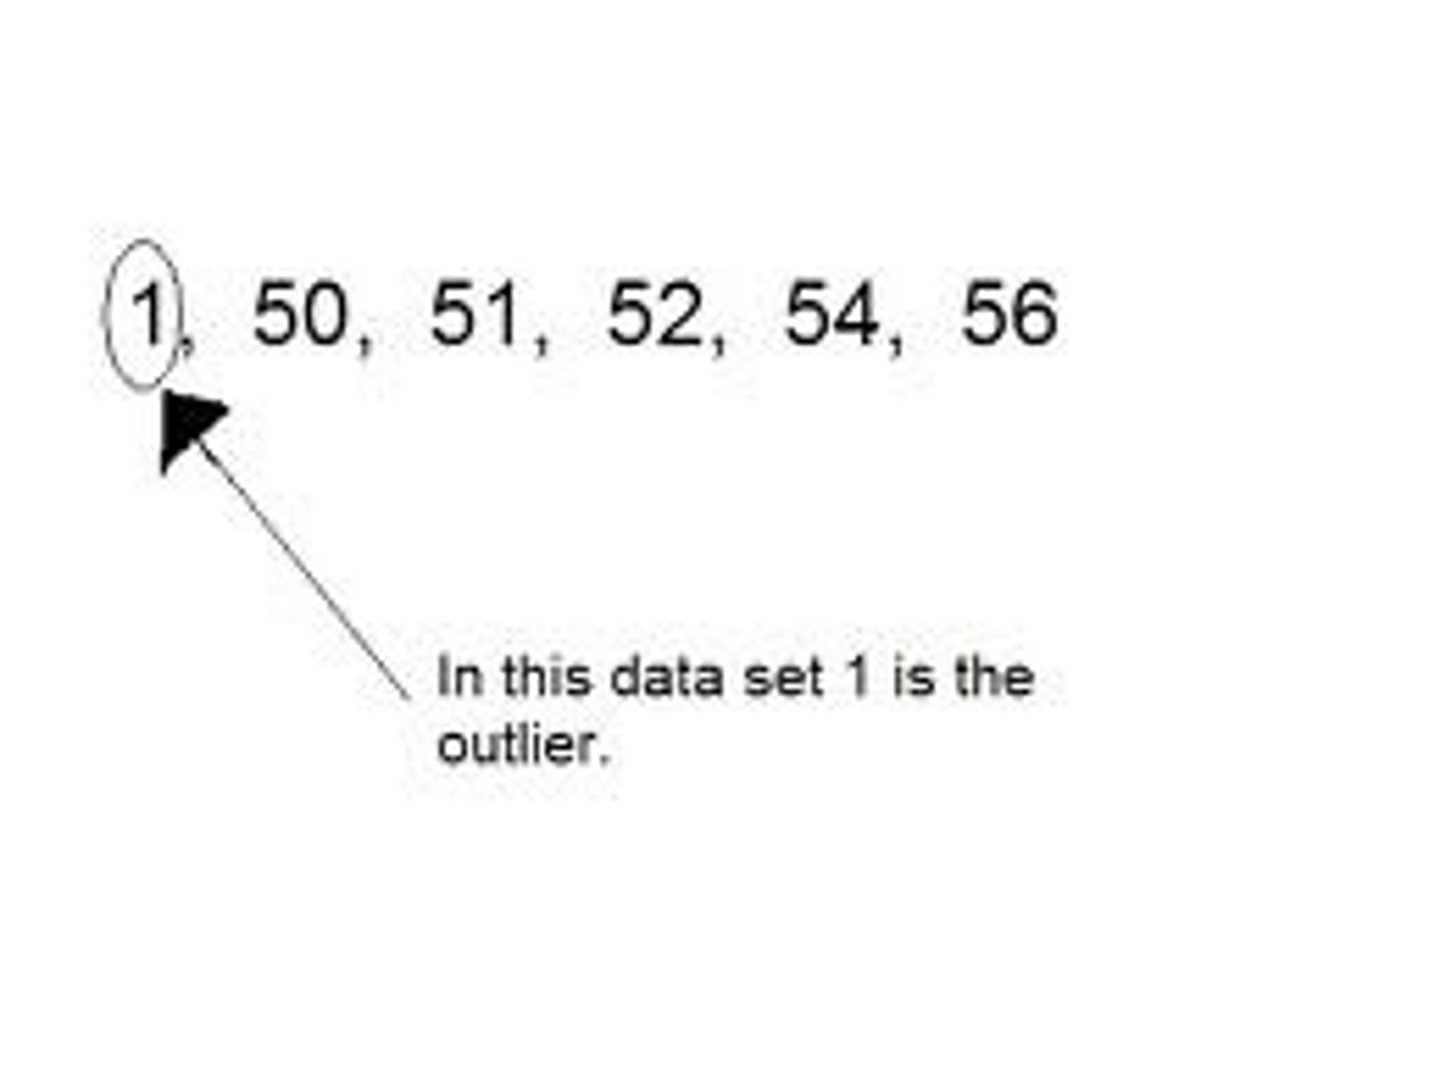
outlier
A value that "lies outside" (is much smaller or larger than) most of the other values in a set of data.
Outlier Rule
Upper Bound = Q3 + 1.5(IQR)
Lower Bound = Q1 - 1.5(IQR)
IQR = Q3 - Q1