ap macro: unit 4 notes
ap macroeconomics unit 4: the financial sector
↪ this guide is derived from ap classroom and my teacher’s lectures
:: abbreviations
ump - unemployment
pl - price level
mb - market basket
G&S - Goods and services
pv - present value
fv - future value
rGDP - real gross domestic product
SRPC - short-run phillip’s curve
LRPC - long-run phillip’s curve
PPC - production possibilities curve
inc = increase
dec = decrease
Δ = change in
⟡ 4.1 - financial assets
vocab !
the financial sector - network of institutions that link borrowers and lenders
banks, mutual funds, pension funds, other financial intermediaries
assets - anything tangible or intangible that has value
interest rate - he amount a lender charges borrowers for borrowing oney
“price” of a loan
interest bearing assets - assets that earn interest over time
ex. bonds
* “INVESTMENT” in econ will always refer to business spending tools and machinery *
── .✦ risks of buying assets
market risk
losing money from fluctuations in market prices
default risk
companies/individuals are unable to fulfill their payment/debt obligations
inflation risk
the value of your investment shrinks from inflation
✮ liquidity - the ease with which an asset can be converted to a medium of exchange. in general, the higher the liquidity the lower the rate of return!
basically, how quickly you can get your hands on your cash
── .✦ bonds vs stocks
bonds (securities) are loans, or IOUs, that represent debt that the government, business, or individual must repay to the lender
the bond holder has NO OWNERSHIP of the company and is paid interest.
stocks (equities) represent ownership of a corporation and the stockholder is often entitled to a portion of the profit paid out as dividends
✮ a bond is issued at a specific interest rate that doesn’t change throughout the life of the bond
✮ bond price and interest rates are inversely related
⟡ 4.2: nominal vs real interest rates
interest rates and inflation
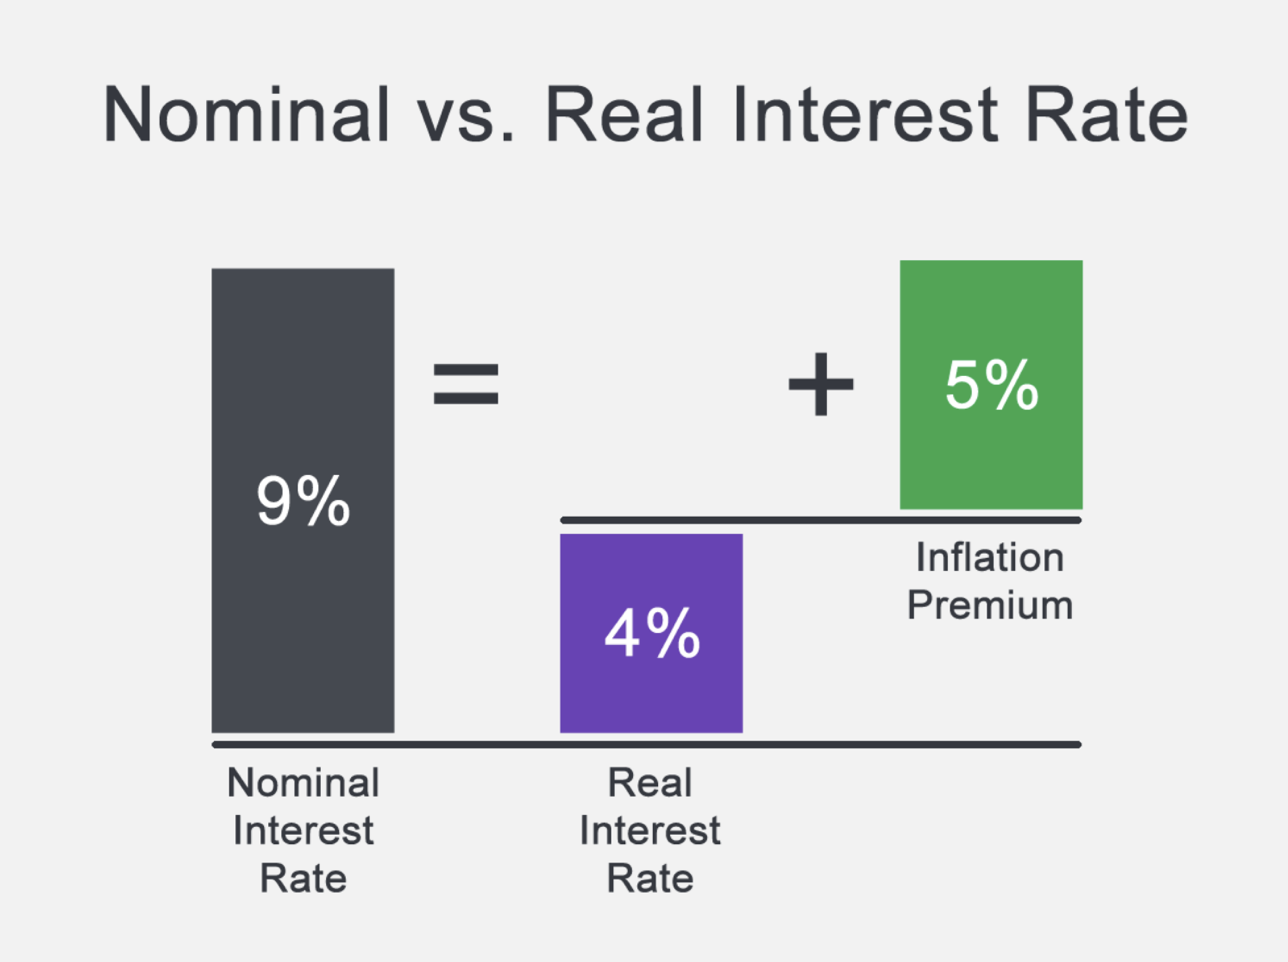
real interest rates: the percentage increase in purchasing power that a borrower pays(adjusted for inflation)
real = nominal interest rate - expected inflation
nominal interest rates: the percentage increase in money that the borrower pays(not adjusted for inflation)
nominal = real interest rate + expected inflation
why do we use money?
barter system is inefficient!
what is money?
money: anything that is generally accepted as payment for goods and services
money is NOT the same as wealth or income
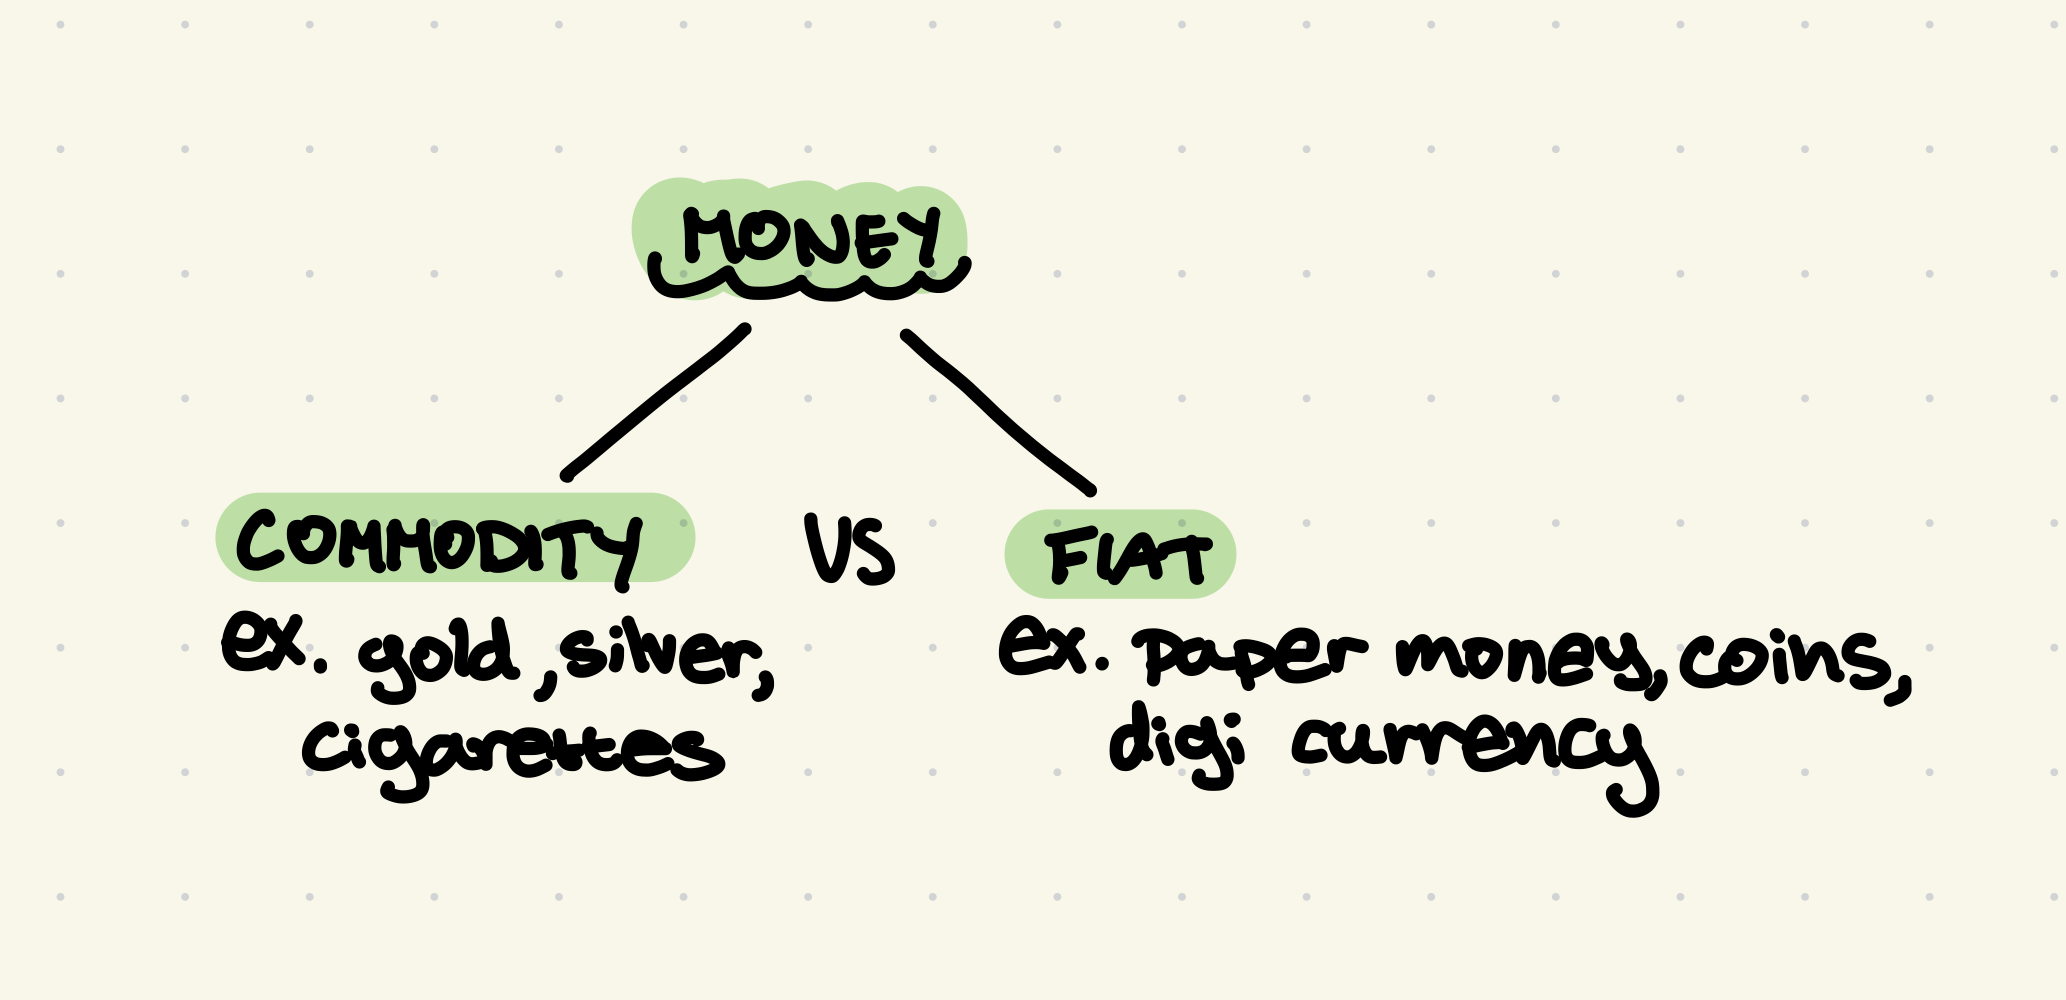
commodity money: something that performs the function of money and has intrinsic value
fiat money: something that serves as money but has no other value or uses
── .✦ 3 functions of money
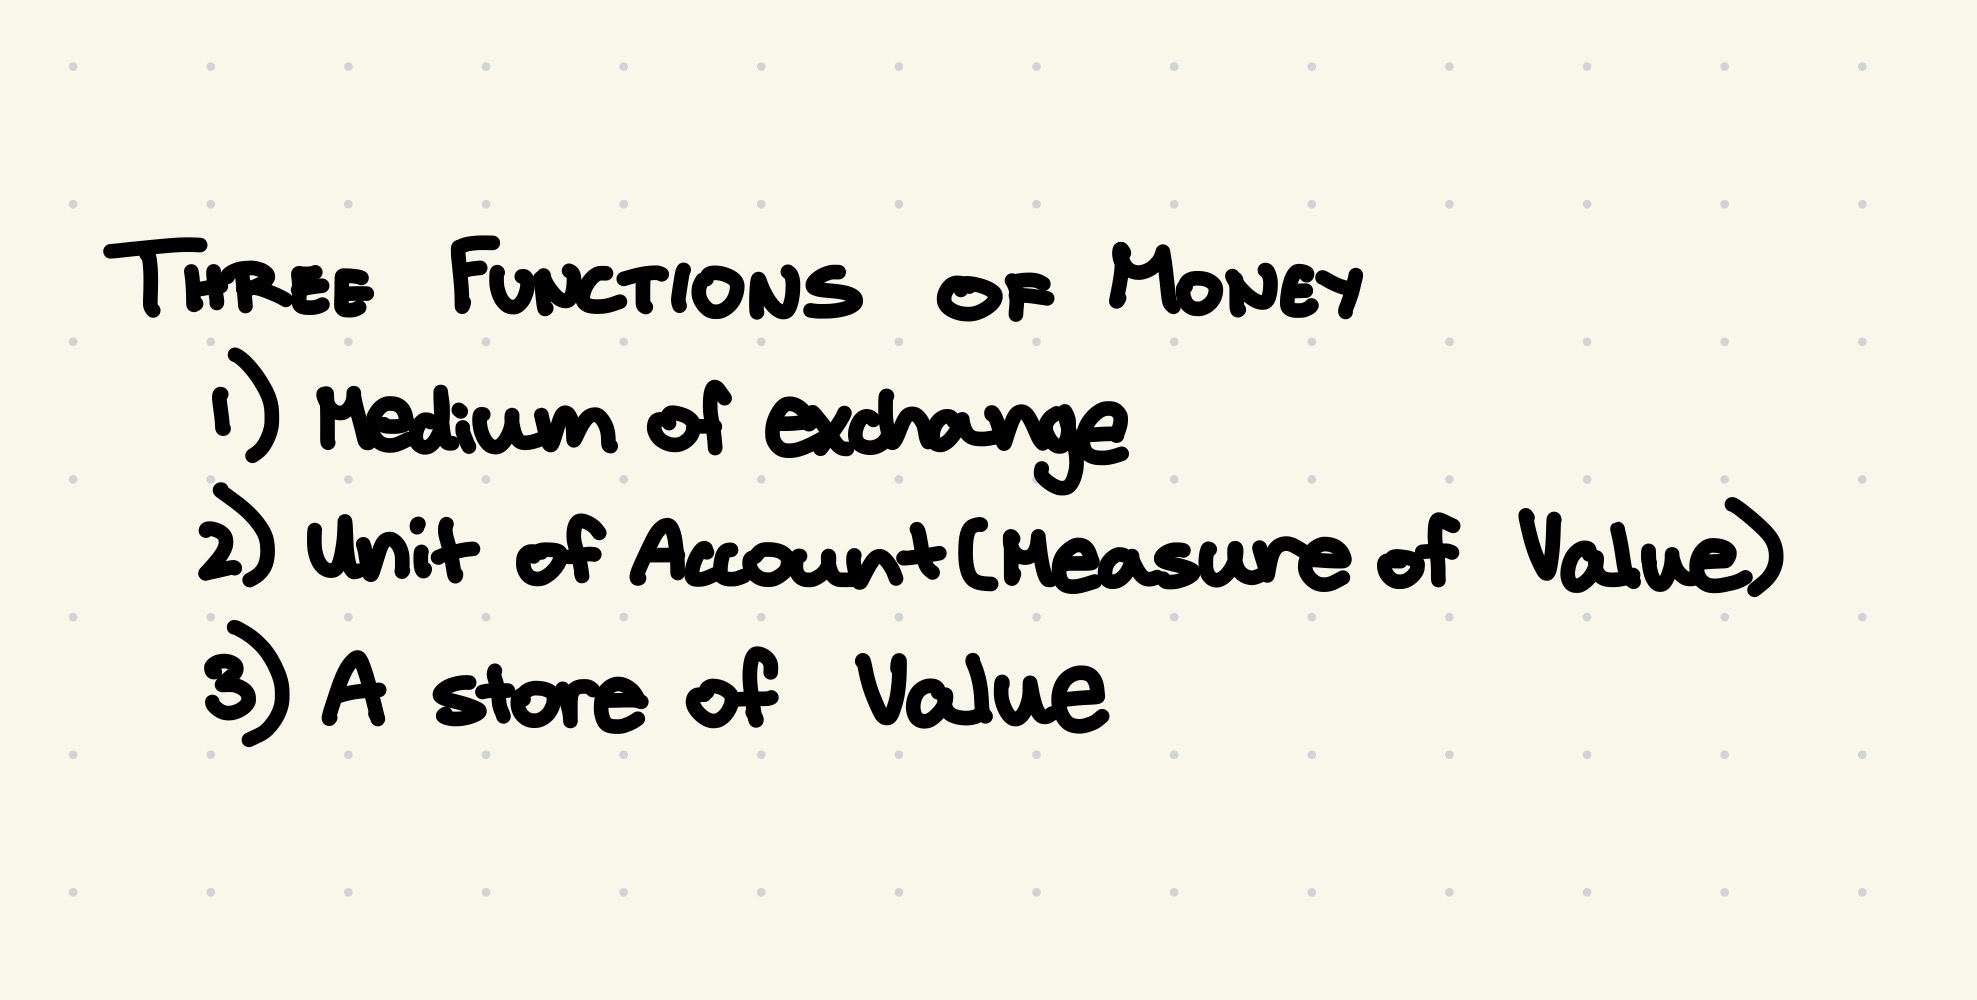
medium of exchange:
money can easily be used to buy goods and services with no complications of barter system
unit of account(measure of value)
money measures the value of all goods and services. money acts as a measurement of value
store of value
money allows you to store purchasing power for the future
✦ what backs the money supply?
money’s value comes from our collective belief that it is valuable
── .✦ classifying money
liquidity: how easily you can get physical money
M1(highest liquidity)
currency in circulation
checkable bank deposits(checking accs)
M2(near-moneys) - M1 plus the following
savings deposits(money market accounts)
time deposit(CDs = certificate of deposit)
money market funds
⟡ 4.4: banking and the expansion of the money supply
── .✦ money multiplier
money multiplier = 1/reserve requirement
vocab!
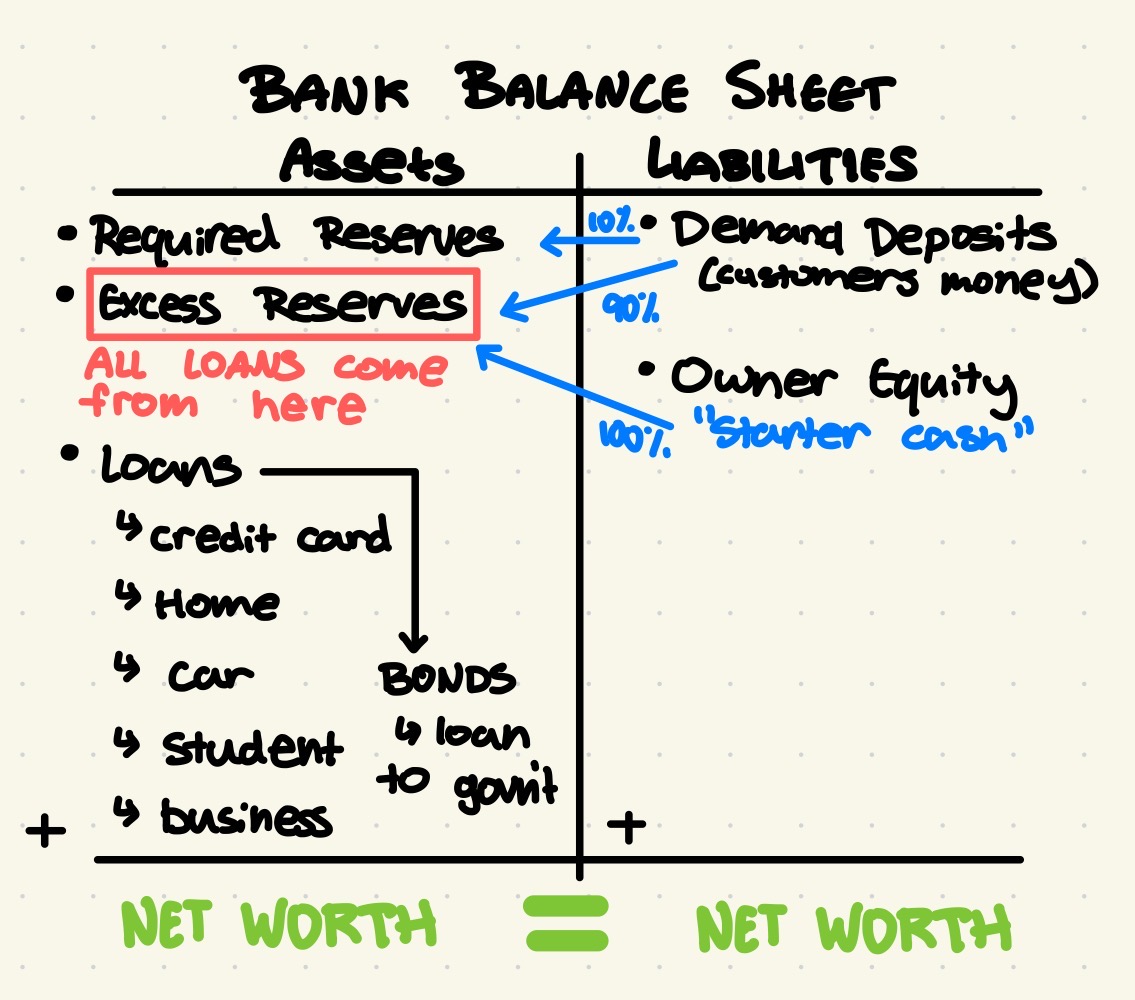
demand deposits - money deposited in a commercial bank in a checking account
required reserves - the % that the bank must hold by law
excess reserves - the amount that the bank can loan out
balance sheet - a record of a bank’s assets, liabilities, and net worth
⟡ 4.5: the money market
── .✦ the demand for money
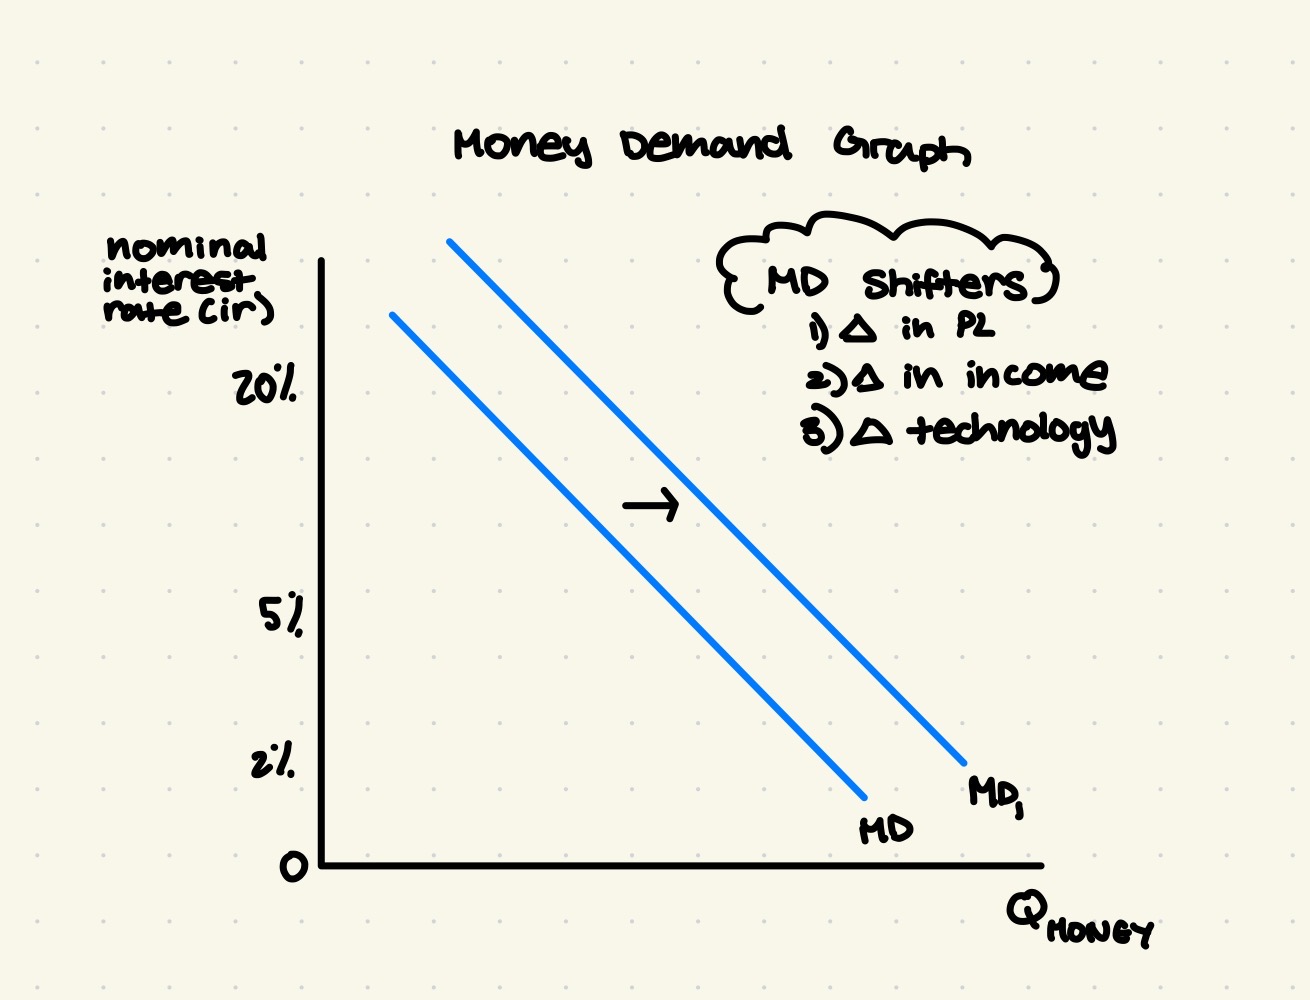
the demand for money refers to people choosing to hold their wealth as money instead of other assets. it has two main components:
asset demand for money: this reflects the choice to hold wealth as money (cash) versus interest-bearing assets (CDs, money market funds, treasury bonds).
“The opportunity cost of holding money is the interest you could have earned by investing it elsewhere.”
downward sloping curve: a lower nominal interest rate (I) means a lower opportunity cost, leading to higher money demand (people prefer liquidity). a higher nominal interest rate leads to lower money demand. the quantity of money is on the x-axis and the nominal interest rate (I) is on the y-axis.
transaction demand for money: This is the money needed for everyday transactions within the economy.
GDP and price level: Transaction demand is influenced by the output expenditure model of GDP (Y=C+I+G+XnY=C+I+G+Xn). Changes in consumption (C), investment (I), government spending (G), or net exports (Xn) all affect transaction demand. Higher price levels require more money for the same transactions.
inflation expectations: Higher expected inflation increases money demand as people want to hold onto more money before it loses value.
── .✦ the money supply
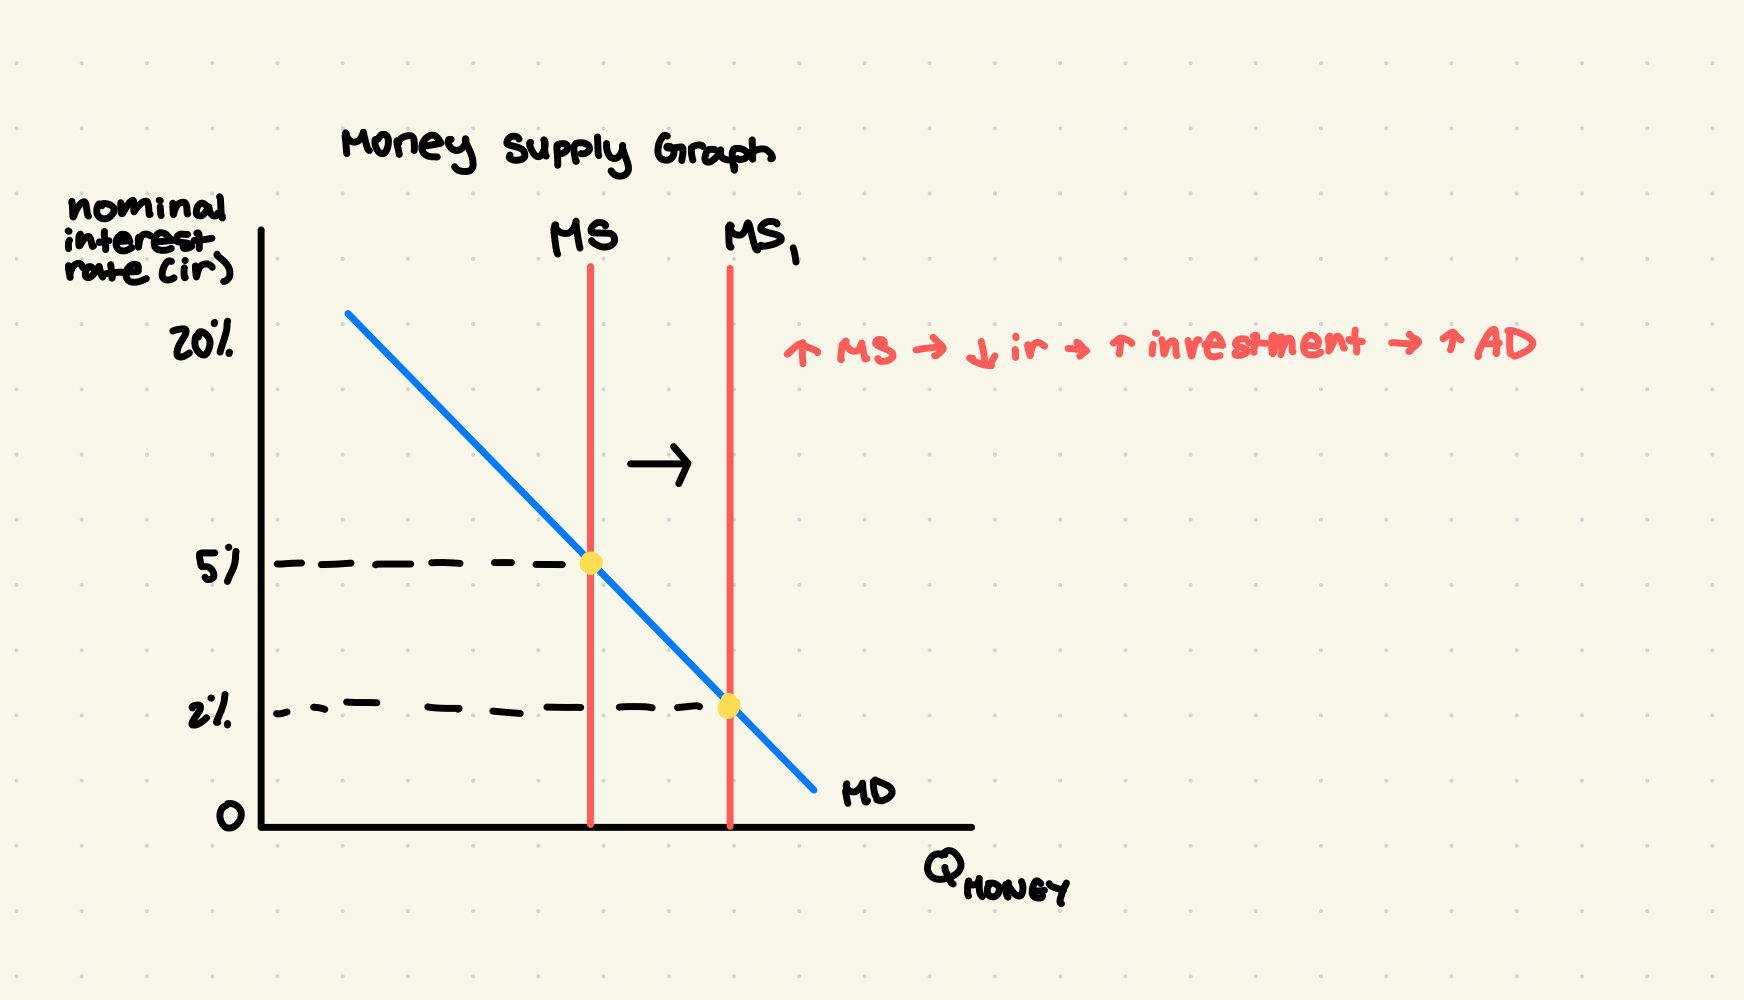
the money supply is largely determined by the central bank's actions, particularly regarding reserves and banking lending
vertical supply curve: the quantity of money supplied is independent of the interest rate
shifts in the money supply:
rightward shift (increase): caused by increased banking lending or expansionary monetary policy.
leftward shift (decrease): caused by decreased banking lending or contractionary monetary policy.
── .✦ equilibrium in the money market
the equilibrium nominal interest rate is where the money supply and money demand curves intersect.
interest rate above equilibrium: a surplus of money pushes interest rates down.
interest rate below equilibrium: a shortage of money pushes interest rates up.
shifts and interest rates:
curve shift
change in interest rate
explanation
Money Supply ↑
Interest Rate ↓
Increased money supply (e.g., expansionary monetary policy) lowers equilibrium interest rates.
Money Supply ↓
Interest Rate ↑
Decreased money supply (e.g., contractionary monetary policy) raises equilibrium interest rates.
Money Demand ↑
Interest Rate ↑
Increased demand (e.g., higher GDP, higher prices) raises equilibrium interest rates.
Money Demand ↓
Interest Rate ↓
Decreased demand (e.g., lower GDP, lower prices) lowers equilibrium interest rates.
── .✦ interest rates and economic growth
lower interest rates: encourage greater gross investment → more physical capital → faster economic growth
PPC and LRAS curve shift outward faster
higher interest rates: discourage gross investment → less physical capital → slower economic growth
PPC and LRAS curve shift outward slower
⟡ 4.6 monetary policy:
── .✦ monetary policy's goals:
Monetary policy, implemented by central banks (like the U.S. Federal Reserve), aims to achieve three macroeconomic goals:
stable prices: maintaining a consistent price level to avoid inflation or deflation.
full employment: keeping unemployment rates low.
economic growth: promoting a sustainable increase in the nation's output.
!! influencing interest rates therefore affecting gross investment. changes in gross investment shift aggregate demand (AD) in the AD-AS model which impacts the price level and real output !!
── .✦ scarce vs. ample reserves
✰ reserves are funds available to banks. They're categorized as:
required reserves: required funds that banks cannot loan out
excess reserves: funds that can be loaned out.
reserves are part of the monetary base (M0), but they are not money. currency is considered money and is part of the M1 money supply.
since the 2008 Great Recession, bank reserves have significantly increased:
Year | Bank Reserves (USD) |
2008 | $46 billion |
Present | Over $3.2 trillion |
this shift marks a change from a scarce reserve system to an ample reserve system
── .✦ scarce reserve system
central banks target the policy rate (the interest rate banks charge each other—the federal funds rate in the U.S.) by adjusting the money supply.
increasing money supply decreases nominal interest rate.
decreasing money supply increases nominal interest rate.
three monetary policy tools are used:
discount rate: the interest rate the central bank (FED) charges commercial banks for overnight loans.
to increase money supply, the FED should:
DECREASE discount rate
BUY govn’t securities
to decrease money supply, the FED should:
INCREASE discount rate
SELL gov’t securities
REMEMBER:
buy → BIG → buying bonds increases money supply.
sell → SMALL → selling bonds decreases money supply.
reserve requirement: the percentage of checkable deposits banks cannot loan out
banks hold less money and have more excess reserves
open market operations: buying or selling government bonds/securities
Selling bonds decreases the money supply. Buying bonds increases the money supply.
contractionary monetary policy (raising rates, etc.) fights inflation by decreasing the money supply and increasing interest rates, thus lowering gross investment.
expansionary monetary policy (lowering rates, etc.) fights unemployment by increasing the money supply and lowering interest rates, stimulating gross investment.
── .✦ ample reserve system
the ample reserve system, used in the U.S. and other countries, utilizes a different graphical representation: the reserves market graph.
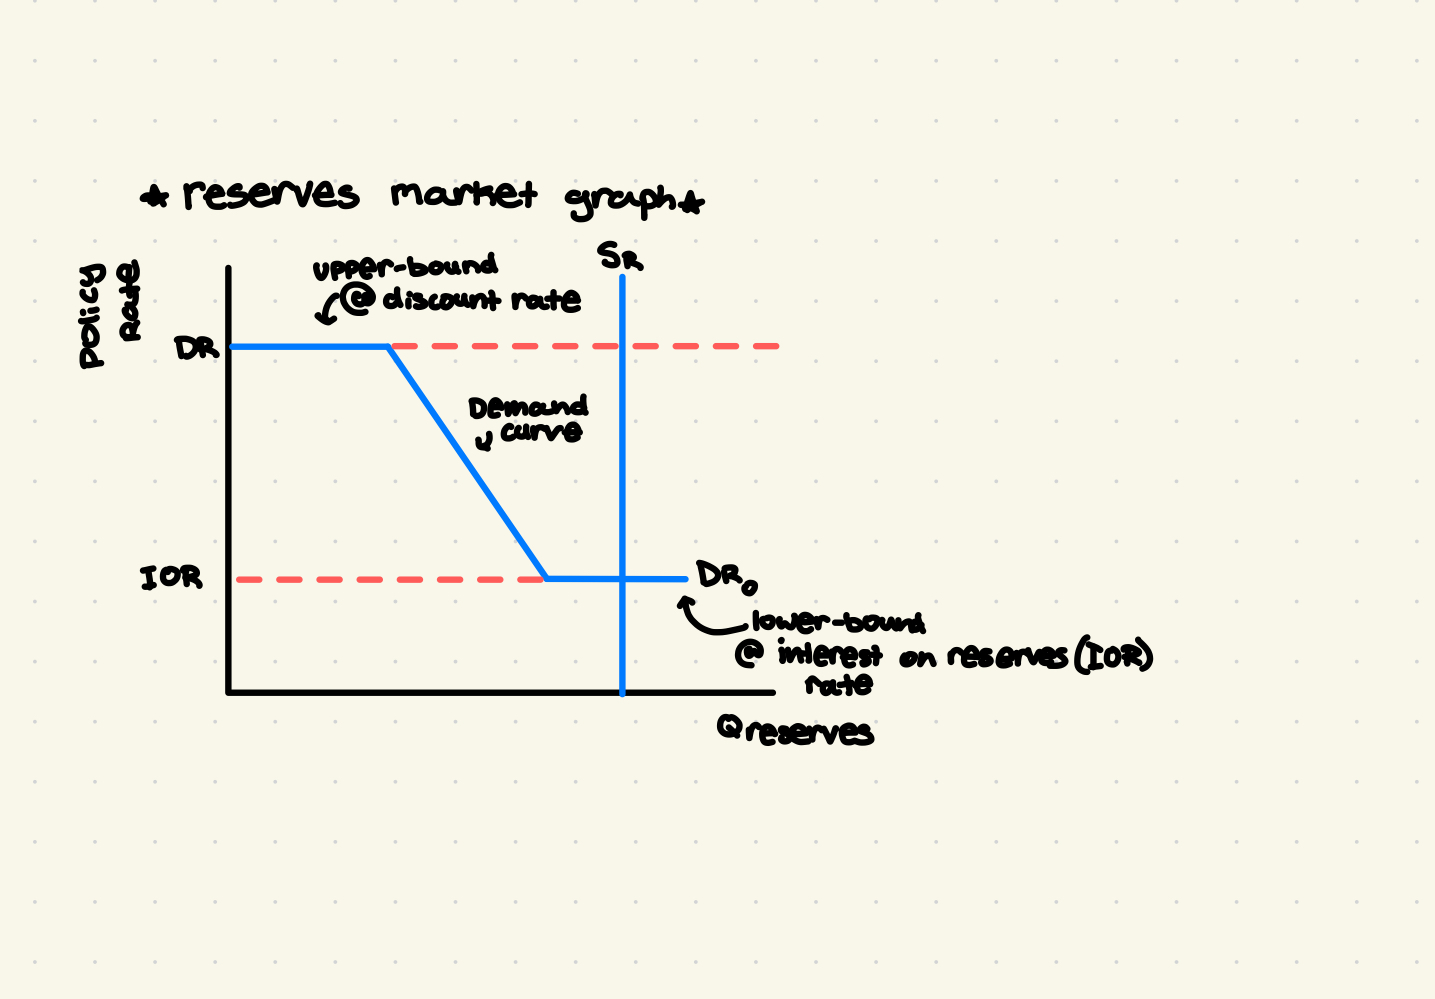
Y-axis: policy rate
X-axis: quantity of reserves
demand curve has three sections:
upper bound: flat at the discount rate; banks won't borrow above this rate.
downward-sloping portion: typical demand curve; higher policy rates lead to lower reserve demand.
lower bound: flat at the interest on reserves rate (the rate central banks pay on reserves). Arbitrage causes this flat portion.
the supply of reserves is vertical (perfectly inelastic) and controlled by the central bank. Open market purchases shift the supply curve right; open market sales shift it left.
the policy rate (federal funds rate) is found where the demand and supply curves intersect, impacting interest rates throughout the economy. The scarce reserve model is shown on the downward-sloping portion of the demand curve in this graph.
── .✦ monetary policy with ample reserves
impact of open market operations
At the downward-sloping portion of the reserve supply curve, small changes in reserves significantly impact the policy rate.
Open market operations effectively influence interest rates in this region.
however, in an ample reserve system, where the supply and demand curves intersect at the lower bound, changes in reserve supply do not affect the policy rate.
Open market operations are still utilized to increase the reserve supply, maintaining the intersection at the lower bound.
impact of administered rates
a change in the discount rate only shifts the upper bound; it does not alter the policy rate.
changes to the interest on reserves directly influence the policy rate. An increase shifts the lower bound upward, raising the policy rate.
── .✦ monetary policy tools in an ample reserve system
Tool | Effect |
Open Market Operations | Maintains ample reserves by increasing supply; keeps intersection at the lower bound. |
Discount Rate | Moves the upper bound up or down; does not change the policy rate. |
Interest on Reserves | Primary policy tool; directly impacts the policy rate. |
── .✦ monetary policy and economic gaps
expansionary monetary policy (recessionary gap)
In a recessionary gap (illustrated using an AS-AD model), expansionary monetary policy is used to combat unemployment. This involves lowering the nominal interest rate, increasing gross investment, and boosting interest-rate sensitive spending. The resulting rightward shift of the aggregate demand (AD) curve restores long-run equilibrium, increasing the price level and real output while decreasing unemployment.
contractionary monetary policy (inflationary gap)
In an inflationary gap (also using an AS-AD model), contractionary monetary policy fights inflation.
Higher interest rates decrease gross investment and interest-rate sensitive spending → shifts the AD curve left
⟡ 4.7 loanable funds market
── .✦ Demand Curve
the demand for loanable funds represents all borrowing within the economy
x-axis: quantity of loanable funds
y-axis: real interest rate (r)
the demand curve is downward sloping, indicating an inverse relationship between the real interest rate and the quantity of loans demanded:
Real Interest Rate | Quantity of Loanable Funds Demanded |
High | Low |
Low | High |
Shifters of the Investment Demand Curve: Anything impacting the potential profit on new investments will shift the curve.
Rightward Shift (Increase in Demand):
Increased economic outlook (greater business confidence)
Investment tax credits (decreased taxes)
Decreased corporate income taxes
Increased productivity of new physical capital
Rising real GDP
Leftward Shift (Decrease in Demand):
Decreased economic outlook (less business confidence)
Increased investment tax credits (increased taxes)
Increased corporate income taxes
Decreased productivity of new physical capital
Falling real GDP
Supply Curve 💰
The supply curve is called the savings supply. When people save, their money often goes into banks, making it available for loans.
The curve is upward sloping, showing a direct relationship between the real interest rate and the quantity of loanable funds saved. Higher interest rates incentivize more saving.
Real Interest RateQuantity of Loanable Funds Supplied | |
High | High |
Low | Low |
Shifters of the Savings Supply Curve: Anything changing the amount of money saved in US banks will shift the curve.
Rightward Shift (Increase in Supply):
Increased consumer disposable income
Increased national savings rate
Capital inflow (foreign direct investment)
Leftward Shift (Decrease in Supply):
Decreased consumer disposable income
Decreased national savings rate
Capital outflow (foreign investors withdrawing funds)
Political or economic instability (leading to capital flight)
Loanable Funds Market Equilibrium ⚖
Combining supply and demand creates the loanable funds market and its equilibrium.
Equilibrium real interest rate (r<sub>e</sub>): The interest rate where quantity supplied equals quantity demanded.
Equilibrium quantity of loanable funds (Q<sub>e</sub>): The quantity of loanable funds borrowed and lent at the equilibrium interest rate.
At interest rates below equilibrium, there's a shortage of loanable funds (quantity demanded exceeds quantity supplied), pushing rates upward. At rates above equilibrium, there's a surplus (quantity supplied exceeds quantity demanded), pushing rates downward.
Impact of Supply Shifts 📈📉
Increased Savings Supply/Capital Inflow: Shifts the supply curve to the right, decreasing the real interest rate and increasing the equilibrium quantity of loanable funds. This leads to increased gross investment and long-run economic growth.
Decreased Savings Supply/Capital Outflow: Shifts the supply curve to the left, increasing the real interest rate and decreasing the equilibrium quantity of loanable funds. This results in decreased gross investment and slower economic growth.
Impact of Demand Shifts 📈📉
Decreased Business Confidence: Shifts the demand curve to the left, decreasing the real interest rate and the quantity of loanable funds. This leads to decreased gross investment.
Increased Business Confidence: Shifts the demand curve to the right, increasing the real interest rate and the quantity of loanable funds. This leads to increased gross investment.
Double shifts can make one axis indeterminate.
Loanable Funds Market Study Guide
Equilibrium Shifts 📉📈
A decrease in the investment demand curve shifts the curve to the left, resulting in equilibrium point two. This leads to a lower equilibrium quantity and a lower real interest rate.
A decrease in the supply of loanable funds shifts the curve to the left, resulting in equilibrium point three. Since both shifts decrease the quantity, we know the quantity will decrease. The real interest rate, however, is indeterminate.
A double shift in the loanable funds market means that the effect on the real interest rate is uncertain (indeterminate). The effect on the quantity is certain if both shifts go in the same direction.
If both shifts increase or decrease one axis, that axis is indeterminate.
If both shifts decrease, the quantity decreases.
If both shifts increase, the quantity increases.
Crowding Out 👨💼💰
Crowding out is the phenomenon where increased government borrowing (due to a larger government deficit) leads to higher interest rates and reduced private investment.
There are two ways to illustrate this in the loanable funds market:
Method 1: Increased Demand
The government increases the demand for loanable funds alongside businesses.
This leads to a higher real interest rate and a larger quantity of loanable funds.
However, the higher interest rate decreases private investment, as businesses borrow less at higher rates.
Method 2: Decreased Supply
The government reduces the supply of loanable funds by borrowing from the available savings.
This results in a higher real interest rate and a lower equilibrium quantity of investment.
This method clearly shows how higher interest rates lead to less investment.
Impact of Decreased Government Borrowing ⬇
A decrease in government borrowing has the opposite effect:
It decreases the real interest rate and increases the amount of gross investment.
This can be shown as a decrease in demand (government demands fewer loans) or an increase in supply (government borrows less, leaving more for the private sector).
Summary Table
Scenario | Demand Shift | Supply Shift | Real Interest Rate | Investment Quantity |
Decrease in Investment Demand | Left | No Change | Decreases | Decreases |
Decrease in Supply of Funds | No Change | Left | Indeterminate | Decreases |
Increased Government Deficit | Right | Left (Method 2) | Increases | Decreases |
Decreased Government Deficit | Left | Right (Method 2) | Decreases | Increases |