INB 373 Exam 2
1/80
There's no tags or description
Looks like no tags are added yet.
Name | Mastery | Learn | Test | Matching | Spaced |
|---|
No study sessions yet.
81 Terms
Explain why the physical environment is the ultimate determinant of the geographic distribution of a species.
organism gets energy and resources from its physical environment
organisms need these things to survive, reproduce, and grow
physical environment is the ultimate constraint on geographical distribution
Differentiate between adaptation and acclimatization.
Adaptation→ long-term genetic, physiological, morphologic, or behavioral changes to enhance fitness in a population or environment
natural selection, long-term, generational, genetic
Acclimatization→ short-term adjustment through physiological, morphological, or behavioral changes to minimize stress from environment
reversible, individual, short-term
How can adaptation and acclimatization may result in trade-offs with other functions.
acclimation and adaptation require investment of energy and resources by organism, some trade-offs include:
marine species develop thermal resistance at cost of reduced reproduction
organisms might trade off large size for higher number of offspring
Describe how the body temperature of an organism influences its functioning.
Temperature regulates:
enzyme activity→ metabolism
physiological function→ movement and organ function
thermoregulation
differentiate:
Ectotherm
Endotherm
Homeotherm
Poikilotherm
Ectotherm→ org receives heat from outside
ex. reptiles and amphibians
Endotherm→ org generates heat from within
ex. birds and mammals
Homeotherm→ org that maintains constant body temp
ex. mammals
Poikilotherm→ org allows body temp to vary
ex. reptiles
Identify the heat exchange mechanisms used by plants and animals to regulate their body temperatures.
loss of energy at night via IR radiation?
create burrows or nurse plants
air is too cold?
get closer to warmer ground
locate in sun
soil is too hot?
locate up the ground
be nocturnal
List the four factors that influence the movement of water from a high-energy state to a low-energy state in biological systems.
Osmotic potential→ water flows from high water conc to low water conc (water moves towards solutes)
Pressure potential (turgor) → pressure on water, water flows from high pressure to low (low pressure to even lower)
Gravitational pressure→ uphill to downhill
Matric potential→ interacting with differences forces (important in soil bc of various pressures)
How organisms can control water gains and losses by adjusting resistance to water movement? Are trade-offs involved?
adjust water movement
close stomata or skin adaptation
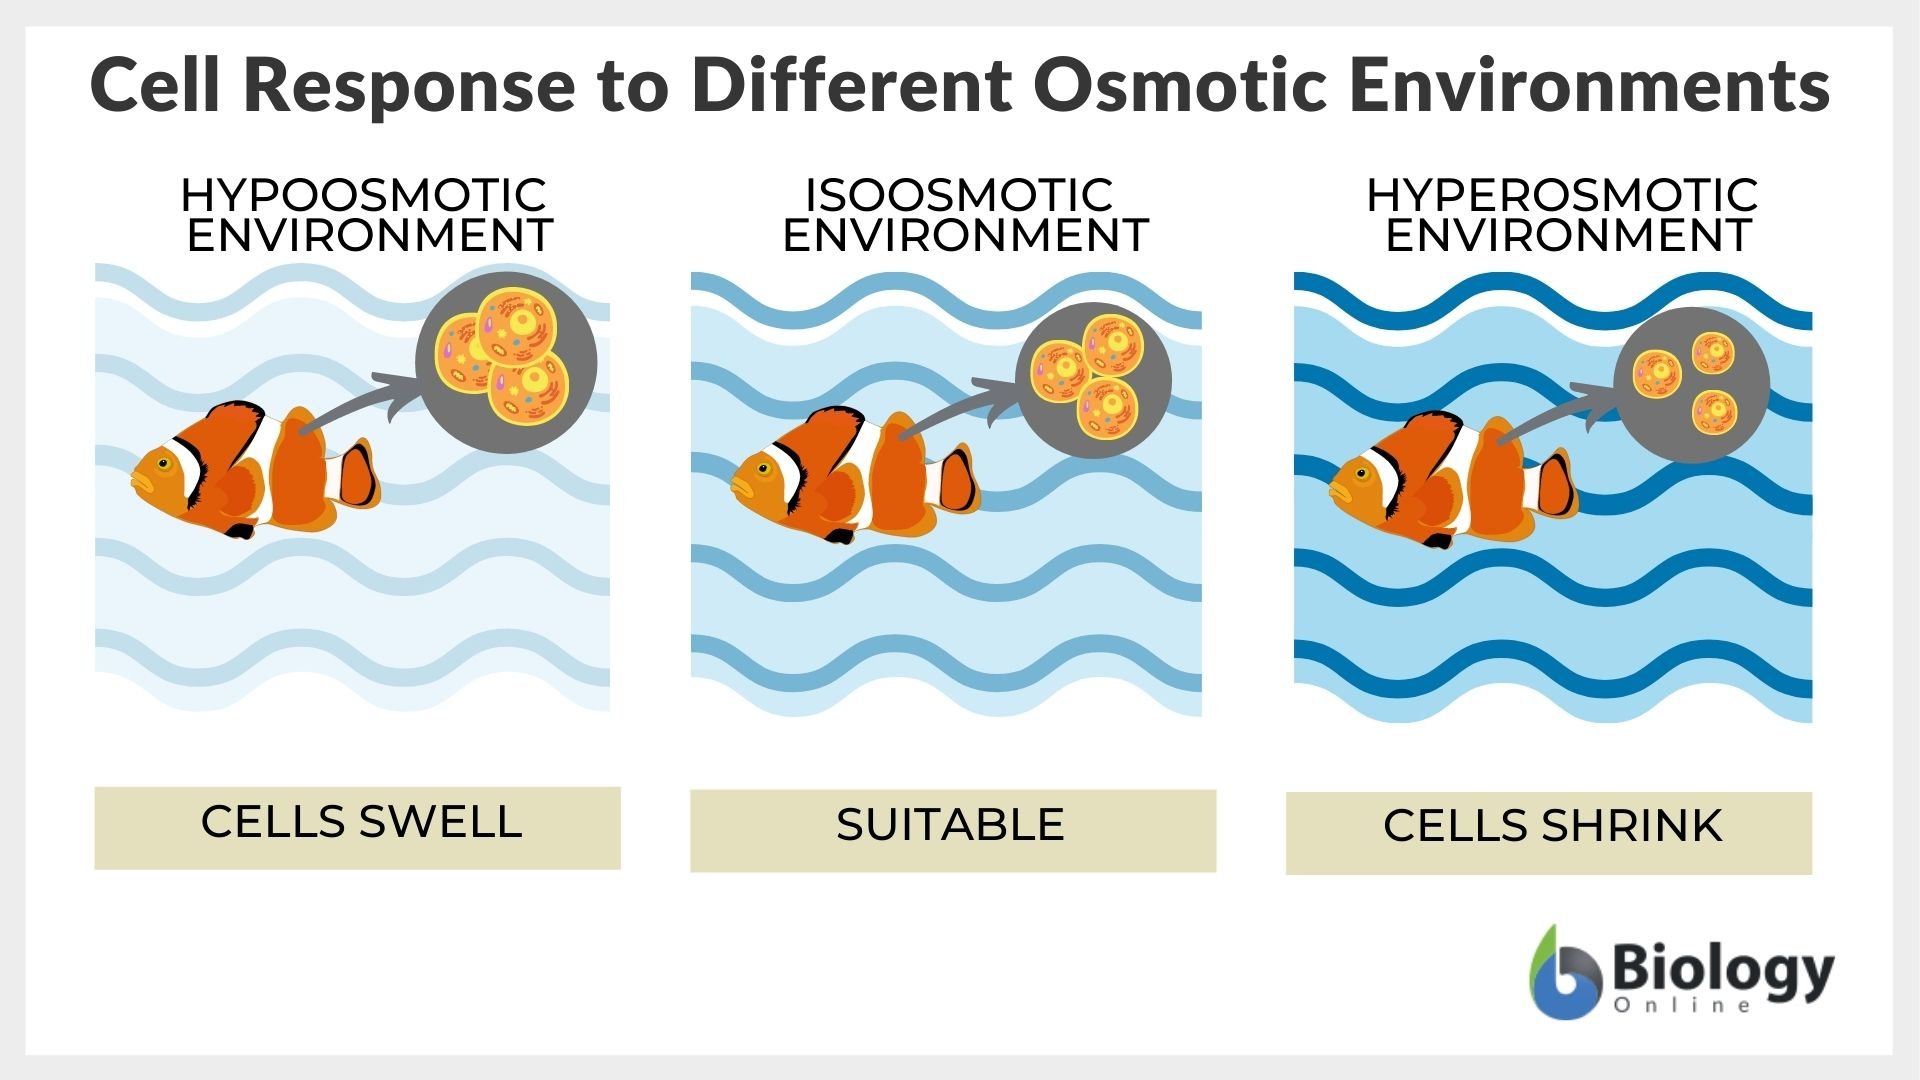
define:
Hyperosmotic
Iso-osmotic
Hypo-osmotic
Hyperosmotic→ more saline in environment than org cells
Cells shrink (most saltwater orgs)
Iso-osmotic→ same salinity in environment and org cells
Many marine orgs
Hypo-osmotic→ less saline in environment than org cells
Cell swells (most freshwater orgs)
Differentiate autotrophy from heterotrophy.
autotrophy→ convert energy from sunlight or inorganic chemicals into energy stored in C-C bonds of carbs
heterotrophy→ acquire energy by consuming organic compounds from other organisms (dead or alive)
Chemosynthesis
→ process uses chemical energy to create food, rather than sunlight.
bacteria and archaea oxidize inorganic substrate to obtain E— used to fix carbon and synthesize sugars through C-C bonds
Outline the steps in the light-driven reactions and carbon reactions of photosynthesis, describing their outcomes and how they produce energy-rich compounds in photoautotrophs.
light-driven rxns→ light energy is harvested and used to split water to provide electrons to make ATP and NADPH
carbon (dark-driven) rxns→ CO2 is fixed to calvin cycle and carbohydrates are synthesized
Illustrate how photosynthetic organisms acclimatize and adapt to variations in the intensity of light.
more light→ more photosynthesis but to a limit
light saturation curve— autotrophs have ability to acclimate through different leaf morphology
Evaluate the trade-offs that result when a plant controls water loss
more water→ plants open stomates, increase CO2 uptake, release O2
water conversation vs energy gain
closing stomates (low water) → increase chance of light damage
no calvin cycle→ energy acclimates→ damage membranes
plants have mechanisms to dissipate E as heat
Describe how temperature influences photosynthetic rates.
temperature→ impacts enzymes and membranes
plants acclimate to best grow in environment
through its effect on enzymes and chloroplast membranes.
Explain the difference between photosynthesis and photorespiration and evaluate conditions where photorespiration is detrimental to plant growth.
photosynthesis→ convert light E into chemical E using CO2 and water
rubisco binds CO2 to initiate carbon fixation
photorespiration→ wasteful process where rubisco binds O2 instead of CO2— reduce photosynthesis efficiency
detrimental to plants growth when hot, high light intensity, and low CO2 concentrations
Summarize how biochemical and anatomical adaptations associated with the C4 photosynthetic pathway minimize photorespiration, thereby enhancing photosynthesis rates.
C4 pathways: reduces photorespiration (evolved independently several times→ great adaptation)
Pathway big picture: separating the light and dark reactions, occur in different tissues
spatial separation of events
Trade-off: need specialized cells (energy), need PEPcase
Ex. grasses on campus → # of C4 plants increases with temperature
Describe how crassulacean acid metabolism reduces water loss relative to the C3 or C4 photosynthetic pathways.
Crassulacean Acid Metabolism (CAM) pathway: during day stomates closed and night stomates open to get carbon
Pathway big picture: temporal separation of dark and light reactions
Nighttime CO2 uptake so water loss minimized during transpiration when evap rates are high
Ex. mostly succulents & epiphytic→ cactus and pineapples
Life history
the pattern of survival and reproduction (and growth) events that are typical for a species, essentially describing the key stages of an organism's lifecycle
Summarize the key characteristics that make up the life history of an organism.
age and size at sexual maturity
amount and timing of reproduction
survival and mortality rates
dispersal and dormancy
How genetics and the environment act as controls on life history traits.
genetic control
subject to natural selection→ favors survival and reproductive fitness
adaptations
environmental control
phenotypic plasticity— one genotype can produce diff phenotypes under different conditions
ex. toads omnivore morph selected in ponds not at risk for drying up and carnivore morph selected for in risky pons
What are the benefits and costs associated with sexual reproduction.
advantage: recombination
promote genetic variation→ better adaptations
disadvantage: cost of producing males
males cannot help grow population— only role is to provide half of genome
recombination can get rid of favorable genes
What are the benefits and costs associated with asexual reproduction.
advantage:
rapid population growth
less E and resources required
disadvantage:
lack genetic diversity→ vulnerable to environmental changes
Describe how additional complexity in a life cycle, such as larval and adult forms, may benefit a species.
→ at least two stages with different body forms that live in different habitats and eat different foods
metamorphosis→ abrupt transition bt larval and juvenile stages (insects)
benefits?
dispersal: movement of orgs or pops from their birthplace→ reduce competition, use outside resources, colonize new area, escape disease/predation
dormancy: suspend growth to survive bad conditions→ small seeds, spores, and eggs allow less metabolic energy to stay alive
Illustrate how the number of offspring may affect the size of those offspring.
organisms tend to produce large number of small offspring OR small number of large offspring
Explain how providing care to offspring may compromise other functions in adults.
More # in clutch— more chances of having offspring survive but more energy investment from parent
Less # in clutch— less energy to invest but fewer chances of offspring survive
optimize max # of offspring to survive→ trade-offs
How does resource allocation to offspring impact parent?
Allocating resources to reproduction can decrease individuals growth rate/survival rate/potential for future reproductive success
→ lower ability to forage, increase predation, increase risk of disease
Contrast the benefits and costs associated with small size in early life cycle stages.
benefits? lower E requirement, rapid reproduction, dispersal, access to niches
costs? higher predation, less competitive, vulnerable to environmental change
How adaptations at specific stages in a complex life cycle may benefit the species.
flexibility to respond to different selective pressures in different life stages
ex. animals larval stage allows for prioritizing feeding while adult for dispersal and reproduction
Compare the benefits of semelparity and iteroparity in the context of total lifetime reproduction of an organism.
semelparity→ reproduce once in a lifetime (ex. salmon)
benefit? maximize reproductive output (large # offspring at once) + energy efficient (one big investment)
cost? high mortality risk (failure means no chance of reproduction)
iteroparity→ reproduce multiple times in a lifetime (ex. humans)
benefits? multiple reproductive opps (if one fails future may succeed)
costs? energy trade-off (reproduction spread out means multiple investment periods)
Evaluate the environmental conditions that would favor the persistence of r-selected and K-selected species.
Live fast, Die young→ r–selection
Selection for high population growth rates→ frequent disturbances
Favor short life spans, rapid development, early maturation, low parental investment, high reproduction rates
Ex. most insects, small vertebrates (mice), weedy plants (flax)
Steady wins the race→ k-selection
Selection for lower growth rates in populations that are near or at k→ stable conditions
Favor long-lived, develop slowly, late maturation, invest heavily in each offspring, low reproductive rate
Ex. large mammals (elephant) and reptiles, oak and maple trees
Describe the trade-offs in plant allocation described in Grime’s competitive/stress/ruderal model.
→ categorizes plant strategies based on their adaptation to environmental stress and disturbance, classifying plants as competitors, stress-tolerators, or ruderals.
Stress→ any biotic factor that limits growth
Disturbance→ any process that destroys plant biomass
Triangular model:
Competitive (high comp)
Ruderal (high disturbance)
Stress-tolerant (high stress)
Show how differences in species size or age can be accounted for in describing the allocation of energy and resources to reproduction and other life history stages.
Size vs Age trade-offs:
growth vs reproduction energy allocation
survival vs offspring quantity
parental investment vs independence
How natural selection can lead to the evolution of adaptive behaviors.
Behavior is adaptive→ NS should favor individuals whose behavior make them efficient at…
foraging
getting mates
avoiding predators
How can behavior be grouped?
Proximate cause→ immediate, mechanical influence
hereditary, developmental, structural, cognitive, psychological, or physiological; aspects of behavior
Ex. bird migration→ find food
Ultimate cause→ historical reason why an organism has a trait in terms of NS
Why has this behavior been adapted?
Ex. snakes came from lizards who were able to open jaws wide… overtime as the legs dropped their prey changed and jaws continued to get larger/disconnect
Ex. bird migration→ season pattern where birds that migrated were able to survive and reproduce so migration was adapted
Explain the theory of optimal foraging by outlining the factors that influence the net benefit of foraging.
Optimal foraging→ NS works on organisms to maximize energy acquired per unit of feeding time
How much energy the animal gets relative to amount of time it spends searching (s) and handling/eat (h) food
Spend more time looking for prey than actually getting E gain→ move on
Summarize what determines optimal foraging in an area with different food densities with reference to the marginal value theorem.
marginal value theorem→ animals foraging in an area with patches of food/resources of different densities will deplete rich patches 1st and leave them once density of region is the same as average of the entire area
Describe how the presence of predators can impact foraging behavior.
avoid being see by predators
detect predators
prevent attack
escape once attacked
ex. antipredator behaviors: slugs have spikes, sea otters sleep with one eye open, butterflies confuse predators with eye-looking-wings
Describe examples of the behaviors utilized by animals to increase their access to mates.
sexual reproduction has high sexual dimorphism
males often larger and brighter, have weapons like horns, and perform dances or rituals to attract females
What conditions favor selectivity by females versus males?
anisogamy: eggs vs sperm in size (eggs have a reproductive cost)
females put more resources into raising offspring
reproductive potential higher for males than females
intrasexual vs intersexual selection
Intrasexual selection→ bt same sex
competition between males
Intersexual selection→ charming the other sex, courtship
sexual dimorphism
Examples of female choice selection hypothesis’ (2)
Handicap hypothesis: a male that can support a costly and uniquely ornament is likely to be vigorous, with overall high genetic quality
Ex. european green lizard– brighter males have lower rates of blood parasite infections and are selected for
Sexy son hypothesis: females receives indirect genetic benefits through her sons who will themselves be attractive females and produce many grand-offspring
Ex. stalk-eyed flies– females choose mates from their population of males when mixed with males of their own and outside populations
Females choose what they know!
Describe the potential benefits and costs of species living in groups.
Safer bc watch out for predators more
Ex. hawks predate pigeons (larger group–less likely to be eaten)
Easier to deprive area of resource
Ex. larger groups spend more time searching for food than eating
Optimal group size? There is a cost to joining a group at some point
population
Populations→ group of interacting organisms in the same place, at the same time, in the same species
population density
Density→ number of individuals per unit area or volume
Population size (“N”)
→ number of individuals in a population
density X area or volume occupied by population = estimate of “N”
Methods depend on species
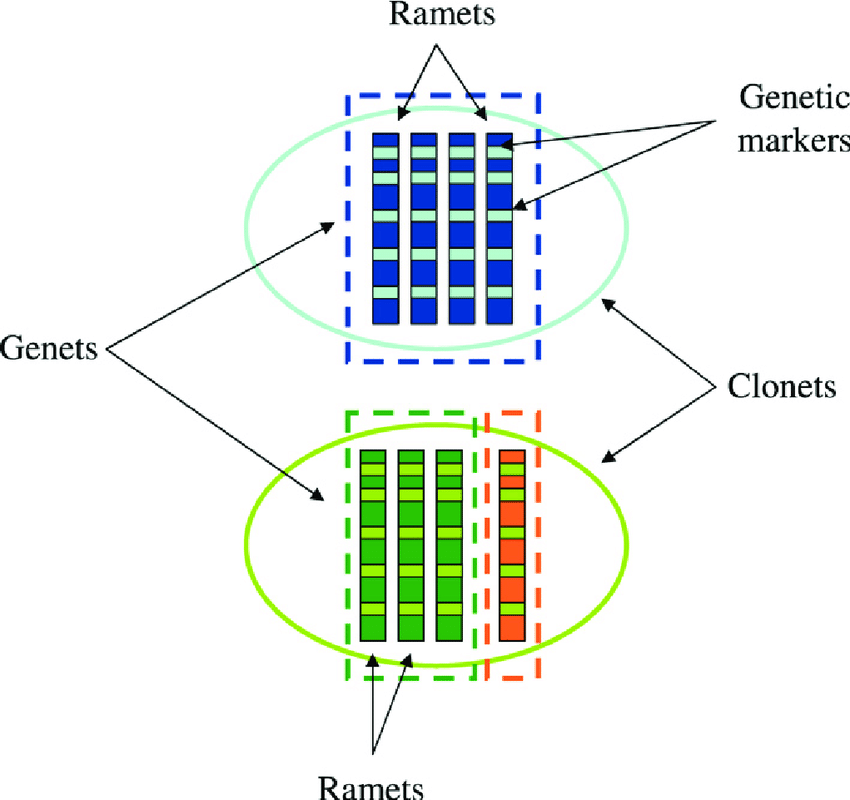
Compare the different ways in which individuals are defined, including the terms clones, genets, and ramets.
clone→ genetically identical individual from a single parent through asexual reproduction
genet→ group of ramets that originate from a single seed
ramet→ single physiological individual produced by clonal propagation
Compare the different methods used to measure the abundance of individuals within populations or species.
capture, mark, recapture at some distance away
remove individuals, then measure recolonization
measure colonization in empty sites
Describe the relationship between populations, metapopulations, and geographic ranges for species.
Population— group of interacting organisms in the same place, at the same time, in the same species
Subpopulations— one population connected through high rates of migration– population dynamics allows behaviors to be same
Metapopulation— multiple populations within a smaller area (higher rates of migration but low enough to have own dynamics)
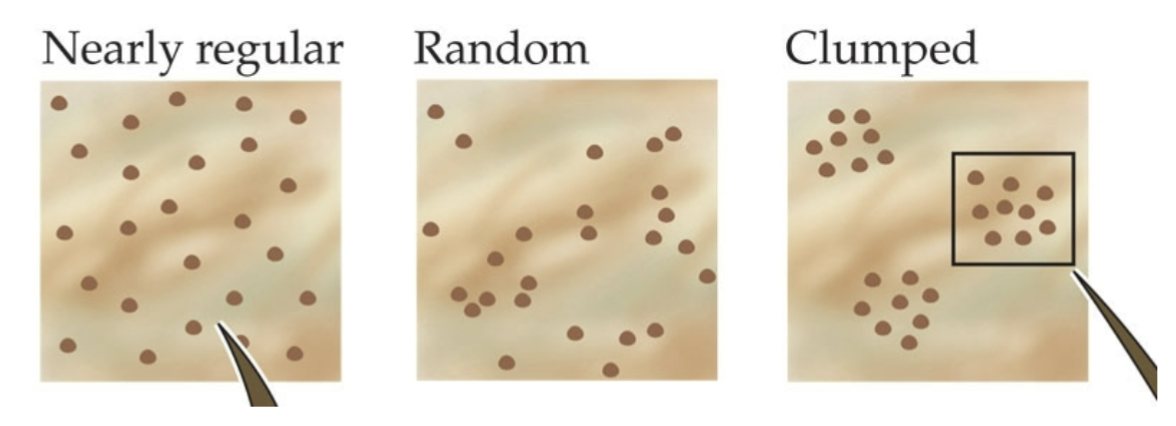
Compare the different dispersion patterns of populations.
dispersion of individuals within a pop ~ spacing with respect to one another
regular distribution→ over dispersed
random distribution→
clumped (heterogenous) distribution→ under-dispersed
Describe the ways clumped distribution occurs.
species kept out of its fundamental niche by competition, pathogens, predation
fundamental vs realized niche
fragmented habitat
edge effect- edge of habitat are different from center
different temp/winds
easier predation, more human disturbance
ex. nest parasites thrive in edge bc replace eggs with own
corridor- linkage between two suitable habitat patches
Describe the factors important to the suitability of habitat for populations and species.
The suitability of habitat depends on both abiotic and biotic features of the environment, including factors that affect physiological tolerances, resources, and species interactions.
Explain how the distribution and abundance of species can reflect their evolutionary and geologic history.
evolutionary?
distribution reflects origins, adaptation, and diversification
ex. marsupials abundant in Australia due to early isolation→ adaptive radiation bc of continental drift
geologic?
events like continental drift, glaciation, mountain formation, etc.
Differentiate source and sink sites (context of migration).
source→ local demographic surplus arises in good quality habitats
provide migrants to sink habitats
sink→ local demographic deficit occurs in habitats of poor quality
habitats are mainatned with migration from source areas
Describe how the rates of colonization and extinction of populations affect metapopulations.
→Higher rates of migration but low enough rates that each population has own dynamics
Pattern of extinction and recolonization of patches
recolonization→ new subpops establish in unoccupied habitats
extinction of subpops causes decline in metapop
Hard to prove– few real examples
List the different patterns of population growth observed in nature.
exponential growth→ rapid increase in number of individuals in the population (like J shape)
logistic growth→ similar to exponential but stabilizes at carrying capacity at the end (like S shape)
fluctuating→ variation in population going up and down (slow growth rates)
cycling→ pattern of up and downs depending on season
Describe the special case of population cycling.
Not damped oscillation→ N really high at one end and really low other end– what does nutrient level allow→ overshoots and undershoots depending on timeline
Damped oscillation→ up and down around carrying capacity
No oscillation→ slow growing species where take long time to reach carrying capacity or really fast growing species

Justify why fluctuations in population growth rate can increase a population’s risk of extinction.
fluctuating populations show slower growth rates- result in smaller population sizes with greater risk of extinction
List and describe the ways that chance events can drive small populations to extinction.
genetic drift→ random increase in freq if bad alleles, loss of good alleles
demographic stochasticity→ by chance particularly low survival or fecundity rates
catastrophes→ environmental stochasticity
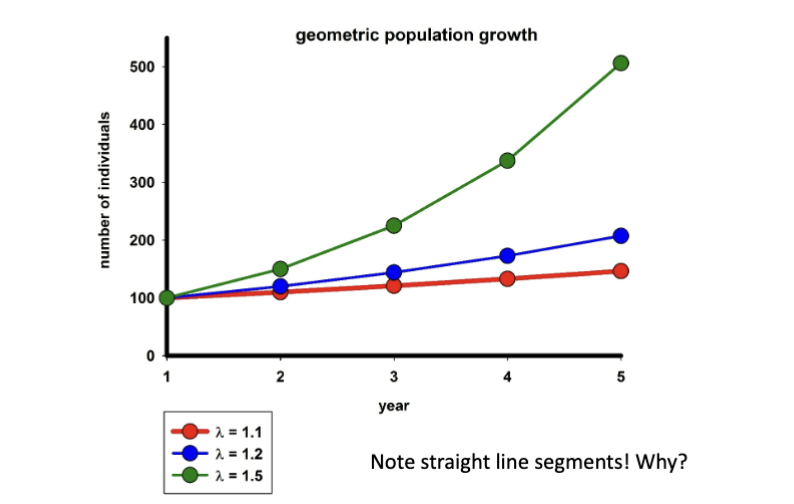
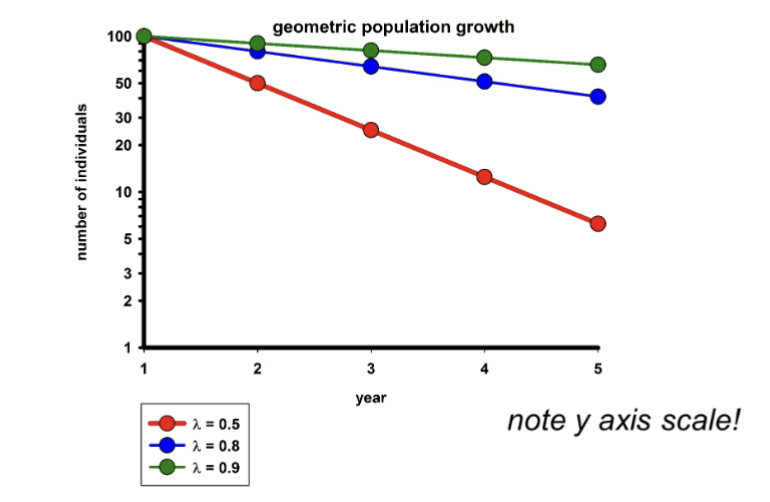
Define geometric population growth.
→ also known as discrete model, measured population growth in set time intervals (like once a month)
population begins at N0
constant growth rate of λ
λ>1 means pop grew
λ<1 means pop declined
λ=1 means pop size constant
N1=N0*λ
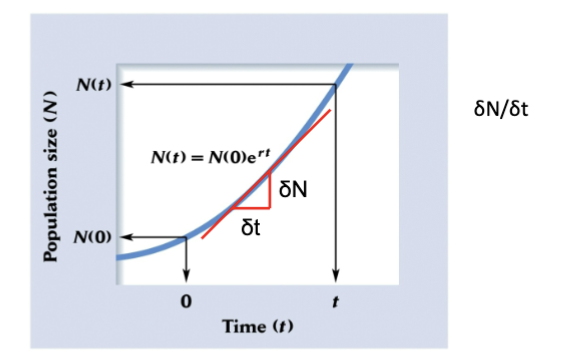
Define exponential population growth.
→ birth and deaths happen continuously and rate at which they happen does not chance over time
parameter is r:
r>0 means pop grew
r<0 means pop declined
r=0 means pop size constant
Nt=N0*ert
Define density-independent factors and describe how they affect population size and growth rate.
→ affect per capita growth rate independent of population density
ex. natural disasters like tsunami, forest fires, hurricane
impact? direct mortality, reduced reproductive success, population decline
Define density-dependent factors and describe how they affect population size and growth rate.
→ limiting factors that affect population size and growth rate based on population density
ex. competition, disease, predation
positive density dep→ positive feedback loop
N increases→ survival or fecundity increases
ex. whales hunted, lower N means less chance of mating
negative density dep→ negative feedback loop
N increases→ survival or fecundity decreases
ex. too many sheep in New Zealand led to overgrazing
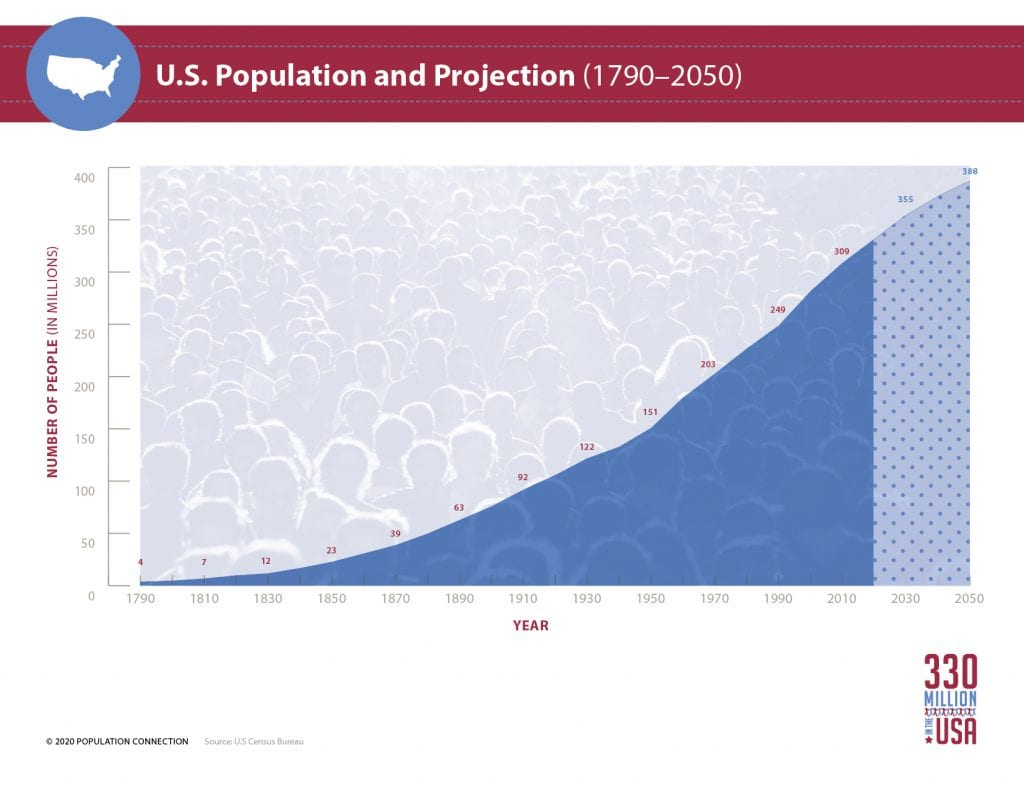
Describe the growth patterns of the U.S. population.
Combination of logistic and fluctuated growth
Justify the use of life tables to determine population growth and size.
→ provide a structured method to analyze age-specific mortality and fertility rates
-can use them to make pop growth prediction
-can compare diff populations
Describe how age structure influences population growth and population size.
→ age structures shape fertility and reproductive stages
age-based diff in avg fecundity
age-based diff in survival rates
Ex. compare
Sea turtle pop A mostly animals > 20 yo (reproductive)
Sea turtles mostly juvenile <5 yo (pre-reproductive)
Describe how size structure influences population growth and population size.
size-based diff in avg fecundity
size-based diff in survival rates
Ex. plants, coral, etc: differences among individuals size-based, more than age-based
Describe how sex structure influences population growth and population size.
sex-based diff in avg fecundity
Sex-based diff in survival rates
Ex. each female has 5 offspring/yr
Moud pop A has 50 males & 50 females
Mouse pop B has 80 males & 20 females
Compare the three types of survivorship curves.
Type 1 survivorship curve: most individuals survive to old age
Ex. doll sheep→ make it to old age and get slow and die
Type 2 survivorship curve: individuals face a constant risk of mortality at all ages
Ex. bird has constant mortality
Type 3 survivorship curve: most individuals die young
Barnacle→ make lots of offspring but few attach to rocks so immediate newborn high death rate
Outline the simple epidemiological models categories (3)
Susceptible→ can age out as immune system grows
all hosts susceptible when I and R are ~0
Infected
Removed (or recovered) → recover naturally or vaccinated
need majority of pop in this section to stop spread of disease
Epidemiology
→ science of disease dynamics at the level of the host population–essentially applied populated dynamics
Work for university, NIH, public health, etc
Not same as pathogen dynamics within a host (that is molecular biologist)
Structures of populations
Stage structure→ different selective pressures (and fitness) on individuals within a population at different life stages
spatial structure→ refers to the geographic arrangement of individuals or populations
abundance
density
dispersal
temporal structure→ examines how populations change over time
predation
competition
disease
Behavioral Ecology
→ study of the ecological and evolutionary basis of animal behavior
Behavior= genes + environment
Behavior is adaptive→ NS should favor individuals whose behaviors make them efficient at…
Foraging
Getting mates
Avoiding predators
Trade-offs?
Foraging vs Survival
Prey choice vs Time spent
Living in a group→ don't get eaten but still get to eat!
Sexual selection
→ individuals with certain characteristics gain an advantage over other of the same sex solely with respect to mating success
Ecological factors affect mating system
Dependent on resource availability and distribution
Resources are clumped→ one male controlling territory so more polygyny
Resources scattered evenly→ monogamy more common
Physiological ecology
→ study of interactions bt orgs and their environment and how these interactions influence their survival and determines their geographical ranges
Availability of energy and resources
Extreme conditions can exceed tolerance limits
Plants cant move→ good indicators of physical environment
Climate envelope
→ range of conditions over which a species occurs, can predict response to a climate change
Actual distribution: where a species currently lives
Potential distribution: where a species could live→ climate envelope
Ex. Aspen trees→ limitations: flowers surviving frost, fruit ripening
How to organisms and populations cope with a changing environment
Tolerance
Avoidance: migration, range shift (butterfly go up mountain for ideal temp), dormancy
Acclimate: individual, short-term, reversible process
Genetic underpinning
Adaptation: natural selection meaning this is on population/species level, long-term (genetic change)
What are ecotypes?
→ populations with different adaptation to unique environments
Ex. hypoxia at high altitudes
Andean→ human pop have high RBC concentration and large lung capacity
Tibetan→ human pop have faster breathing rates and higher blood flows
How do plants deal with dry vs salty soils?
Dry soils:
Higher concentration of organic solutes
Grow only during wet season
Close stomates
Shed small roots during drought
Store water (succulents)
Small leaves hence cool– evap slower
Thick boundary layer
Salty soils:
Salt exclusion (proton pump to get rid salt)
Salt excretion
Organic solutes to maintain (-) root potential
Salt tolerance
What is water potential and how does it look on a plant?
Potential→ water moves from places of higher water potential to lower water potential (from + to - potential)
