Week 5 - Risk & Uncertainty
1/26
There's no tags or description
Looks like no tags are added yet.
Name | Mastery | Learn | Test | Matching | Spaced | Call with Kai |
|---|
No analytics yet
Send a link to your students to track their progress
27 Terms
Risk is
uncertainty that can be quantified
Risk lovers
Someone willing to take a fair bet
Risk Lovers will avoid
a very unfair bet
Risk Averse
Someone who isn’t willing to take a fair bet
Risk averse people avoid
Any risk/seek to reduce it
Risk Neutral
Someone who is indifferent to taking a fair bet
Risk neutral people avoid
Unfair bets
Explain - marginal utility and what it is
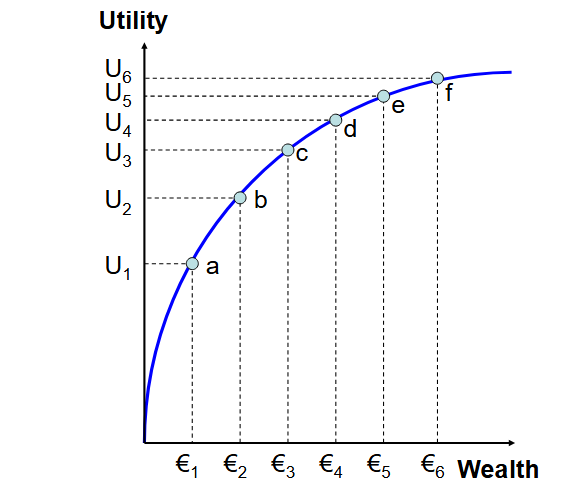
Risk Averse
Diminishing marginal utility of wealth
Concave to wealth axis
Diminishing marginal utility of wealth
Each € provides less utility than the € before it
What kind of risk is it
Utility curve is
What’s the marginal utility
What does this show us in terms of risk
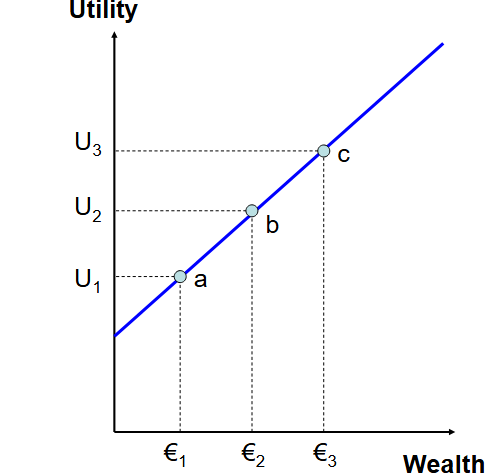
Risk Neutrality
Straight line
Constant marginal utility of wealth
Risk neutral person will choose highest EV even if its riskier
Constant Marginal utility of wealth
Each € provides same amount of utility as previous €
What kind of risk is it
Utility curve is
What’s the marginal utility
What does this show us in terms of risk
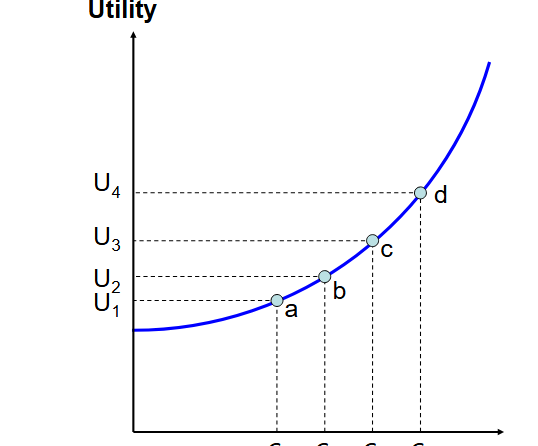
Risk preferring
Convex to wealth axis
Increasing marginal utility of wealth
They prefer uncertain/risky options that give higher rewards
Increasing marginal utility of wealth
Extra utility from each extra € is more utility than each previous €
Risk pooling
Combining several risks to make overall outcome more predictable
Why do insurance companies risk pool?
Ensures they receive more than they pay out
Insurance companies would provide insurance for risks they can’t
Diversify
E.g. War and natural disaster
Diversifying works depending on
Extent to which it works depends on degree to which outcomes are related
Outcomes can be
Positively correlated
Negatively correlated
Uncorrelated
Can elimainate risk if 2 outcomes are
Perfectly negatively correlated
Variance
How far figures are spread from the mean
Variance formula
probability of outcome X payout
Standard Deviation
Shows how close to the mean outcomes are
Low Deviation
High deviation
Close to mean
Far from mean
Expected Value formula
Value of each possible outcome X probability of outcome
Dispersion
The greater the level of dispersion, the greater the lvl of risk associated w/ choosing an alternative decision
Range
Difference between the 2 most extreme outcomes
Expected Utility
Rational person will maximise Expected utility