PBSI 301 Exam 1 Study Materials: Key Concepts in Psychology
1/96
There's no tags or description
Looks like no tags are added yet.
Name | Mastery | Learn | Test | Matching | Spaced |
|---|
No study sessions yet.
97 Terms
What is statistics?
a set of tools and techniques used for describing, organizing, and interpreting information or data
What are the 3 main goals of statistics?
Description, Prediciton, Explanation
Description
the process of summarizing data and providing insights about behavior patterns.
Predictive Validity
(forecasting future behavior based on observed patterns, ex: predicting academic performance based on study habits)
Explanation
(identifying the underlying causes of a behavior, ex: boys are more competitive; rule-based games allow for more competition)
What are descriptive statistics?
used to organize and describe data
What are inferential statistics?
- the 'next step' after description
- allow you to INFER the truth about a larger group of people from a smaller group of people
What are samples?
- the group you actually collect data from
- this is a smaller group (subset) of the larger group you are interested in
- ex: 100 students asked in the MSC
What are populations?
the group you are actually interested in drawing some conclusions about
- ex: all A&M students
What is a variable?
- something that can change or have different values for different individuals
- represents the concepts we are interested in
- ex: favorite baseball team, major, age, gender
What is data?
- information collected from the sample on the variables we are interested in
- the responses given by the members of our sample
- ex: Rangers, Astros, Royals, & Engineering, Psychology, & 8, 19, 21, & M or F
What is continuous data?
- data measured on a continuum
- all numbers between two endpoints are possible scores
- ex: height, weight, age, self-esteem
What is categorial data?
- data that sorts people into categories (only so many options for the variable)
- ex: gender, major, experimental condition
What is central tendency?
- a single number that represents a group of scores
- mean, median, & mode
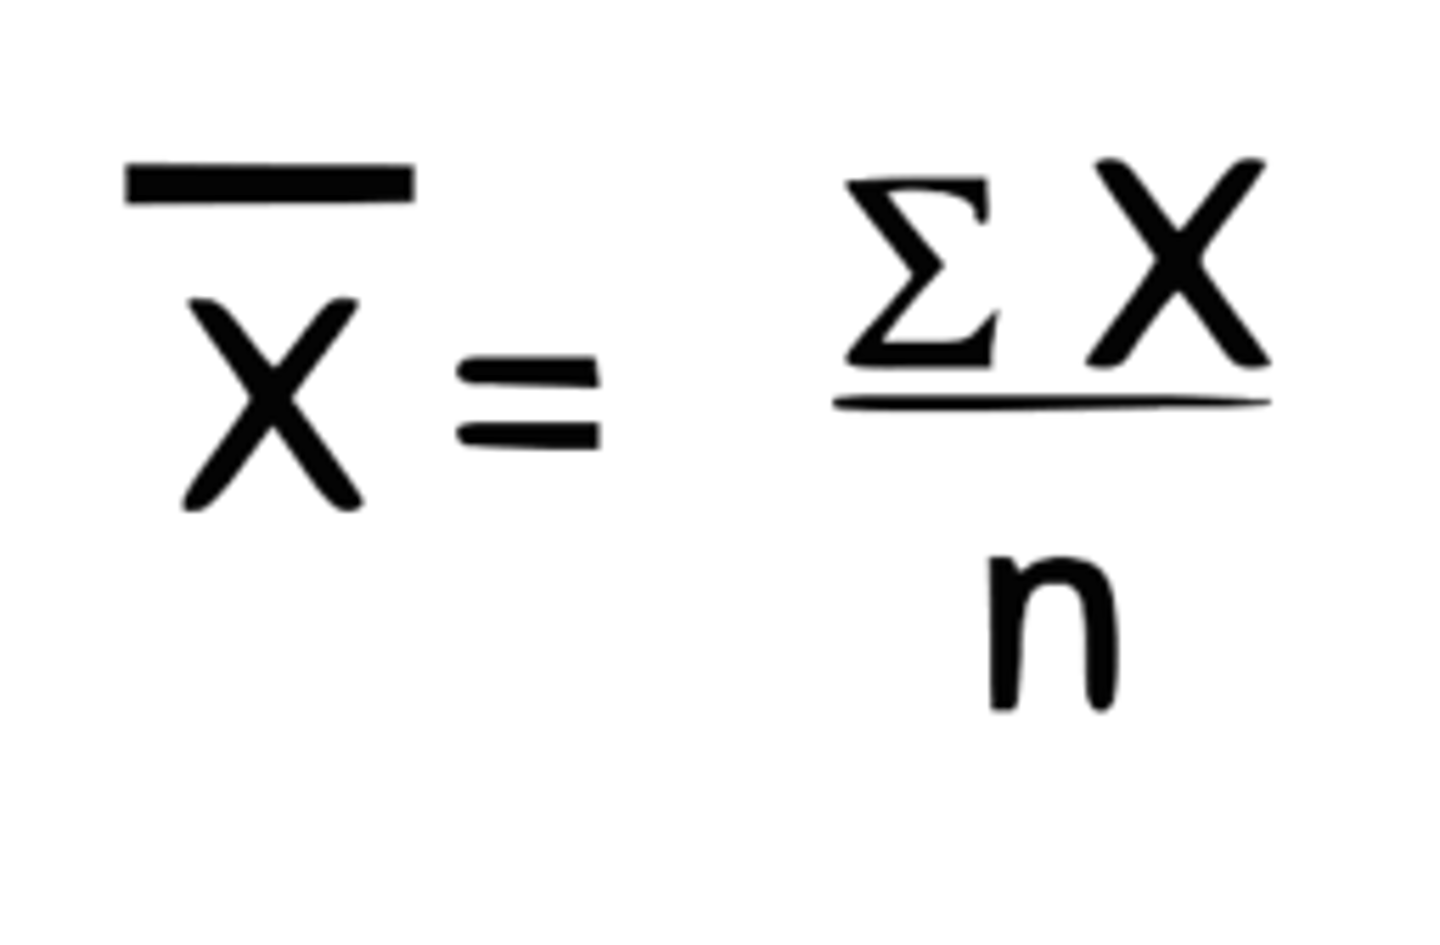
How do you calculate the mean (average) & what is the formula?
add up all the individual scores and divide them by the amount of scores there are
How do you calculate the median (midpoint)?
list values in order (either highest to lowest or lowest to highest) & find the middle-most score
How do you calculate the mode?
the value that occurs most frequently in the data set
What is bimodal?
2 modes
When do you use mean?
When the data is continuous and you don’t have any extreme scores (used the most)
when do you use mode?
When the data is categorical
when do you use median?
When the data is continuous, and you think the mean is misleading because of extreme scores
Why is variability important?
It measures the spread of data points in a dataset, indicating how much individual scores differ from the mean.
What is variability?
It provides insight into the overall distribution of scores, highlighting the degree of diversity in data.
What are the measures of variability?
range, standard deviation, & variance
How do you calculate range?
computed by subtracting the lowest score from the highest score
Problems with range?
- ignores the middlemost values
- puts too much emphasis on extreme scores
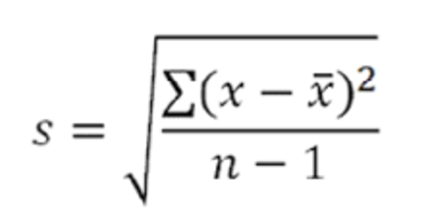
What is standard deviation?
represents the average amount of variability in a set of scores
How do you calculate standard deviation & what is the formula?
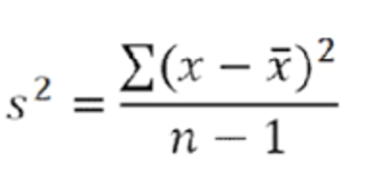
How do you calculate variance & what is the formula?
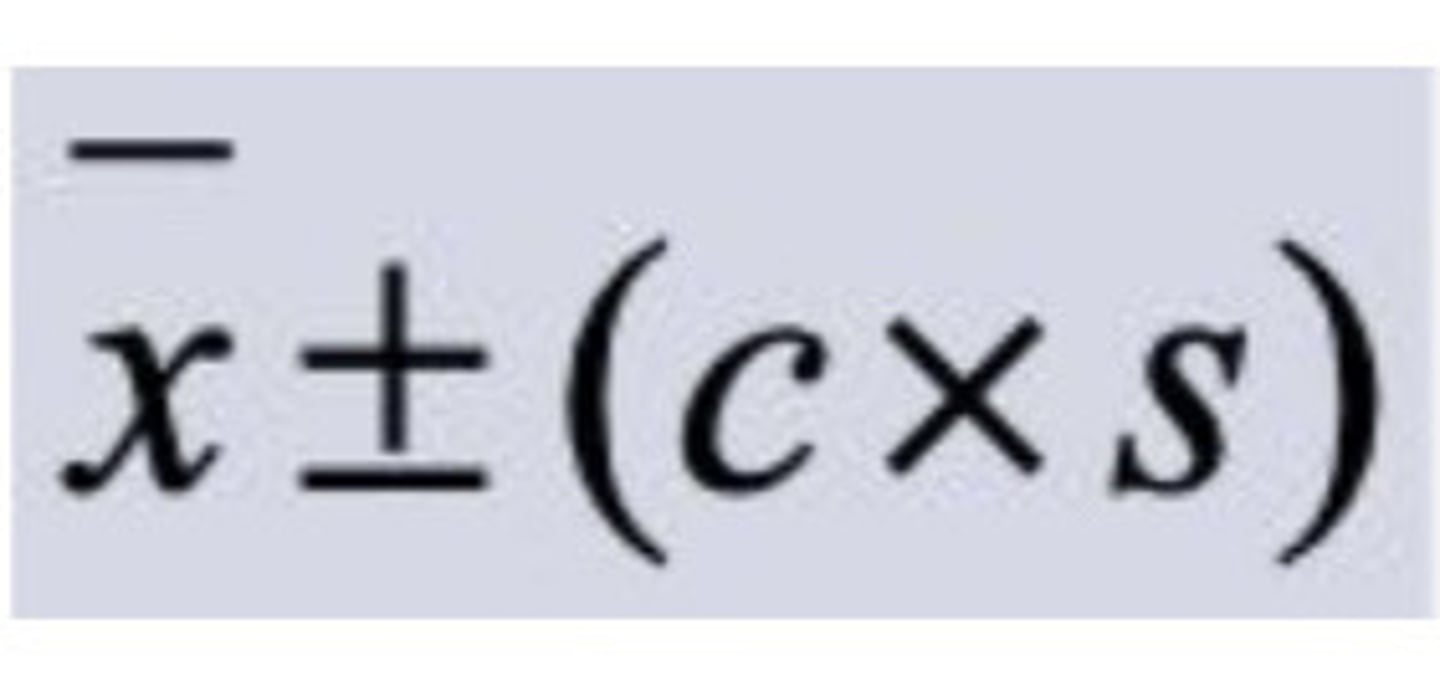
How do you identify extreme values?
standard deviation!! anything that is 2 SD's away is a potential outlier and anything that is or is more than 3 SD's away is more likely an outlier
What is the outlier formula?
How can you use standard deviation to understand an individual data point?
it can help tells us how much the individual data points deviate from the average value
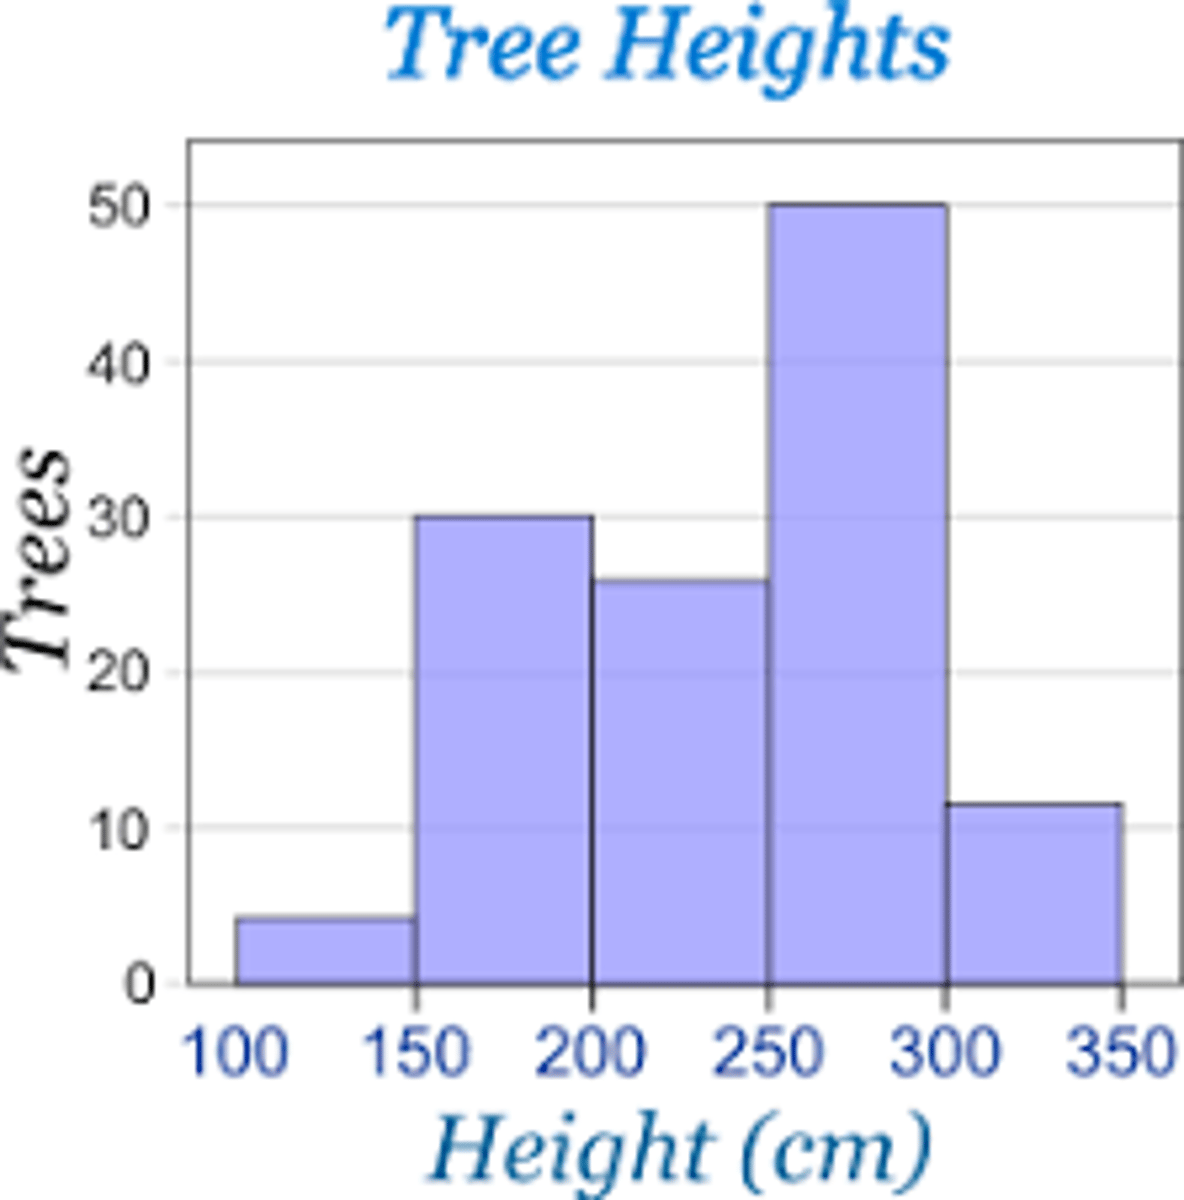
What are histograms?
- allow us to see the distribution of our data
- the height of each bar is the number of times each value occurs in our dataset
-bars touch each other
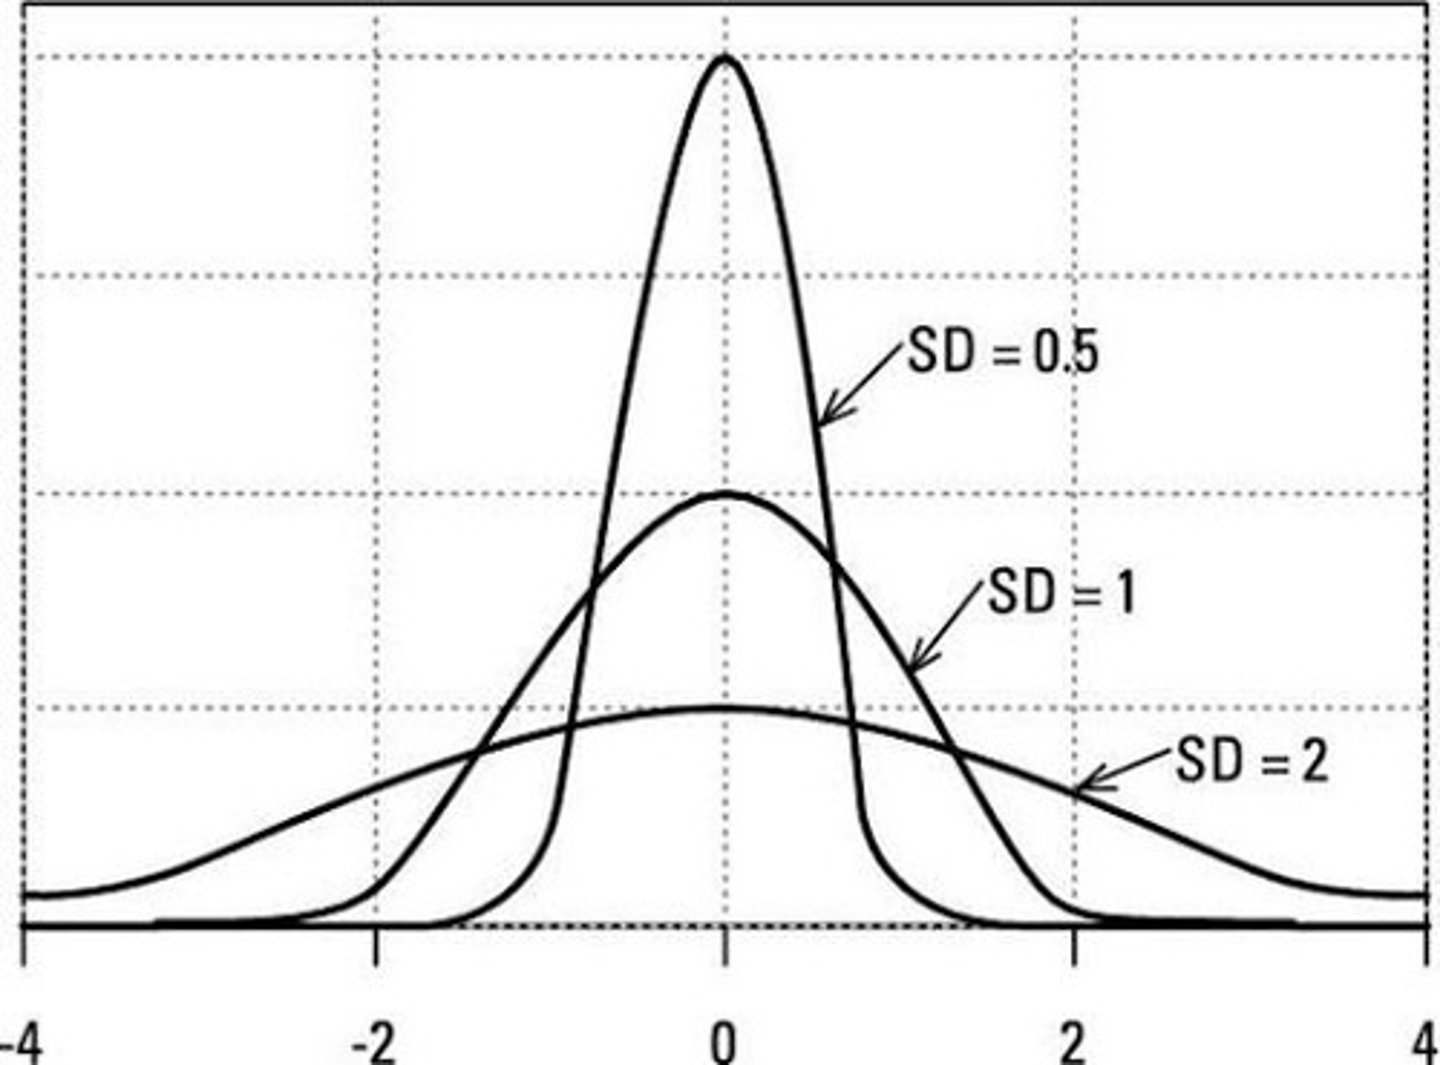
Distributions can vary in what 4 ways?
central tendency, variability, skewness, kurtosis
This graph has?
the same central tendency but different amounts of variability
What is skewness?
- the lack of symmetry of a distribution
- reflects where the mean/median/mode are in relation to each other
Negative Skewness
tail points to the left
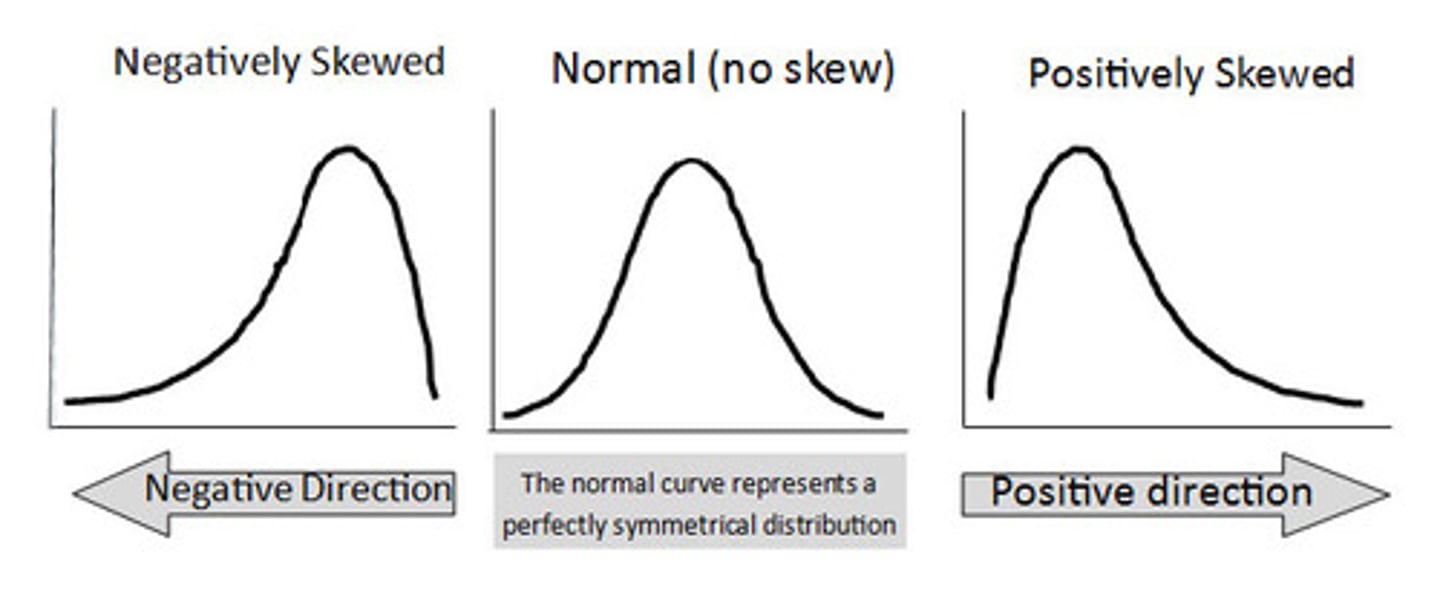
Positive Skewness
tail points to the right
What is kurtosis?
refers to how peaked vs. flat the distribution is
platykurtic
LOW kurtosis, relatively flat, more variability
leptokurtic
HIGH kurtosis, relatively peaked, less variability
mesokurtic
normal
Floor effect
occur when the opposite happens, i.e., a considerable percentage of participants obtain the worst or minimum available score.
ceiling effect
occur when a considerable percentage of participants score the best or maximum possible score
Bar graphs
show the frequency of categorical responses/bars have spacesbetween them to indicate distinct categories.
What should you beware of regarding misleading graphs?
beware of the scale of the axis!!!
What are correlations?
- they answer the question "What is the relationship between two variables?"
- when members of our sample have scores on 2 variables (x & y)
When should scatterplots be utilized?
to determine whether or not two variables have a relationship or correlation
What is the strength of a correlation?
- the magnitude of the coefficient (or how far it is from zero) tells us how strong the relationship is
- if r = 0, then no relationship
- if r = -1 or 1, then perfect relationship
What does the strength of a correlation tell us?
strength of correlation tells us how close the relationship is to a perfect relationship
What is the direction of a correlation?
the sign (+ or -) of the correlation coefficient tells us the direction of the relationship
Positive direction
scores on the variables move in the same direction, as the value of one variable goes up, the values of the other variable also go up (direct)
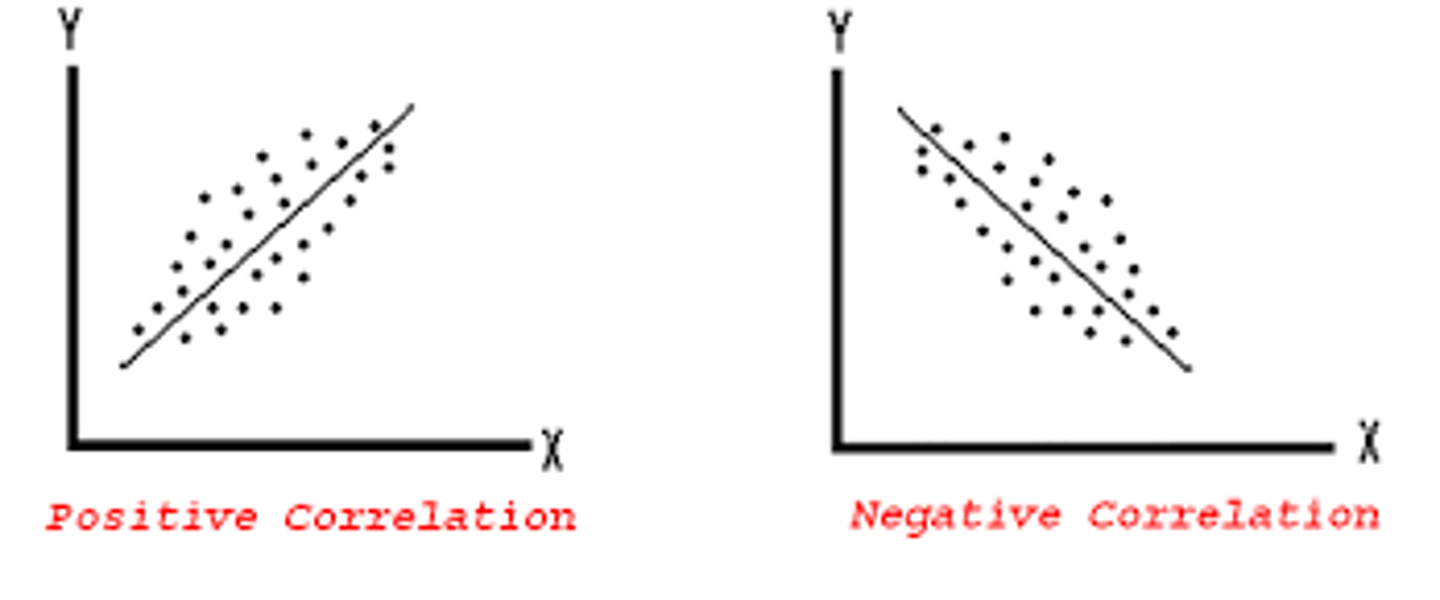
Negative Direction
scores on the variables move in opposite directions, as the value of one variable goes up, the values of the other variable go down (indirect)
What are limitations of correlation coefficient?
They do not imply causation, can be influenced by outliers, and may not account for confounding variables. They only indicate the strength and direction of a linear relationship between two variables. Only linear!
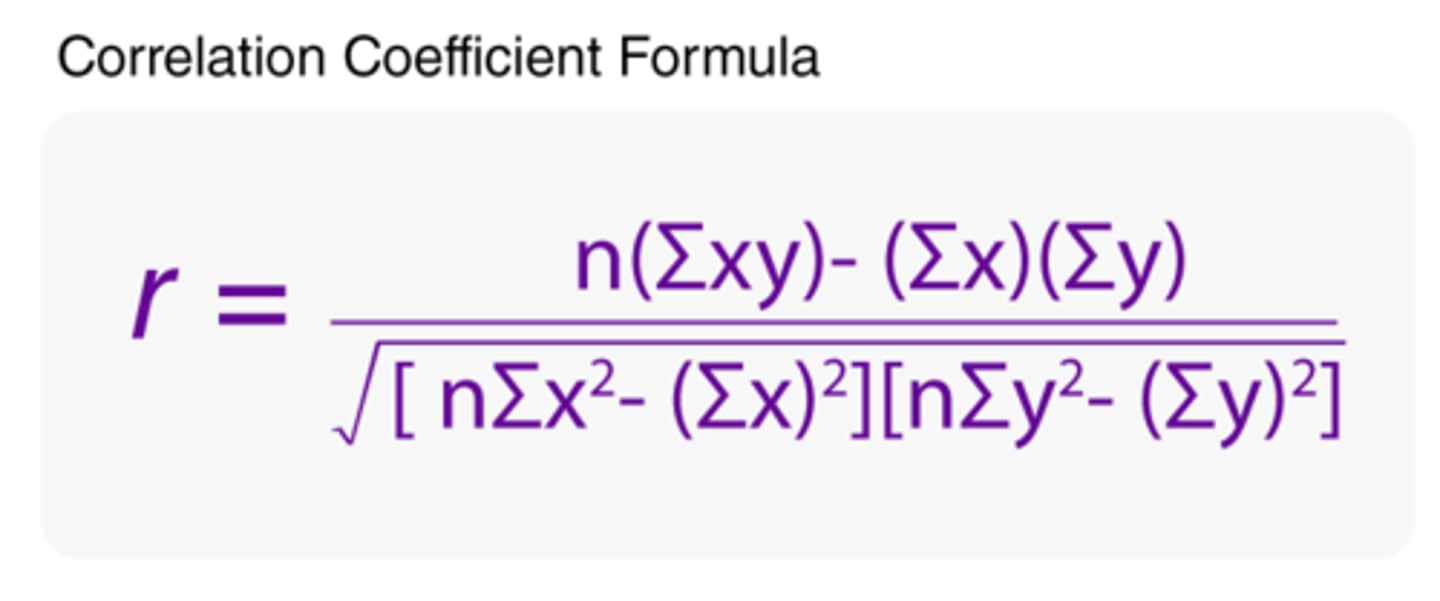
How do you calculate the correlation coefficient & what is the formula?
How do you report a correlation coefficient?
Reported with the strength, direction, and value of r, followed by a brief interpretation
What is the coefficient of determination?
A statistical measure that explains the proportion of variance in one variable that can be explained by another variable. It is denoted as R² and ranges from 0 to 1.
What's a correlation matrix?
A correlation matrix is a table that displays the correlation coefficients between multiple variables, showing the strength and direction of their relationships. It is commonly used in statistics to summarize data and identify patterns.
What is the coefficient of alienation?
shows the proportion of variance that is not explained by the correlation. It is the opposite of r² and is sometimes called the coefficient of non-determination.
Correlation vs. causation?
- correlation DOES NOT EQUAL causation
- we cannot say that age causes happiness, we can never definitively assume causation from a correlational relationship
- reverse causation, reciprocal causation, & third variable problem
What is measurement?
the act or process of assigning numbers to phenomena according to a rule
What are the three types of measurements?
(1) behavioral measures
(2) self-report measures
(3) physiological measures
What are the four types of measurement scales (least precise to most)?
(1) nominal scales
(2) ordinal scales
(3) interval scales
(4) ratio scales
What is a (nameable) nominal scale?
- measures that split people into mutually exclusive categories
- ex: hair color, college, major, political party
What is an (ordering) ordinal scale?
a measurement scale that puts things in order or rank, but the differences between the ranks aren’t equal or known.
What is an interval scale?
a level of measurement that has ordered values with equal distances between them, but it lacks a true zero point. For example, temperature in Celsius or Fahrenheit is measured on an interval scale.
What is a ratio scale?
- similar to interval scale, but 0 has a specific meaning
- ex: error rates, money, number of years in college
Independent Variable
The variable that is manipulated or controlled by the experimenter to observe its effect on the dependent variable.
Observed
the score you actually got
True Score
the true reflection of what you really know
What is an error score (measurement score)?
discrepancy between observed score and true score
What is reliability?
the consistency or reproducibility of data collected using the same measure/method
What are the four types of reliability?
1) test-retest
(2) parallel forms
(3) internal consistency/cronbach’s alpha
(4) inter-rater
What is test-retest?
seeing how reliable a test is by testing and then retesting a group later
What are parallel forms?
give two different forms of the same test to the same group
What is internal consistency/cronbach's alpha?
- asking the same questions in different ways to see how well the measure is
- Cronbach's Alpha (α) is the number that reflects the degree of internal consistency (the closer to 1 the better)
What is inter-rater?
- how reliable are the raters/judges
- testing how consistent the observations are made by two people
- inter-rater reliability = number of agreements/number of possible agreements
What is validity?
the degree to which a test measures what it says it measures
What are the three types of validity?
(1) content
(2) criterion
(3) construct
What is content validity?
the extent to which the measurement includes all of the major elements relevant to the construct being measured
What is criterion validity?
the extent to which a measure reflects what it should right now and/or in the future
Concurrent Validity
Alignment with current theory/behaviors
Predictive Validity
alignment with future outcomes/behaviors
What is construct validity?
the degree to which a test measures what it claims to be measuring
convergent validity
does the measure relate to other things it should, ex: statistics and math proclivity
discriminant validity
does the measure NOT relate to things it shouldn’t, ex: statistics and English proclivity
What are the four sections of a research paper?
Introduction, Methods, Results, Discussion
What is reverse coding?
A method used in surveys where negatively worded items are scored in the opposite direction to ensure consistency in responses. This helps to reduce response bias and accurately assess underlying constructs.
0 to .2
weak or no relationship
.2 to .4
weak relationship
.4 to .6
moderate relationship
.6 to .8
strong relationship
.8 to 1
very strong relationship
dependent variable
The variable in an experiment that is measured to determine the effect of the independent variable. It is expected to change in response to alterations made by the researcher.
behavioral measures
Methods of assessment based on observable actions or responses of individuals. These measures often include tasks or tests that reveal psychological constructs through performance.
self-report measures
Tools that gather data on an individual's thoughts, feelings, or behaviors through questionnaires or surveys, often relying on personal insights.
physiological measures
Data collected through biological or physical responses, such as heart rate or brain activity, to assess psychological states.