WEEK 1 - introduction, data and experiments
1/39
There's no tags or description
Looks like no tags are added yet.
Name | Mastery | Learn | Test | Matching | Spaced | Call with Kai |
|---|
No analytics yet
Send a link to your students to track their progress
40 Terms
why should data be summarised?
- Large sets of numbers are hard to learn from
- We need to take steps to simplify and summarise the number into something more digestible
- A good start is simply to count how often each number occurs
what is the x axis split into on a histogram?
bins
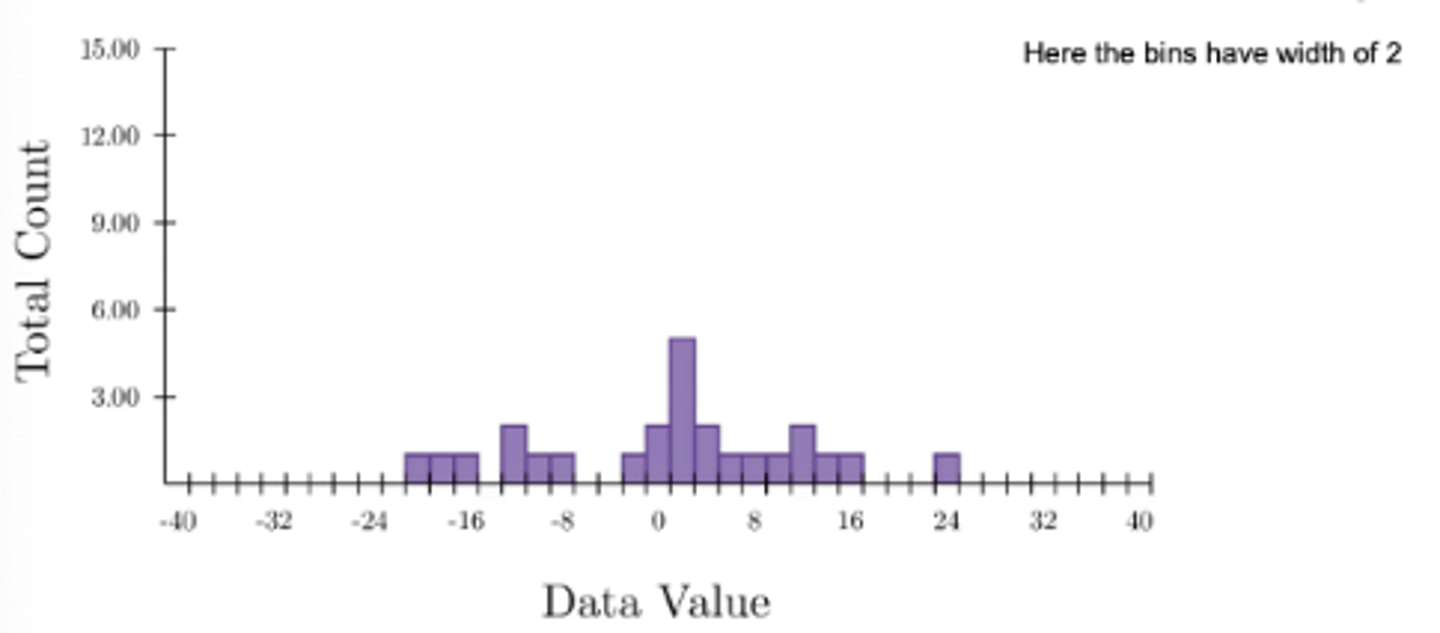
what does a histogram look like for continuous data?
The x axis is split into bins
Each bin covers a set range
Here the bins have a width of 2
what do histograms visualise?
the distribution of a data set
what does increasing the number of bins on a histogram do?
gives it more resolution
BUT
can make the distribution noisier as well (especially with a small number of samples)
what are the shape of histograms described by?
mean
variance
skewness
kurtosis
what is the mean in terms of histograms?
the mean is the average value of the data, representing the balance point of the distribution along the x-axis
what is variance in terms of histograms?
variance measures how spread out the data is—how far the bars (data values) are, on average, from the mean.
what is skewness in terms of histograms?
skewness describes the asymmetry of the distribution—whether the data has a longer tail to the right (positive skew) or to the left (negative skew).
what is kurtosis in terms of histograms?
kurtosis describes how peaked or flat the distribution is, and how heavy the tails are compared to a normal distribution
what are the types of distribution that reflect the differences in the underlying data set?
Normal (Gaussian): Symmetric, bell-shaped
Uniform: Data evenly spread
Skewed: Asymmetric (left-skewed or right-skewed)
Bimodal: Two peaks
Multimodal: More than two peaks
what is normal distribution?
a normal distribution appears as a symmetric, bell-shaped pattern, with the tallest bars in the center (around the mean) and bars decreasing evenly on both sides
what is uniform distribuion?
a uniform distribution appears flat, with all bars having roughly the same height, meaning the data is evenly spread across the range
what is skewed distribution?
a skewed distribution is asymmetric, with most data on one side and a long tail on the other—right-skewed if the tail is to the right, left-skewed if the tail is to the left
what is bimodal distribution?
a bimodal distribution has two distinct peaks (modes), indicating two common values or groups in the data
what is multimodal distribution?
a multimodal distribution has more than two peaks, showing multiple frequent values or clusters in the data set
where is the data point added?
to its corresponding value
where is each data point in the data set added?
to its bins until the whole data set is displayed
- can gradually see the shape of the distribution as more data comes in
what is research methods B?
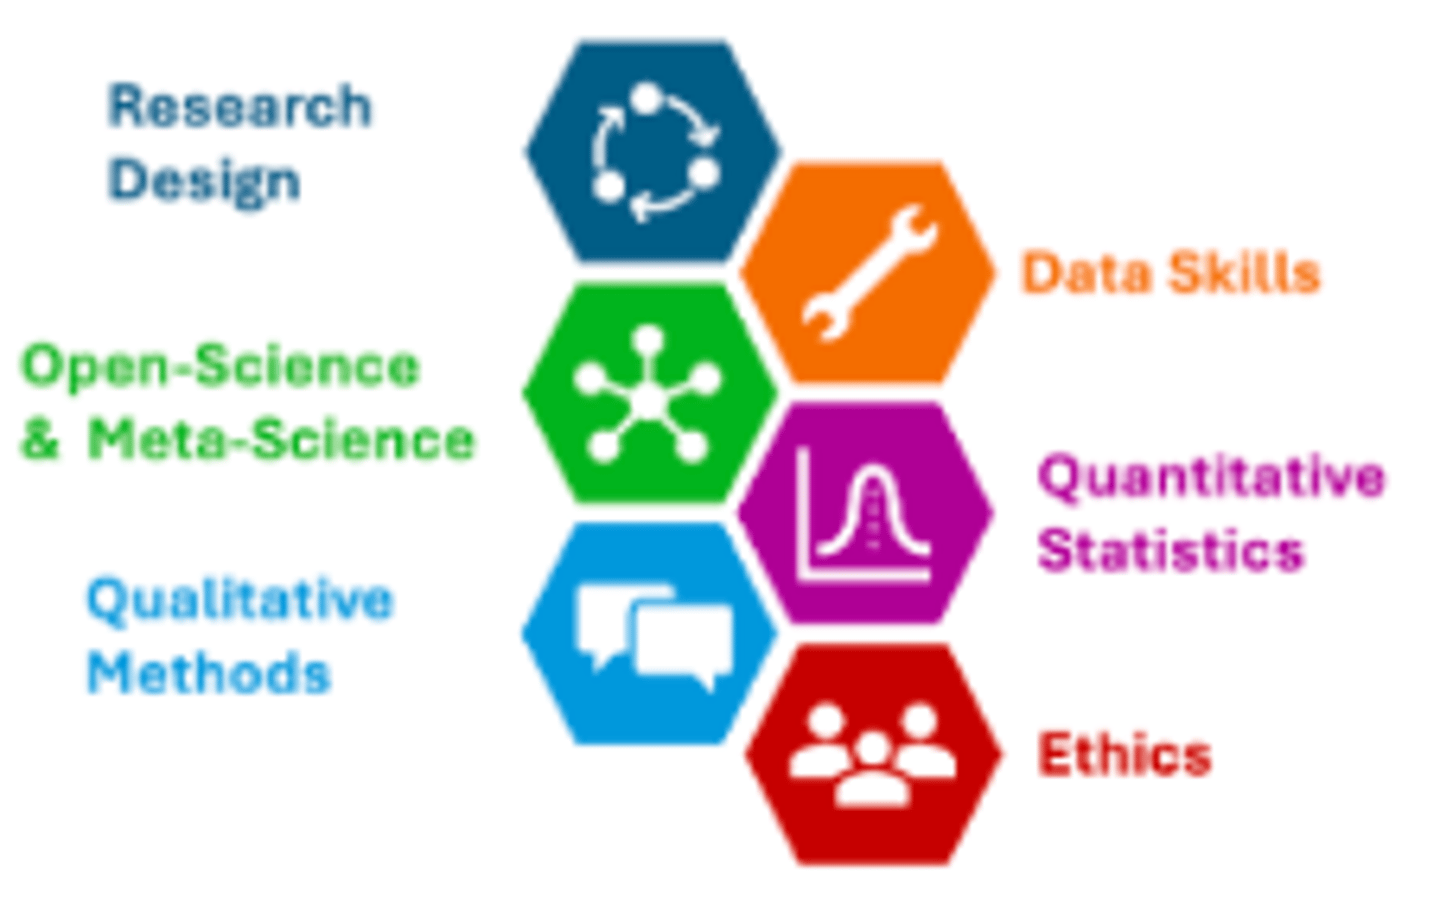
Transferrable skills
Building a toolkit for psychological research
Can be applied to other modules
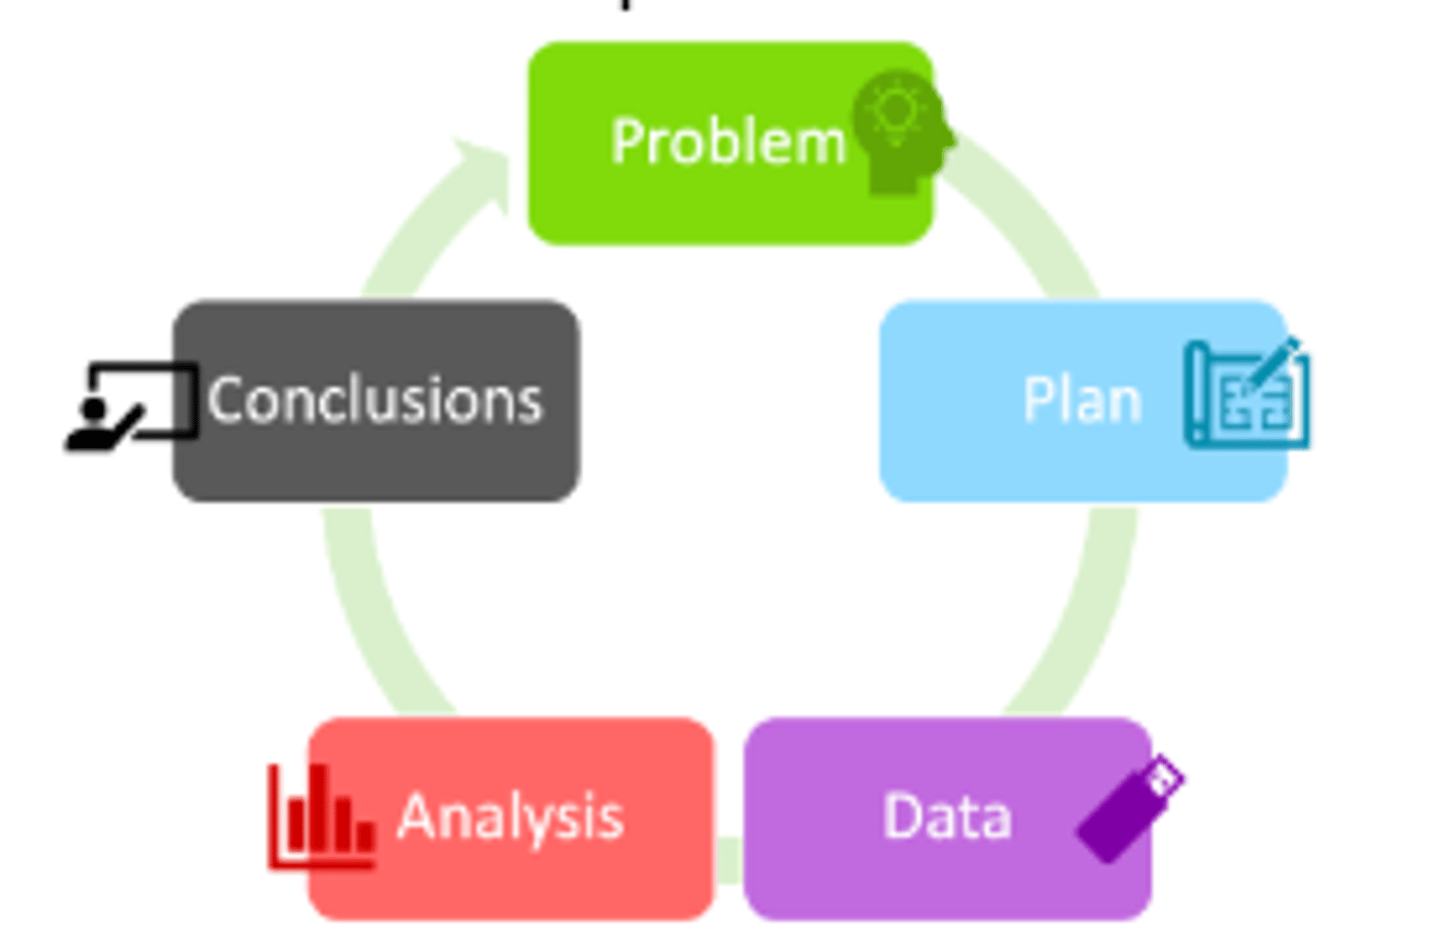
what are the practical aspects of research?
what is jamovi?
Intuitive graphical interface for analysis
Straightforward to create and tune analysis
what are the limitations of using jamovi?
Not very reproducible - hard for others to know what you did
Time consuming - if you want to repeat an analysis you need to click through all the buttons again from scratch
what is R?
Reproducible analysis scripts
what are the strengths of R?
Highly transparent - very clear what steps were taken in which order
Collaborative- can send and share reproducible analyses to colleagues
Efficient - can rerun analyses on new data very quickly once the script has been written
what are the limitations of using R?
A bit harder to set up
what are the Practical data analysis skills that will be gained from this module?
Pre-registration
How to read and write methods sections
How to read and write results sections
what is the research project?
Design your own experiment around a replication of a classic, but very outdated, psychology study
Design and experiment and collect data in groups
Write a pre-registration report and a full practical report based on your study
what is the quote from THE FEMALE BRAIN that supports the idea that society is full of 'folk wisdom'?
"A woman uses about 20,000 words per day while a man uses around 7000"
what did Mehl et al (2007) show?
hat women use an average of 16,215 words per day and men use an average of 15,669 words
what is a dataset?
A collection of data acquired for specific purpose
May relate to multiple experiments or hypotheses
what is a variable?
A number that can 'vary' (take a high or low value) depending on an attribute that we're trying to measure
We typically measure several variables from each participant
These typically form one collum in a data file
what is a nominal variable?
No relationship between different possibilities in scale - sometimes called categorical data
what is an ordinal variable?
A natural order between possibilities but nothing else
Can't interpret the magnitude of differences
what is an interval variable?
The possibilities are ordered and have interpretable magnitudes through 0 does not have a special meaning
what is a ratio variable?
Like interval data
But now 0 is directly interpretable and we can interpret ratios between values
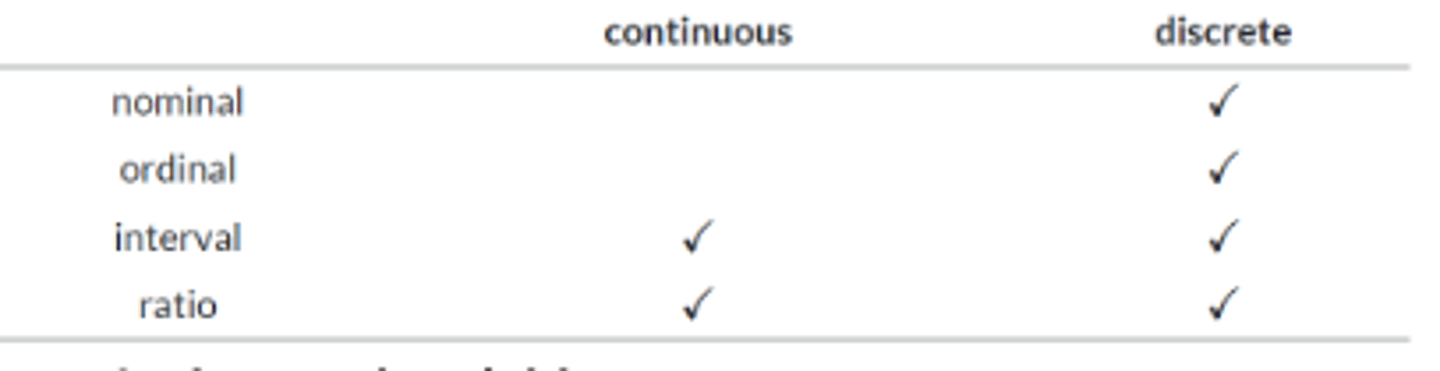
what is a continuous variable
A variable that can charge freely to take any value
For example – temperature could be 4C, 10.34C or –00.45C
what is a discreet variable?
A numbered variable that takes one of a fixed set of values
For example - number of cars owned
what variables are continuous and which are discreet?
what are latent and observable variables?
We cannot see directly many of the things we are interested in in psychology
Latent variables are variables that can only be inferred indirectly through a model from other observable variables that can be directly observed or measured
We must take care when research involves latent variables
- What has actually been measured?
- Is this observed variable a good proxy?
We often must use observable factors as a proxy for important latent variables, but it can be difficult to do this well.
It might be that the 'best' observed variable depends on practicalities and the desired outcome of the project
what is quality of life?
Quality of life is a 'latent' variable that is inferred from observed variables that we can directly measure eg health, financial stability, social support etc.