Stats- sensitivity/ specificity (slides 1-51)
1/74
There's no tags or description
Looks like no tags are added yet.
Name | Mastery | Learn | Test | Matching | Spaced | Call with Kai |
|---|
No study sessions yet.
75 Terms
what is An important part of building evidence-based practice
the ability to differentiate between people who have the disease and those who do not
how do figure out if people have the disease or not
by using the most accurate and precise measure or test to promote quality outcomes
The accuracy of a screening test or a test used to
confirm a diagnosis
how is the accuracy of a screening test or a test evaluated
in terms of its ability to correctly assess the presence or absence of a disease or condition as compared with a gold standard
gold standard
the most accurate means of currently diagnosing a particular disease
what does the gold standard serve as a basis for
comparison with newly developed diagnostic or screening tests
test variable
the screening variable (test result-positive or negative*)
state variable
the disease state (have/don’t have) or the gold standard
how many possible outcomes of a screening test for a disease is there
4
sensitivity
true positive (accurately identifies the presence of a disease
false positive
indicates a disease is present when it is not
specificity
true negative (accurately indicates that the disease is not present)
false negative
indicates that a disease is not present when it is
a highly sensitive test is very good at
identifying the patient with a disease
If a test is highly sensitive it has a
low percentage of false negatives
Low sensitivity test is limited in
identifying the patient with a disease
If a test has low sensitivity it has a
high percentage of false negatives
If a sensitive test has negative results
the patient is less likely to have the disease
Highly specific test is very good a
identifying patients without a disease
If a test is very specific
it has a low percentage of false positives
Low specificity test is limited in
identifying patients without a disease
If a test has low specificity it has
high percentage of false positives
If a specific test has positive results
the patient is more likely to have the disease
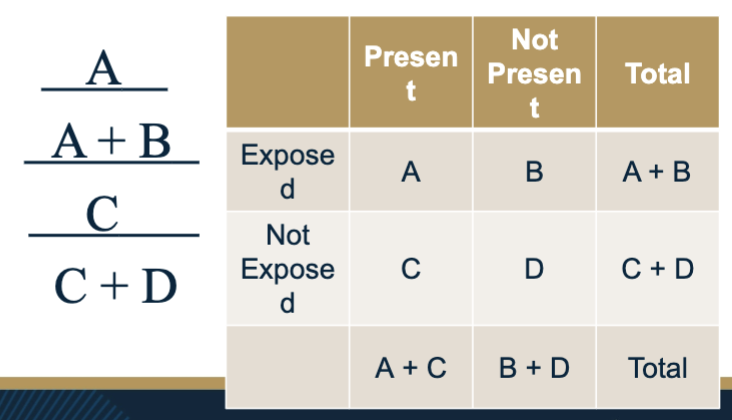
Calculating Sensitivity & Specificity variables: A
# people who have the disease and the test is +
top left corner of box
Calculating Sensitivity & Specificity variables: B
# people who do not have the disease and the test is +
top right corner
Calculating Sensitivity & Specificity variables: C
# people who have the disease and the test is –
Bottom left corner
Calculating Sensitivity & Specificity variables: D
# people who do not have the disease and the test is -
Bottom right corner
Sensitivity
probability of having the disease (true positive rate)
sensitivity equation
a/(a+c)
Specificity
probability of the absence of disease (true negative)
d/(b+d)
False positive
probability of no disease but having a positive test (false positive rate)
false positive equation
b/(b + d)
false negative
probability of having disease but having negative test (false negative rate)
false negative equation
c/(c + a)
likelihood ratios
Additional calculations that can help researchers to determine the accuracy of diagnostic or screening tests
what are likelihood ratios based on
the sensitivity and specific results
what is the likelihood ratios calculated for
to determine the likelihood that a positive test result is a true positive and a negative test result is a true negative
Positive LR
The ratio of the true positive results to false positive results
positive LR equation
Sensitivity ÷ (1 – Specificity)
negative LR
The ratio of true negative results to false negative results
negative LR equation
Negative LR = (1 – Sensitivity) ÷ Specificity
likelihood ratios greater than 1.0
represents an increase in the likelihood of the disease
likelihood ratios less than 1.0
represents a decrease in the likelihood of the disease
The very high likelihood ratios (or >10)
rule in the disease/indicate that the patient has the disease
The very low likelihood ratios (or < 0.1)
virtually rule out the chance that the patient has the disease
Receiver Operating Characteristic (ROC) Curve
descriptive graph that plots the true positive rate against the false positive rate
ROC curve variables
x-axis - false positive rate (1 – specificity)
y-axis – true positive rate (sensitivity)
C- statistic
C statistic
area under the curve – probability that the test result from a randomly selected person with the disease will be positive
in ROC curve what does the blue line represents
actual data
in ROC curve what does the black line represents
the reference line that represents a 50/50 chance of accurately predicting candiduria
in ROC curve the greater the distance the blue line is from the black line
the more accurate the test
Positive Predictive Value (PPV)
tells you what the probability is that a subject actually has the disease given a positive test result
PPV/ positive predictive value equation
true positives (A)/ Total number who tested positive (A+B)
what is PPV dependent upon
not just the sensitivity and specificity of the test but also on the prevalence of the illness in the population you are screening
prevalence
amount of illness (number of cases) present in the population divided by the total population
prevalence equation
A+C/A+B+C+D
amount of illness/ total population
If you are looking for a disease that is rare, a positive test
is more likely to be a false positive than in a population where 90% of the population actually has the disease
Negative Predictive Value (NPV)
if the subject screens negatively, NPV tells you the probability that the patient really does not have the disease
negative predictive value (NPV) equation
true negative (D)/ all subjects who tested negative (C+D)
efficiency
measure of the agreement between the screening test and the actual clinical diagnosis
how to do efficiency
Add all the true positives and the true negatives and determine what proportion of your sample that is
Efficiency equation
A+D/A+B+C+D x 100
epidemiology
The study of the distribution of a disease
Essentially this is a science that studies ‘the why’
behind disease pattern and progression
basic types of epidemiological studies
– Cohort study
– Case control study
– Cross-sectional study
relative risk
incidence rate in the exposed sample divided by the incidence rate of those not expose
risk ration equation
relative risk less than 1
means the group that was exposed had fewer cases develop than the group that was not exposed
what is exposure
may be a protective factor
relative risk=1
means there is no association between the exposure and the illness
relative risk greater than 1
means the group that was exposed has a higher incidence rate than the group that was not
relative risk higher than 1 exposure
may be a risk factor
p
value of the associated chi-square indicates whether or not your RR value is statistically significant
When you are using a RR without a p value
see the confidence interval or confidence limits
This means that the researcher is 95% sure that the
actual RR in the population is between the two
numbers
what are attack rates used to determine
the origin of an outbreak – in particular with foodborne pathogens
attack rate equations
number of sick/ number of exposed (exposed and sick+exposed and not sick)