Economic Growth
1/41
Earn XP
Description and Tags
Name | Mastery | Learn | Test | Matching | Spaced |
|---|
No study sessions yet.
42 Terms
economic growth
the increasing capacity of an economy to satisfy the material wants of the population
growth is important because it enables households to achieve a higher standard of living in material terms
sustainable economic growth
sustainable economic growth is about ensuring there are continued improvements in living standards for future generations (this is considered to be 3.5% in Australia)
this includes preserving the natural environment
GDP
the total market value of all final goods and services produced in a country during a period of time
there are 3 types: nominal, real and gdp per capita
measuring economic growth
economic growth is measured by comparing Gross Domestic Product (GDP) in different time periods
the measurement of economic growth as the increasing ability to satisfy wants and needs can be rather subjective
in practical terms, economic growth is deemed to have occurred when there is an increase in real GDP over the period to time
GDP growth
australia has had a slow steady upward trend in GDP since the 1960s - at about 3.1% per annum
GDP growth = (GDP2 - GDP1 / GDP1) x 100%
nominal GDP
the value of output expressed in the prices of the day (current prices)
comparisons between the GDP of different time periods will distort the measures of economic growth if the value of money changes (i.e. there is inflation)
real GDP
adjusted to remove the effect of price increases (inflation)
real GDP provides a better basis for judging long term national economic performance than nominal GDP
real GDP per capita
real GDP at any point in time divided by the size of the population
population growth massively skews GDP data
more people → more goods and services
for individuals to be better off in material terms, economic growth has to be faster than population growth
although GDP at current prices (i.e. nominal GDP) increased approximately 325 times between 1950-2015, real GDP per capital only increased by 4.5 times
measuring GDP growth (the rate of change)
economists are only really interest in how much GDP has changed from one year to the next → this is known as rate of change
the rate of economic growth is measured by the rate of change in GDP which best describes the speed at which welfare is rising
limitations of economic growth as a measure of welfare → are the higher incomes associated with economic growth evenly distributed?
the benefits of growth may be unevenly distributed in the economy benefiting wealthy skilled groups at the expense of less skilled groups
limitations of economic growth as a measure of welfare → is everything we value as part of our welfare captured by GDP data?
GDP does not record a significant number of economic transactions, for example home grown productions, voluntary and charitable work, cash transactions may not be recorded
limitations of economic growth as a measure of welfare → does GDP account for the changing quality of products?
GDP data can compare the value of goods over time but doesn’t consider goods quality or utility
utility: the ability of a good or services to satisfy wants
for example, current versions of household electronic equipment deliver much better performance - such as mobile phones
limitations of economic growth as a measure of welfare → does GDP reflect working conditions?
GDP underestimates improvements in working conditions
there have been many increase in productivity, providing workers with more leisure time (ceteris paribus)
however, if growth is due to working overtime, then we might question whether the higher working hours are offset by the benefits of higher material welfare
limitations of economic growth as a measure of welfare → does GDP account for economic ‘bads’ ?
economic growth does not consider externalities (e.g. pollution, environmental factors, etc)
GDP growth has a high environment cost causing:
pollution
loss of biodiversity
resource depletion
climate change
limitations of GDP → double counting
the value of intermediate productions, or products that are used to make other goods, could be cpunted more than once
solution: count only final goods or measure value added at each stage
limitations of GDP → foreign ownership of businesses
a number of products are made in australia by firms that are wholly or partially foreign owned. Also some Australian owned businesses produce goods overseas
have 2 different measures:
a domestic measure: count all economic activity that takes place in Australia regardless of who owns the business
a national measure: count all economic activity resulting from Australian owned businesses regardless of where it takes place
limitations of GDP → depreciation
capital wears out during the production process
have two different measures:
a gross measure: no allowance is made for capital depreciation
a net measure: an allowance is made for a capital depreciation
limitations of GDP → inflation and deflation
output, income and spending are measured in dollars. A change in the price level changes the value recorded
have two different measures:
a nominal measure: value activity at current prices
a real measure: values adjusted for inflation using constant prices
MAIN LIST → limitations of GDP as a measure of welfare
GDP only measures goods and services traded in the market - what about household chores, volunteer services, charitable institutions?
does not take into account health, life expectancy, education levels economic equality, social justice, and leisure time. There all affect out standard of living and welfare
Does not indicate the composition of output and quality of goods and services produced. Some types of goods produced do not necessarily raise the standard of living e.g. defence items.
Does not describe how the economic growth/ income is distributed. Not everyone gets an equal share.
It does not indicate the source of economic growth i.e. Consumption sourced economic growth is shorter and more inflationary than investment driven economic growth.
Costs of growth – Negative externalities such as pollution, resource depletion are not considered.
No allowance is made for depreciation of capital goods – the wearing out of goods used in the production process. This would give a better indication of the changes in the capacity of a country to satisfy the wants of its people.
Alternative measures of economic growth
economic development indicators: measure changing welfare over the long term (number of doctors per 1000 people)
total quality of life index (TQLI): the ability of a nation to meet the basic needs of its people (e.g. literacy, life expectancy)
genuine progress indicator (GPI): gains in material welfare are offset by losses in other types of welfare
why do we use GDP?
whilst GDP may not be the perfect measure of economic growth and wellbeing, it does provide a consistent measurement of economic flows over time
it is a consistent way to measure economic activity over time
it is easy to understand
every country calculates its own GDP
its a way to compare growth rates across countries and over time
it informs the decisions of economic policy makers
actual rate of economic growth
depends on the willingness of people to buy the goods and services produced
in a boom, the total level of spending is higher as more people are employed
in a trough, the total level of spending falls
potential rate of economic growth
determined by the stock of natural, human and capital resources
the stock has 2 parts:
quantity of resources available
quality of resources available
economic growth on the PPF
illustrated by an outward movement of the PPF
shows that more wants and needs are being satisfied
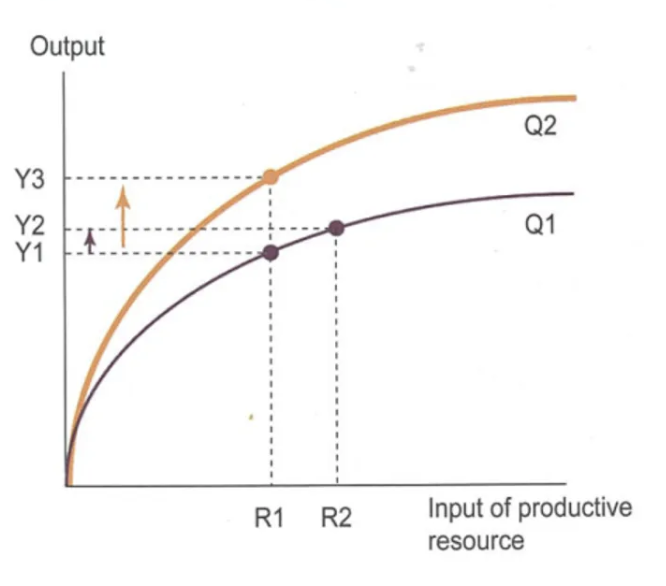
economic growth on the aggregate production function (APF)
illustrates potential growth
X axis: quantity of a resource used in production
Y axis: the output that can be produced using that resource
Q1 → output increases as quantity of resources increases
Q2 → increases in technology shifts Q1 up (more output with same resources)
AFP shows the relationship between capital stock and output
increase in the aggregate production function → higher GDP can be achieved with the same level of input
determinants of economic growth
the potential rate of growth over time is determined by the stock of natural, human and capital resources
demand side factors: changes to components of aggregate expenditure (C+I+G+(X-M)
supply side factors: quantity and quality of resources, changes in technology
productivity: labour and mutli factor productivity (linked with technology)
supply side factors
an increase in the quantity of resources can also expand economic activity
such supply side factors include:
the discovery of natural resources (e.g. iron ore)
an increase in the population → increase in the workforce → more capacity to produce goods and services
this can increase economic growth but doesn’t mean it will → there still needs to be a need to increase supply
increase efficiency in the production of resources can also expand economic growth
the 3 P’s
the number of people in the working age population
the proportion of those who work (and their working hours) - participation
the amount of output produced per worker - productivity
importance of GDP per capita
adjusting GDP figures for population growth enables us to judge the extent to which each individual’s material welfare has changed over time
factors that determine long term economic growth
the rate of population change
the rate of increase in capital equipment per worker
technological progress and the application of new ideas to the productive process
improvements in the skills and productivity of the labour force
the size of the natural resource base
the capacity of an economy to change
the willingness of an economy to trade with overseas countries
population and economic growth
australia’s population is projected to reach 27 million by 2025
the average annual increase in population over 40 years was 1.4%
40% of this was due to natural increase → excess of births over deaths
60% of the increase was due to immigration
rising population:
increases the demand for goods and services and the productive factors needed to produce them
increases the size of the labour force
immigration has a more immediate impact on growth → many migrant are of working age, so they add to income, output and spending as soon as they get a job / start a business.
immigration and economic growth
immigration has a more immediate impact on growth natural increase does
immigrants are often of working age, so there is a quicker impact on the labour supply
immigration results in the transfer of wealth, skills and knowledge from overseas
immigration has a positive fiscal impact (working immigrant pay taxes)
participation and economic growth
in July 2023, the participation rate was 67%
participation impacts economic growth because:
work provides financial security for households
participation reduces reliance on welfare
work increases the skill level of the population
work involves social and community connection
participation has a positive fiscal impact (greater tax revenue)
efficiency and economic growth
allocative efficiency: allocating resources to the usage in which they have the most value
technical efficiency: more efficient use of available resources. Growth will occur if an increased quantity of outputs can be produced from the same or smaller quantity of inputs
dynamic efficiency: ability of an economy to adapt over time. This will be increased if resources are readily reallocated from inefficient employment to more productive sectors due to changing conditions in demand and supply, prices and technology
efficiency allows for the better use of resources → increase in productivity → increase aggregate supply and aggregate demand which leads to economic growth
Mutlifactor productivity (MFP)
multifactor productivity is a measure of overall production efficiency. MFP is the ratio of output to the combined input of labour and capital
improvements in MFP account for 1/3 of Australia’s growth in the last 40 years
benefits (of increases in MFP):
lower unit costs of production, improved production quality and new types of goods and services
disadvantage (of increases in MFP)
may lead to structural unemployment → job losses as a result of increase in technology (workers replaces by capital)
productivity and economic growth
productivity is the amount of output produced per hour worked (labour productivity)
it is the most important determinant of economic growth because an increase in productivity will increase GDP per capita
a countries standard of living cannot increase unless GDP per capita rises over time
productivity improvement accounted for half of Australia’s economic growth between 2000-2020
what causes rising productivity?
capital deepending: rising stock of capital equipment per worker (a higher capital - labour ratio)
improving labour skills and efficiency (multifactor productivty) by:
education and training (investment in human capital)
more infrastructure → transport and communication networks (social overhead capital)
better management (work efficiency)
factors that cause a fall in economic growth
inflation
tightening of monetary policy
high levels of household debt
high levels of foreign debt
oil prices
exogenous shocks
benefits of economic growth
living standards
government revenue
employment
increased leisure
costs of economic growth
inflation
externalities
social
structural unemployment
increases in economic growth
economic growth can occur from an increase in aggregate demand and/or an increase in aggregate supply
increase in aggregate demand due to increase in C+I+G+(X-M) and increase in aggregate supply due to changes in costs of production, increase in quantity and or quality of resources
benefits vs. costs of economic growth
benefits | costs |
|---|---|
increases economic welfare and standard of living | increase in aggregate demand may lead to demand pull inflationary pressure |
increase in income and consumption of goods and services | may lead to structural unemployment → growth unlikely to be balanced with all industries expanding at the same rate |
reduces unemployment if more jobs are created | may lead to increase environmental problems → pollution, land degradation |
increased consumer and business confidence | may lead to skill shortages |
increase in government revenue through taxation which can be used for public goods spending |