Introduction to Inferential Statistics and Data Analysis
1/69
There's no tags or description
Looks like no tags are added yet.
Name | Mastery | Learn | Test | Matching | Spaced | Call with Kai |
|---|
No analytics yet
Send a link to your students to track their progress
70 Terms
Statistics
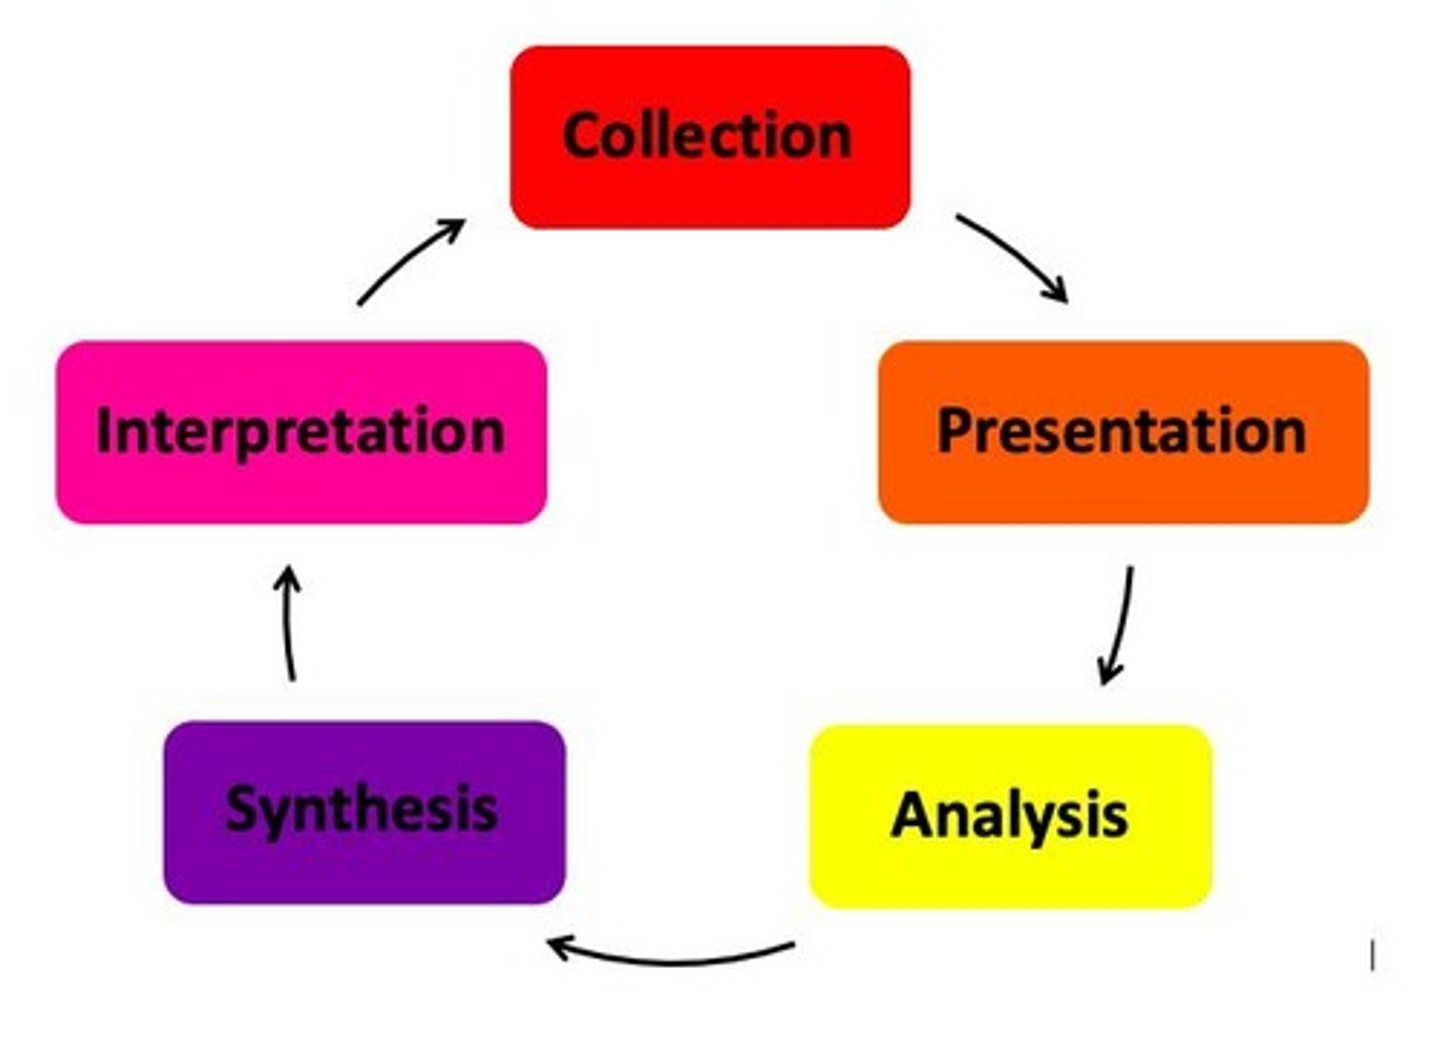
A discipline that deals with the collection, presentation, analysis, synthesis and interpretation of data relevant in any study.
Descriptive Statistics
The set of statistical procedures concerned with describing the characteristics and properties of a group of observations based on easily verifiable facts.
Inferential Statistics
The set of statistical procedures used to draw inferences for the population on the basis of the information obtained from the sample.
Universe
The set of all entities that are included in the study.
Population
The set of all values describing all members of the universe with respect to a particular variable.
Sample
Any subset of the population.
Statistic
It refers to any value describing a sample.
Parameter
A ________ is a value that describes a population.
Data
They are sets of information gathered under any study.
Facts
Data that are processed and verified are called _____.
Elements
They are the entities on which data are collected.
Quantitative Data
This are sets of information which are purely numerical in nature.
Qualitative Data
This are sets of information which are purely categorical in nature.
Discrete Data
This type of data refer to data that assume exact values only and can be obtained by counting.
Continuous Data
This type of data pertain to data that assume infinite values within a specified interval and can be obtained by actual measurement.
Constant
It is a characteristic of a population or a sample which makes the members similar to each other.
Variable
It is a characteristic of a population or a sample which makes the members different from each other.
Nominal Scale
The lowest level of measurement that classifies persons or objects into two or more categories.
Ordinal Scale
The level of measurement used to label ranks.
Interval Scale
The level of measurement where differences are significant and do not have a true zero value.
Ratio Scale
The highest level of measurement where quotients of magnitudes are significant and there is a true zero value.
Primary Data
Data gathered directly from the source, considered _______ if it is produced by the source.
Secondary Data
Data that is not primary, collected from sources that are not the original producers.
Facts
Recollections, observations, and perceptions of respondents about themselves and others.
Attitudes and Feelings
Respondents' ideas and feelings about the research topic and their personal feelings about the worth of the item being investigated.
Judgments
Respondents' ideas or opinions based on standards, reflecting their actual behavior in a given situation.
Psychomotor Skills
Manipulative skills of the individual involving their five senses.
Direct or Interview method
A purposeful face to face relationship between two entities: the interviewer and the interviewee.
Indirect or Questionnaire method
A method that uses a set of questions which when answered properly by a required number of properly selected items, will supply the necessary information to complete a research study.
Observation method
The way of perceiving data through the use of any of the five senses: sight, hearing, taste, touch and smell.
Testing method
A method that uses a specific type of measuring instrument whose general characteristic is that it forces responses to be indicators of skills, knowledge, attitudes, etc.
Registration method
The process of listing down items of the same kind in some systematic manner for record purposes.
Experiments
Scientific-based activities that aim to establish cause-effect relationships.
Library method
A method that utilizes all existing documents coming from libraries and agencies concerned in the study.
Sampling error
The difference in the survey results between sample and population.
Margin of error
A common summary which quantifies possible sampling errors.
Cochran's Formula
It is used when estimating population proportion.
Finite Population Correction for Proportions
A method that can lessen the computed sample size when estimating population proportion.
Sample size decision without formula
Look for the most recent study that is highly similar to your topic or an academic reference that states a standard for the minimum sample size.
Standard Deviation
A measure of the amount of variation or dispersion in a set of values.
Sample Size
The number of observations or replicates included in a statistical sample.
Population Proportion (p)
The ratio of members of a population that have a particular characteristic.
Level of Significance (α)
The probability of rejecting the null hypothesis when it is true.
Finite Population Correction
A factor applied to sample size calculations when sampling without replacement from a finite population.
Slovin's Formula
A formula for determining sample size given a population size and margin of error: n ≈ N / (1 + Ne^2).
Probability Sampling Techniques
Sampling techniques where each member of the population has a known chance of being included.
Simple Random Sampling
A sampling method where every member of the population has an equal chance of being selected.
Systematic Random Sampling
A method where samples are selected by choosing every kth member of the population.
Stratified Random Sampling
A method that involves dividing the population into subgroups and sampling from each subgroup.
Confidence Level
The percentage of times that a statistical method will produce a correct result.
Precision
The degree to which repeated measurements under unchanged conditions show the same results.
Random Selection
A method of selecting a sample in such a way that every member of the population has an equal chance of being chosen.
Population Size (N)
The total number of individuals in a population.
Sample Size Calculation
The process of determining the number of observations needed for a study.
Non-Probability Sampling Techniques
Sampling techniques where not all members of the population have a known chance of being included.
Cluster Random Sampling
It requires that samples are chosen from a pre-selected set of nonoverlapping subgroups of the population. Each subgroup is called a ______.
Non-Probability Sampling Techniques
It choose samples in a way that each member of the population does not have a known chance of being included in the sample.
Convenience Sampling
It lets the researcher to pick anyone he pleases to include in the sample based on his/her convenience.
Accidental Sampling
It allows the researcher to pick anyone that happens to be available by chance in his/her setting.
Quota Sampling
It sets that the researcher has to comply for a specific number of respondents only, regardless of their individuality.
Purposive Sampling
It set that the respondents are chosen on the basis of pre-determined criteria set by the researchers.
Snowball Sampling
It initially sets that the researcher choose a primary set of participants based on initial criteria, and completion of the sample size relies on the referrals given either by the primary set of participants or by those who are also referred.
Textual Presentation
Processed data and results are presented via discussions in paragraphs.
1. all figures for all categories 2. all figures for the top 3 or 5 categories 3. all figures for the topmost and bottommost categories
Common Contents in Textual Presentation
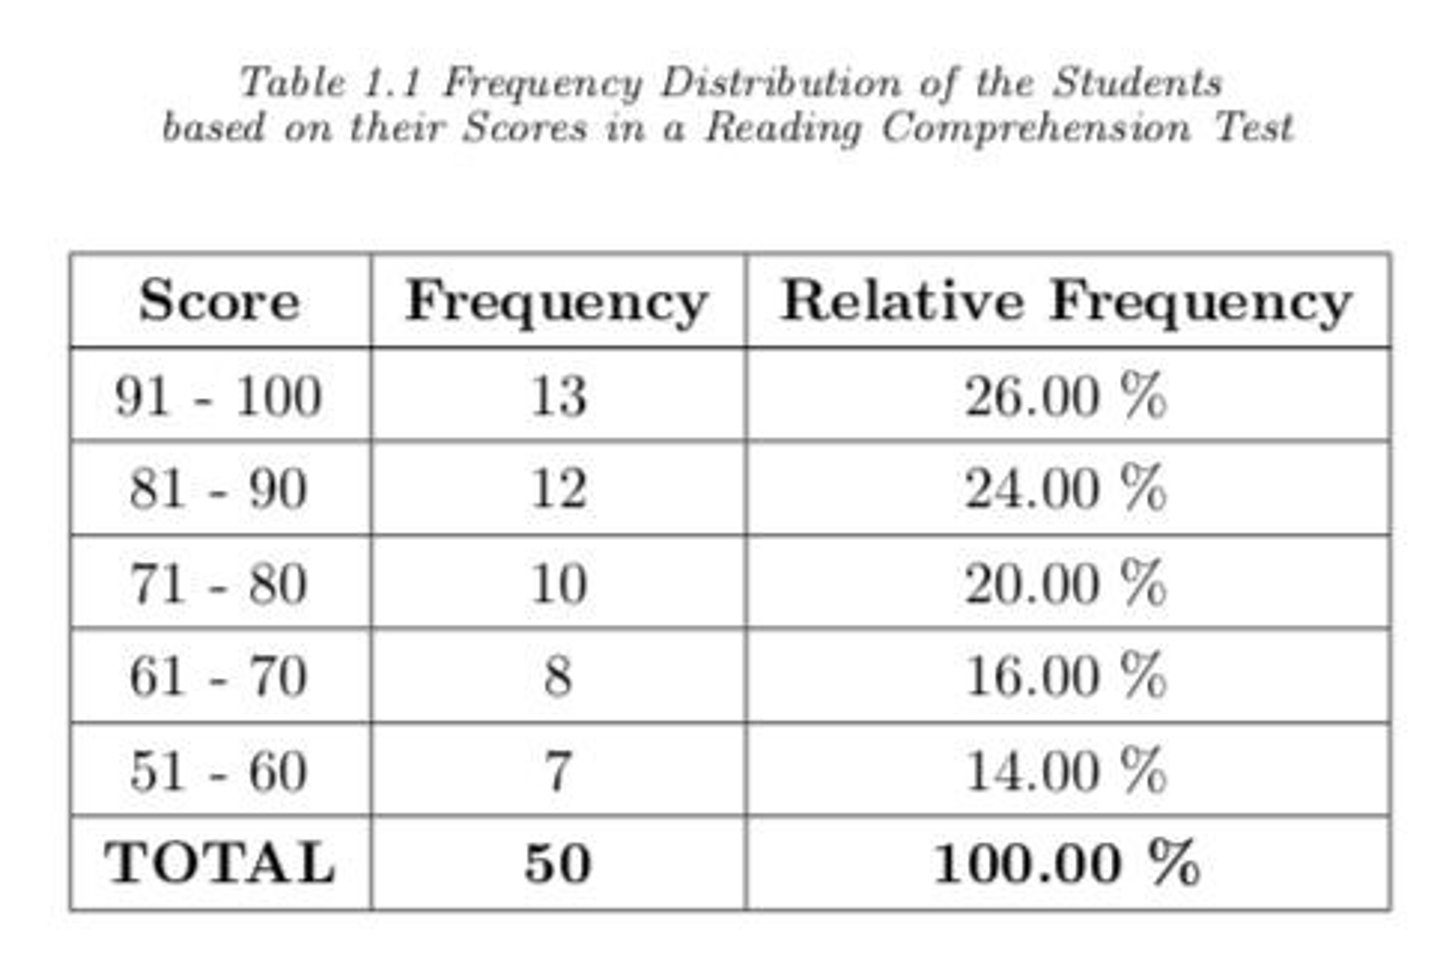
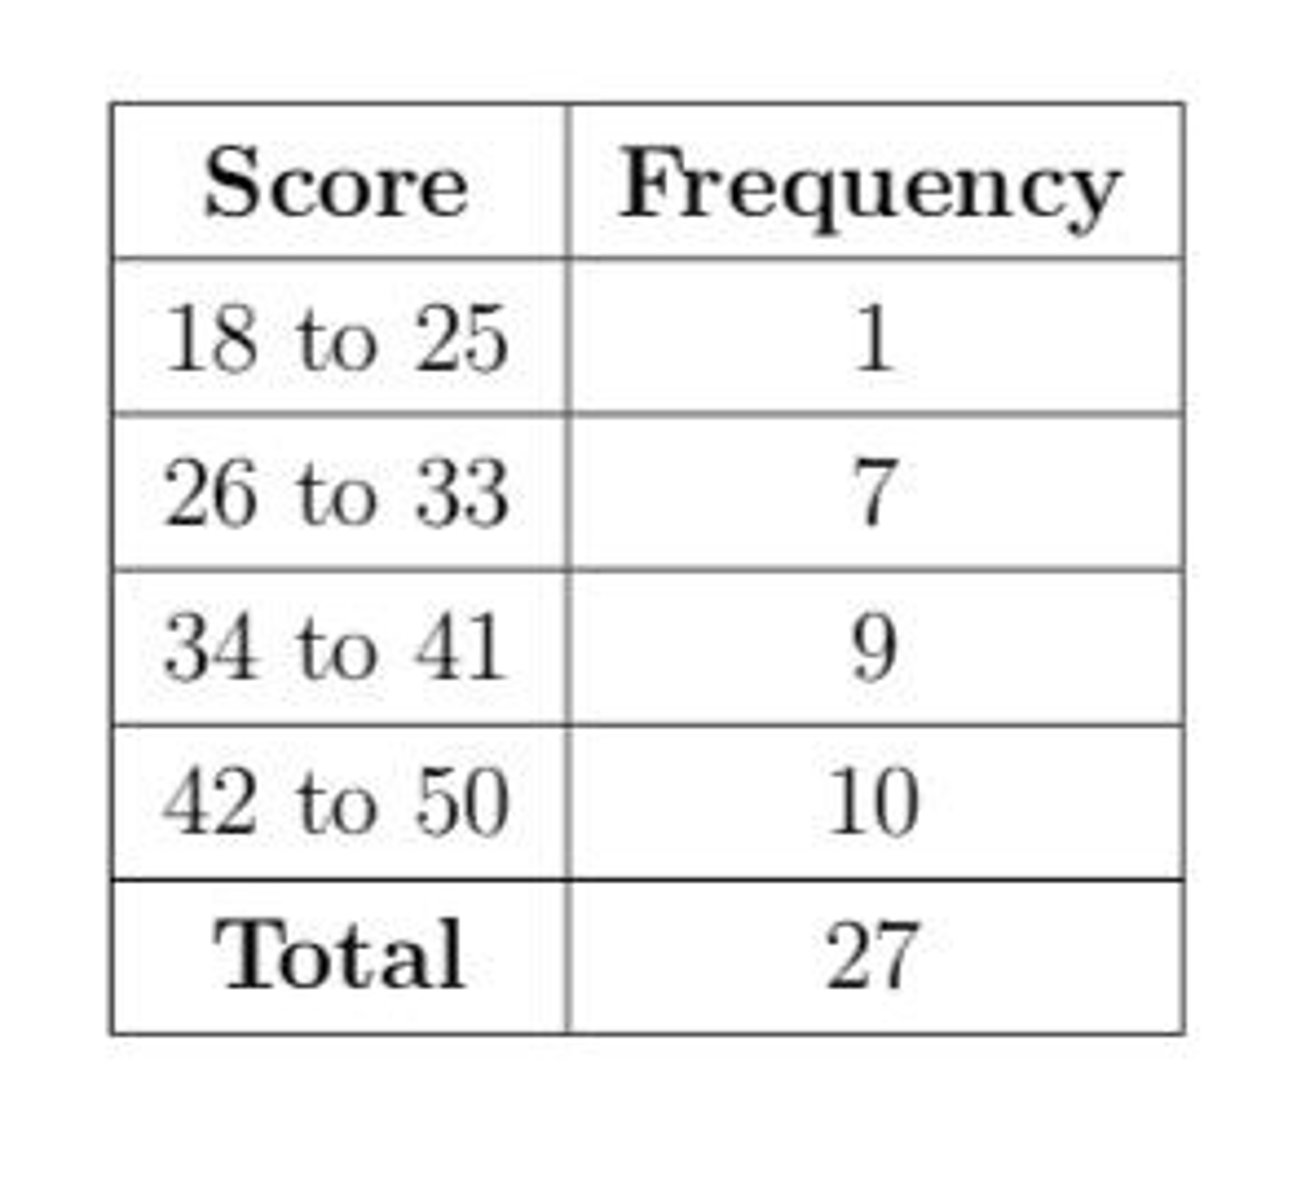
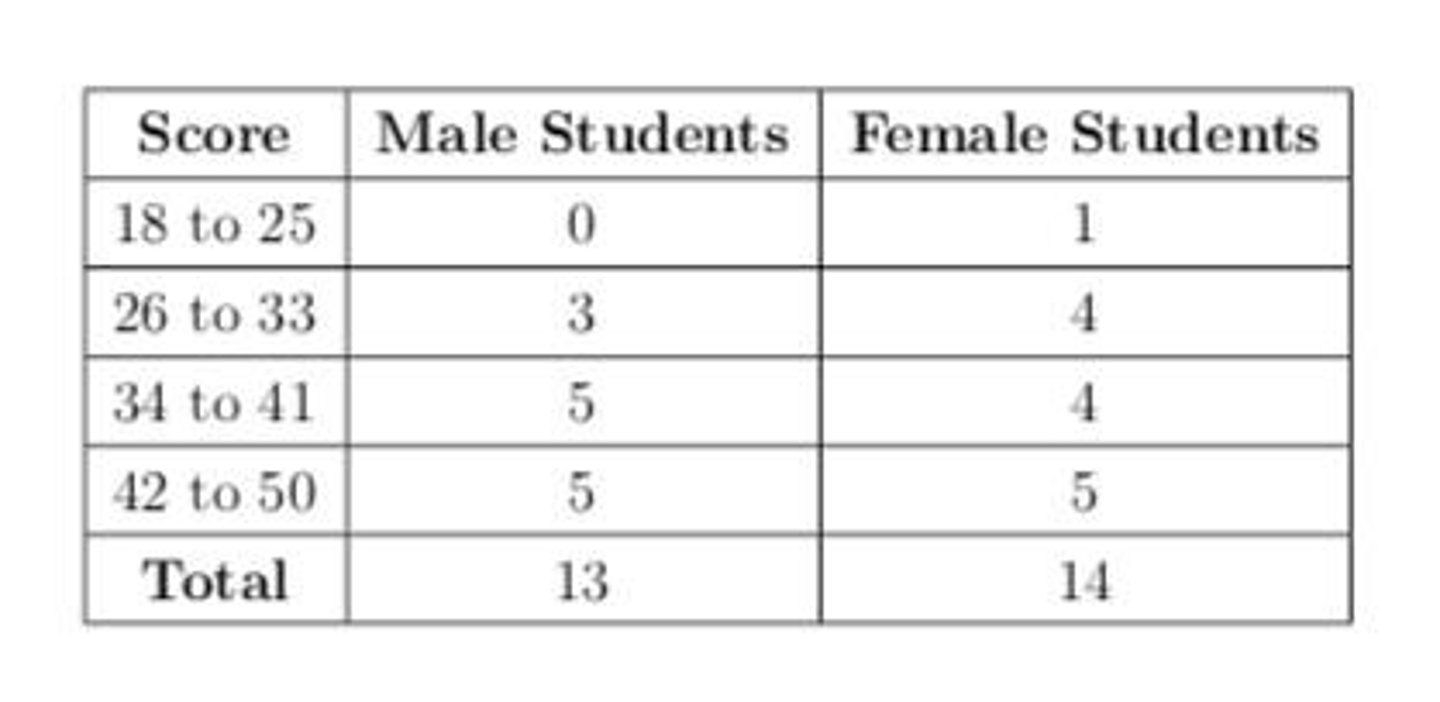
Tabular Presentation
Processed data are arranged using rectangular grids.
1. Table Number 2. Table Title 3. Column Headers 4. Row Classifiers 5. Legend, if possible 6. Source, if possible
Essential Parts of a Table
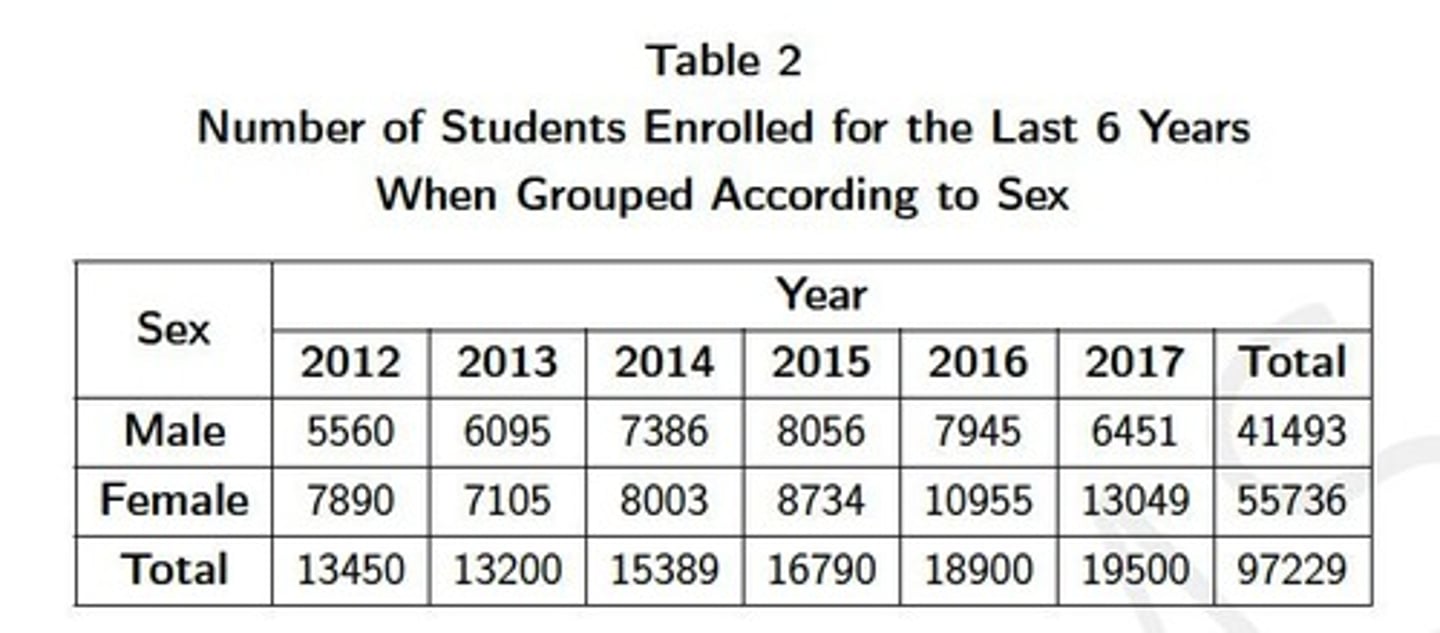
1. One-Way table presents frequencies for exactly one variable. 2. Two-Way table presents frequencies for exactly two variable.
Common Table Structures
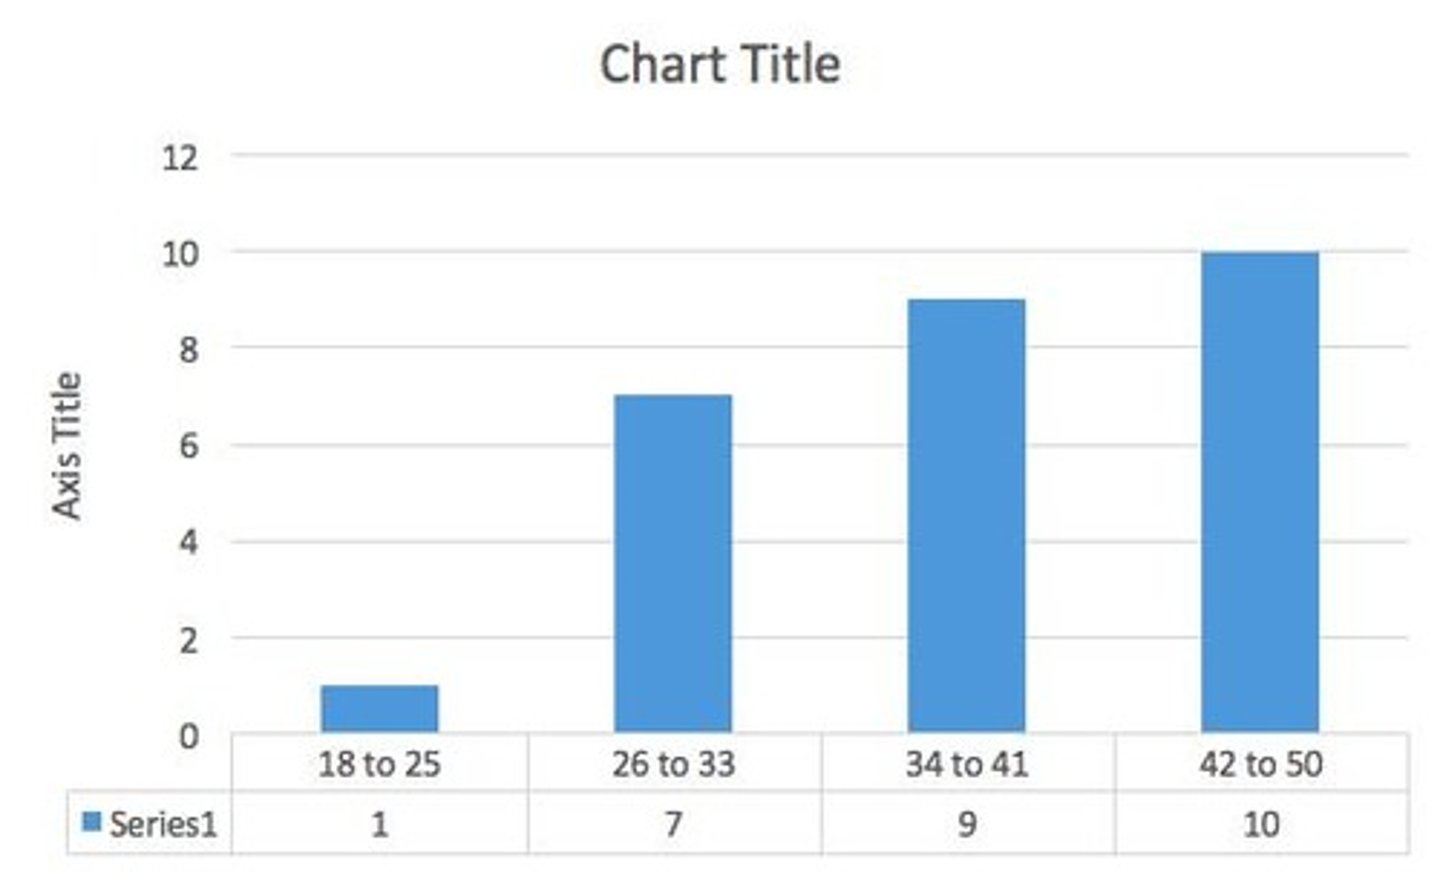
Graphical Presentation
Processed data are exhibited using charts or graphs.
1. Bar Graph 2. Pictograph 3. Pie Graph 4. Statistical Maps
Common Graphs for Qualitative Variables
1. Histogram 2. Line Graph 3. Frequency Polygon 4. Statistical Maps
Common Graphs for Quantitative Variables