graphs (ap graphing packet)
1/3
There's no tags or description
Looks like no tags are added yet.
Name | Mastery | Learn | Test | Matching | Spaced | Call with Kai |
|---|
No analytics yet
Send a link to your students to track their progress
4 Terms
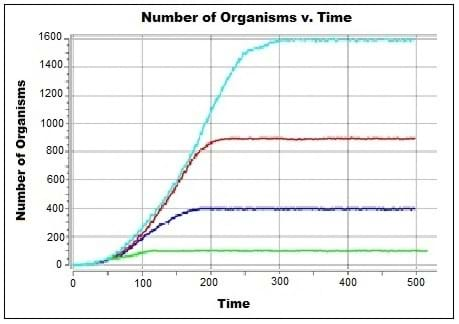
X,Y graph
This is your standard graph with the independent variable (what you change in an experiment, often a unit of time) on the X axis and the dependent variable (what you measure in an experiment) on the Y axis
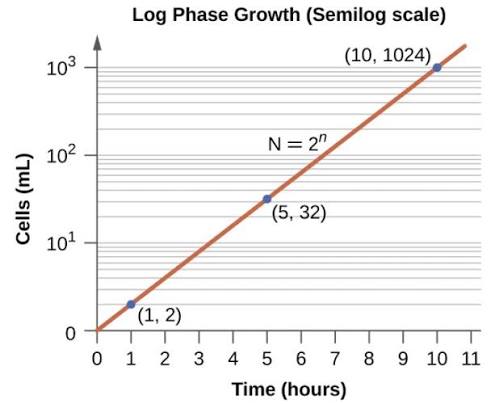
Log Y graph
This graph is similar to the XY graph except the Y axis is a logarithmic scale (A logarithmic scale is a method used to display numerical data that spans a broad range of values, especially when there are significant differences among the magnitudes of the numbers involved.)
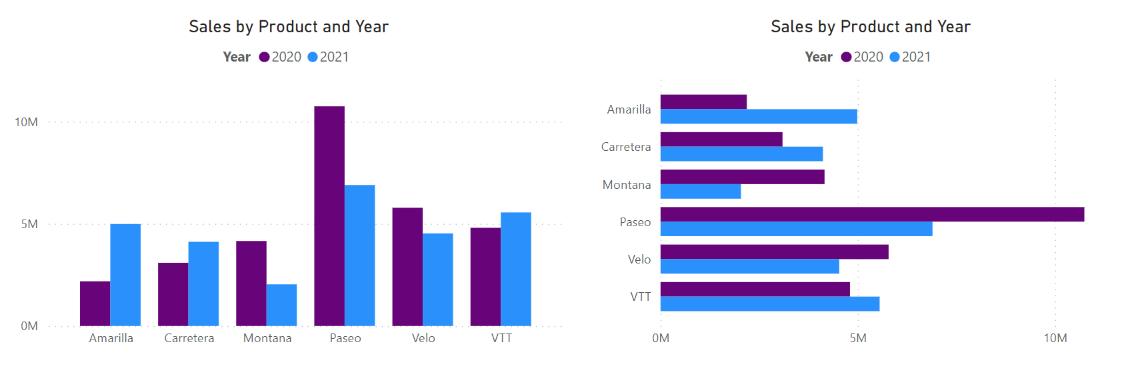
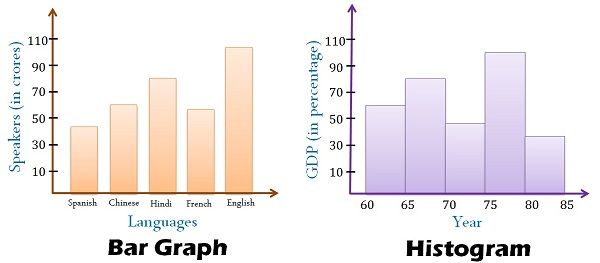
Bar graph
A graph showing the numerical value of a variable as the height or length of a rectangle representing categorical (non-numerical) data also note that the categorical data can be on the horizontal or vertical axis
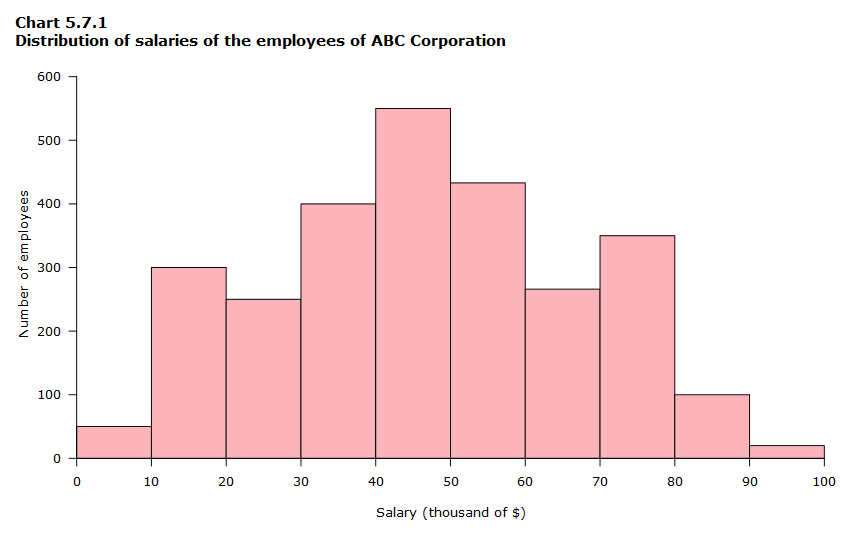
Histogram