Productivity and Quality Leadership Test 1
1/60
There's no tags or description
Looks like no tags are added yet.
Name | Mastery | Learn | Test | Matching | Spaced |
|---|
No study sessions yet.
61 Terms
Q: What is productivity?
A: Productivity = Outputs ÷ Inputs
Q: What is value in Lean terms?
A: What the customer wants and is willing to pay for
Q: What is waste in Lean terms?
keeping the value, elimitating the waste
Q: What are the 7 types of waste? (TIMWOOD)
A:
1.. Transportation
2. InventoryMotion
3. Waiting
4. Overproduction
5. Over-processing
6. Defects
Transportation Waste
Movement of product (people can be viewed as product)
Inventory Waste
Excess inventory = BAD or having too much of anything too soon
Motion Waste
Movement of people that does not add value
Waiting Waste
Waiting for anything
Over production waste
making too much or making too soon
Over processing Waste
Part of process we shouldnt do; unnessary to satisfiy customer
Defect Waste
Not doing something right the first time
Q: What are the main Lean Tools?
A: Poka-yoke, Visual Management, 5S, Preventive Maintenance, Just-in-Time (JIT)
Q: What is the goal of Poka-yoke?
A: Prevent mistakes from becoming defects and stop defects from moving further in the process
Q: What are the three levels of Poka-yoke?
Detection, Facilitation, Prevention
Detection Poka Yoke
Catch errors at the source or next step
EX: weighed packages to catch wrong packages
Facilitation Poka Yoke
Make the wrong action difficult
Ex: Golf ball on string in garage so you can park fulling in
Prevention Poka Yoke
Design so that defects are impossible
EX Deisal nozzzle will not fit in regular car
Q: What is the purpose of Visual Management?
A: To clearly convey information so status and priorities are obvious at a glance
Q: Benefits of Visual Management?
A: Reduces need to ask/discuss, eliminates interpretation, shows status, identifies priorities
Q: What is 5S used for?
A: Organizing the workplace to make it more efficient
What are the 5s
1. Sort
2. Set
3. Shine
4. Standardize
5. Sustain
Sort
Keep only what you need
Set
A place for everything
Shine
Keep it clean and inspect
Standardize
All similar processes
Sustain
Make it a habit
Q: What does JIT (Just-in-Time) mean?
A: The right part, at the right time, in the right amount
Q: What does Kanban signal?
A: To produce or stop producing, To move items to consuming location, To place an order
Q: What is the purpose of Preventive Maintenance (PM)?
A: Detect defects early, prevent breakdowns, and plan downtime to avoid costs
Q: What do processes do?
A: Transform inputs into outputs — it's how we do things
Q: What do all processes include?
A: Activities that add value and activities that don't
Q: What is value?
A: What the customer wants and is willing to pay for
Q: What is waste?
A: Anything and everything else besides value
Q: What is a Value Stream Map (VSM)?
A: An extension of a process map that examines and quantifies every step in the process
Q: What does a VSM differentiate?
A: Value-added vs. non-value-added activities
Q: What do you quantify in a VSM?
A: Value, waste, and outputs (time, distance, cycle time, people, equipment, materials)
How to create a VSM?
Observe the current state of the process map
Q: What is a typical representation of value vs. non-value activities?
A: Value-added is usually much smaller than non-value-added
Q: What are two common diagram types used with process mapping?
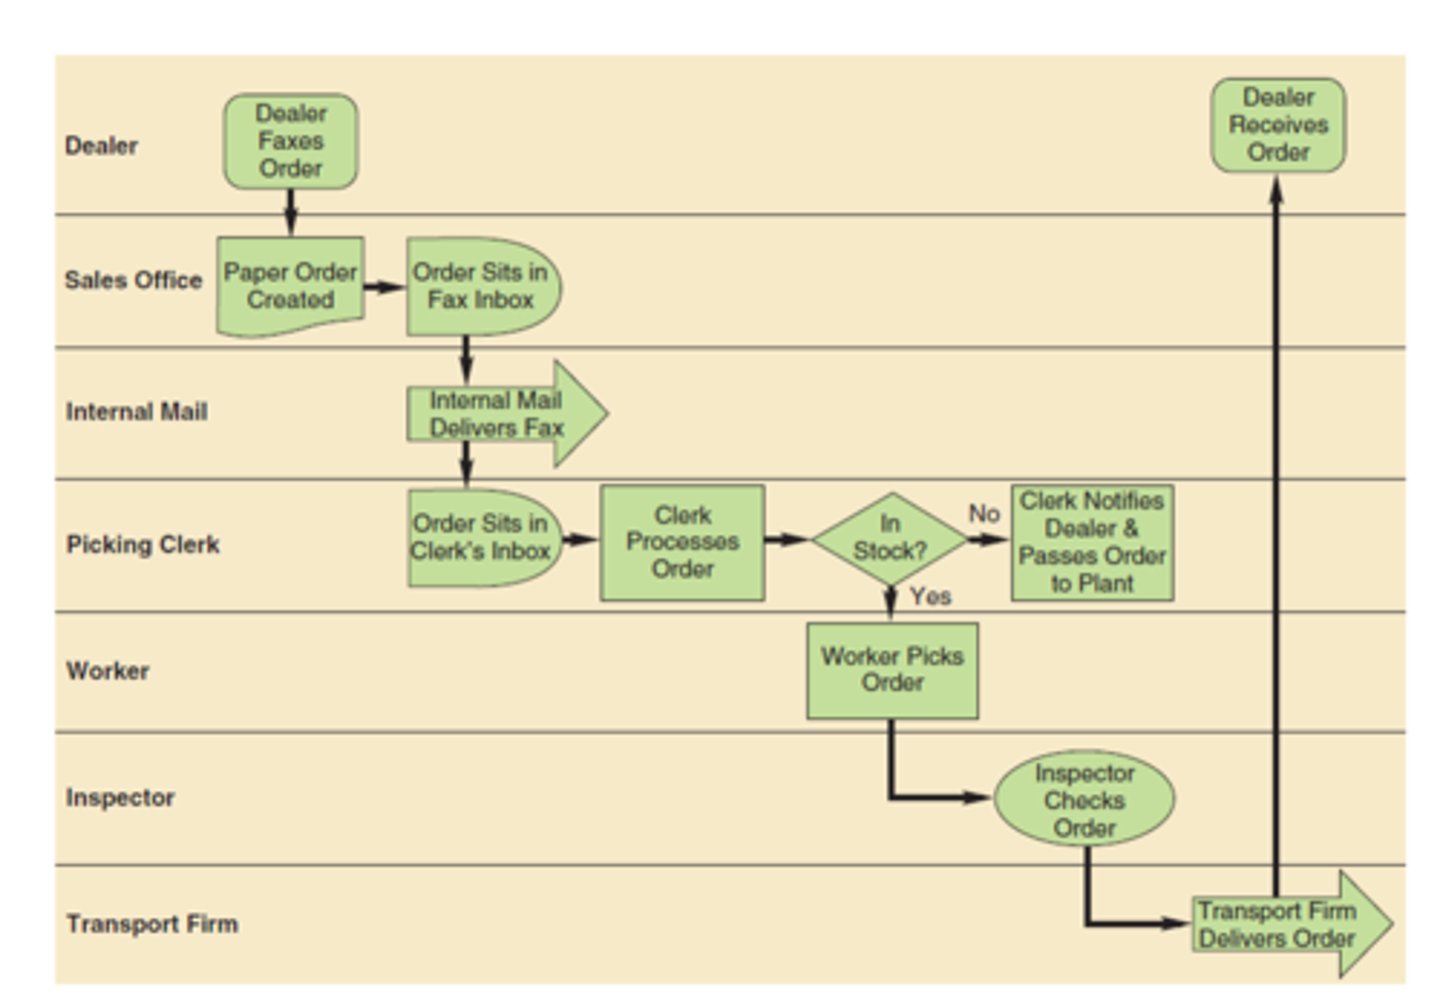
A: Spaghetti diagram and Swimlane diagram
Spaghetti Diagram
visual creation of actual flow
Swim Lane Diagram
shows participants responsibilities for a certain part of the process
Q: Who developed the quality and productivity methods used in Six Sigma?
A: Edwards Deming
Q: What did Deming emphasize about quality?
A: Lower costs and better quality at the same time
Q: What does DMAIC stand for?
A: Define, Measure, Analyze, Improve, Control
Q: What happens in the Define phase?
A: Define the goal and measure of success (MoS); create a project charter
Q: What happens in the Measure phase?
A: Gather data (observations, surveys, interviews, company data) to establish current state and baseline for MoS
Q: What happens in the Analyze phase?
A: Use data visualization (charts, Pareto, benchmarks, best practices) to find root causes
Q: What happens in the Improve phase?
A: Develop solutions and present them visually; create steps for how to implement changes
Q: What happens in the Control phase?
A: Evaluate whether changes improved the MoS and create systems to sustain improvements
Q: What is a MoS (Measure of Success)?
A: A way to measure whether improvements achieved the defined goal
Profit
Revenue - Expenses
(P+Q) - (Vc-Fc)
Quality Tools
1. Process Map
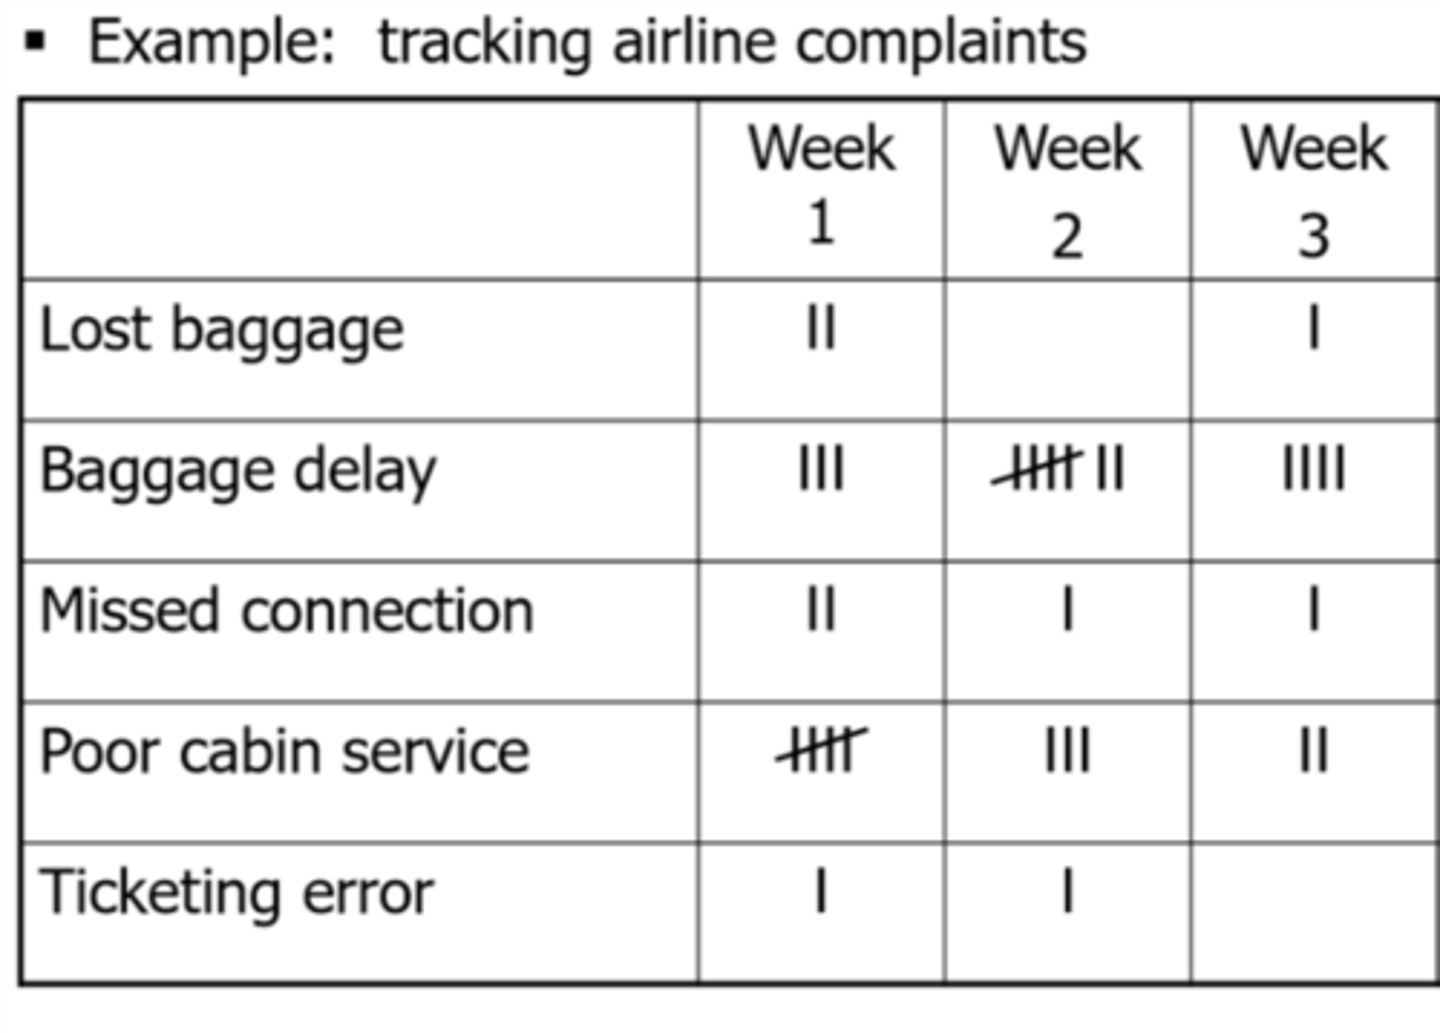
2. Checksheet
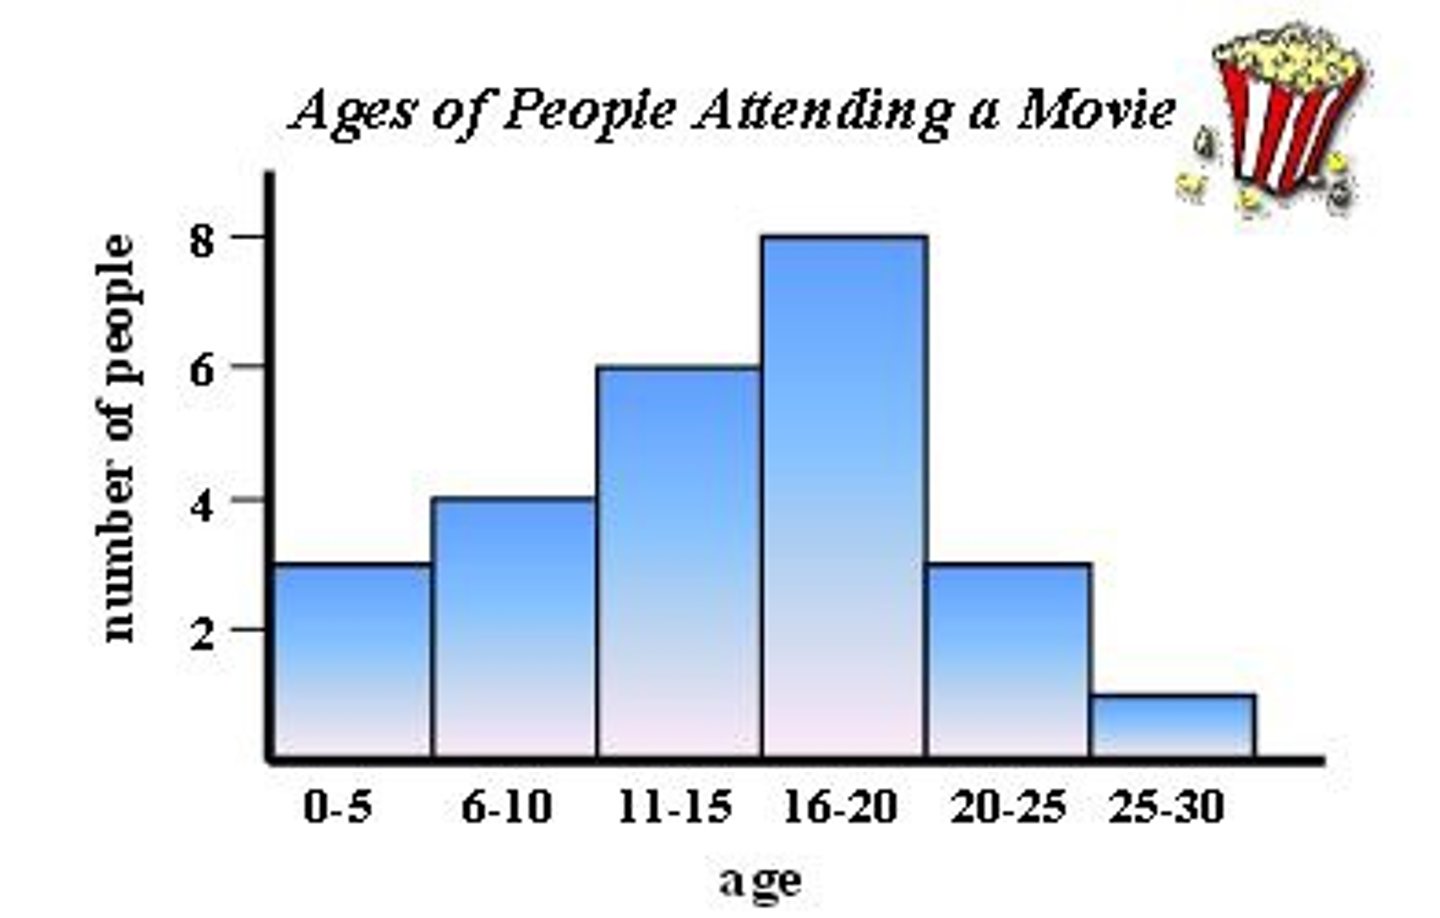
3. Histogram
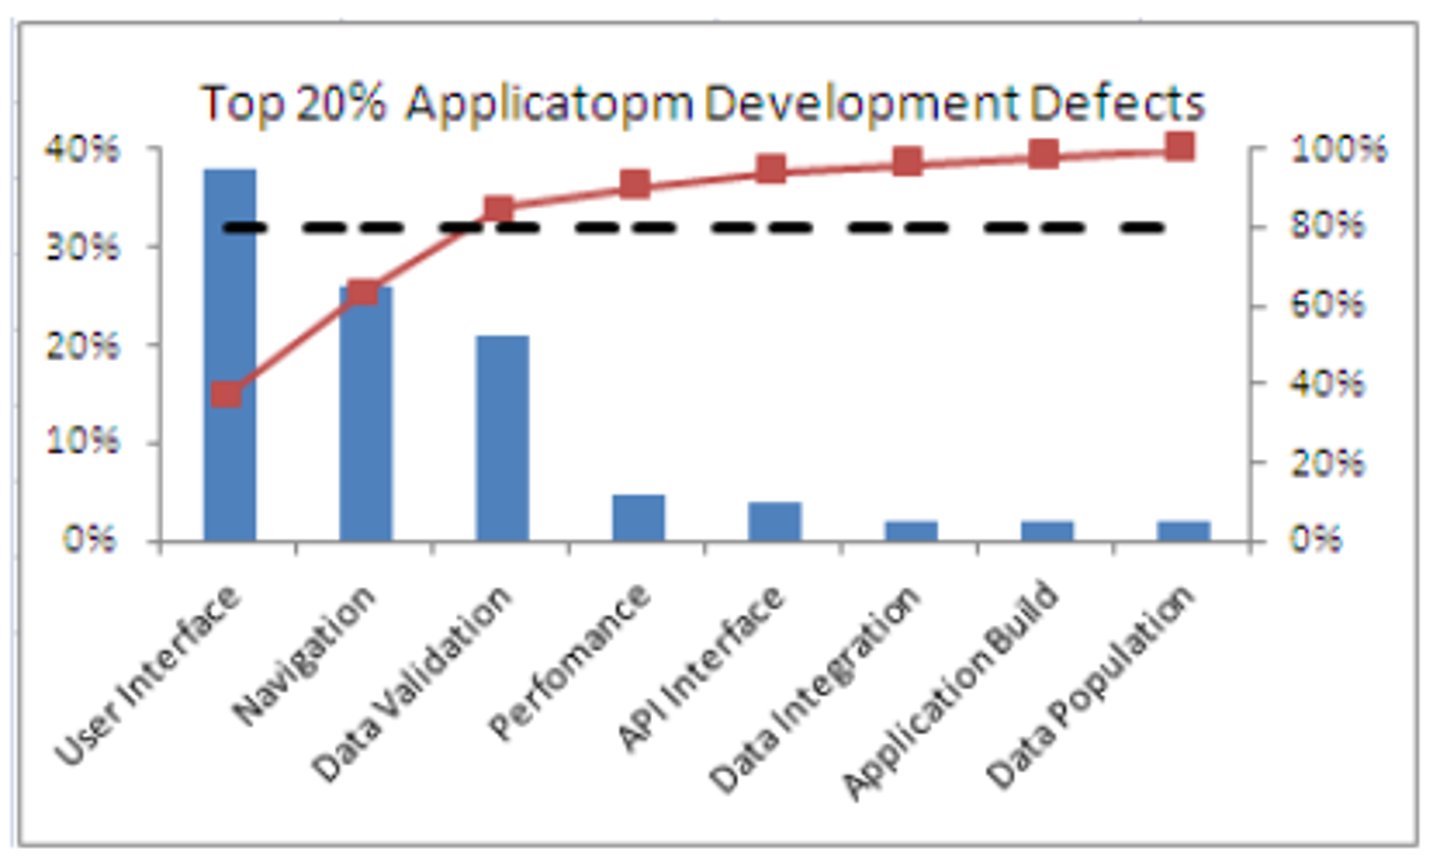
4. Pareto Diagram
5. Scatter Diagram
6. Cause-and-effect Diagram
7. Run Chart
Process Map
A picture of a process. Identifies the sequence of activities or the flow of materials and information in a process
Checksheet
Ensures consistency of data collected. Spot problems. NOT THE SAME AS A CHECKLIST; STARTS OUT EMPTY
Histogram
Picture of data. Allows us to see patters or trends that are difficult to see in tables or numbers; measures frequency of occurence
Pareto Diagram
Type of histogram
Shows data from the largest frequency to the smallest (80/20 Rule). Identifies PRIORITY
Scatter Diagram
Identifies possible relationships between two different sets of variables. A DISPLAY OF WHAT HAPPENS TO ONE VARIABLE WHEN ANOTHER CHANGES; shows coorelation BUT NOT CAUSATION

Cause and Effect Diagram (fish bone chart) (5Ms)
Identifies all possible causes of a specific problem
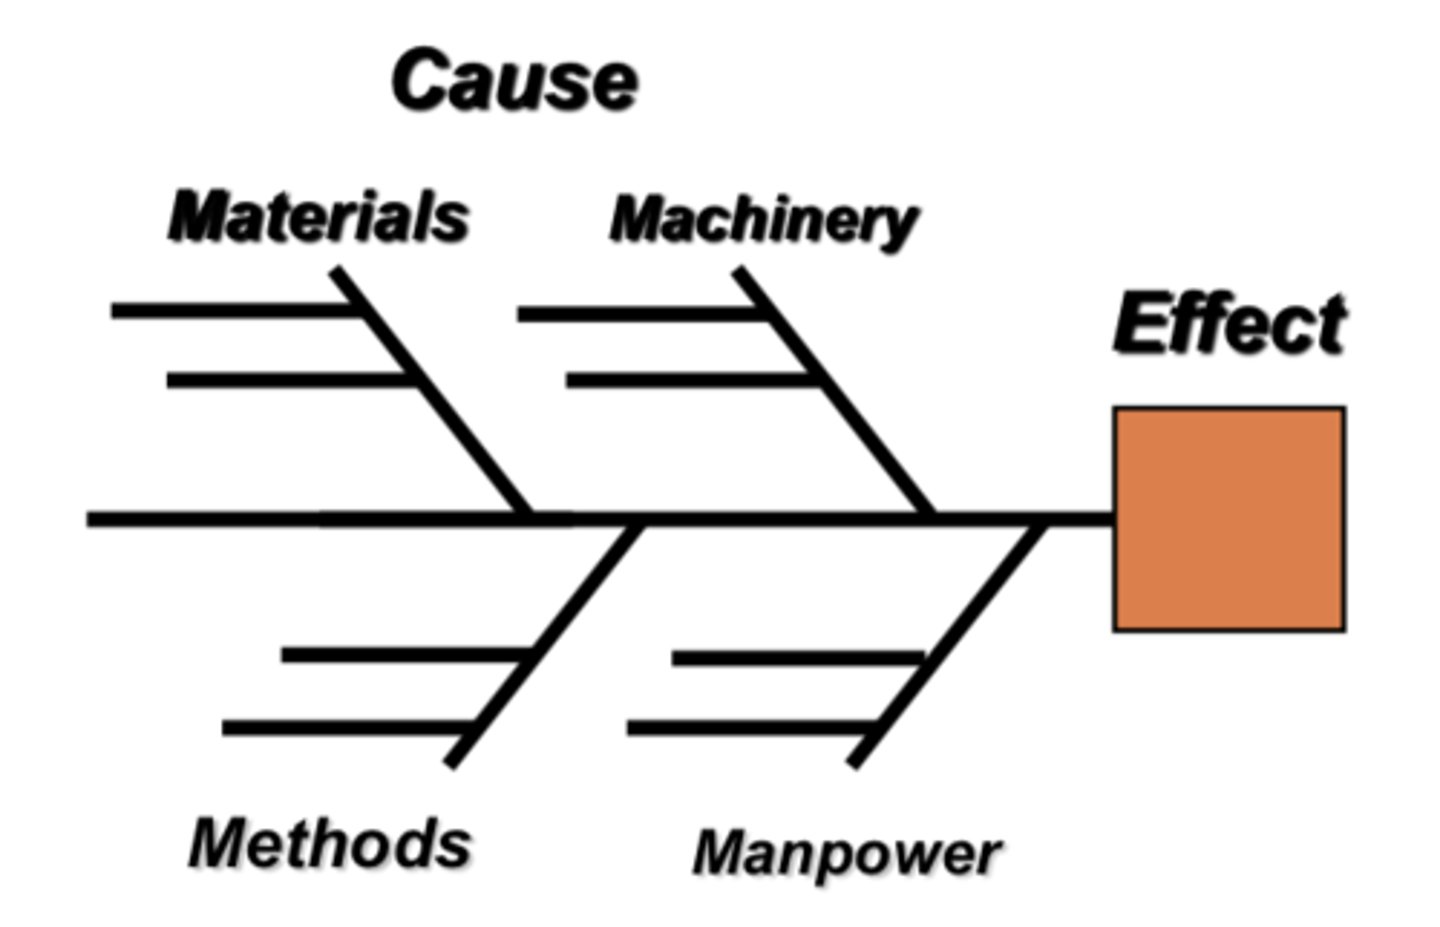
What are the 5 M's in aCause and Effect (Fish bone) Chart?
1. Machine
2. Materials
3. Man
4. Mother Natrue
5. Method
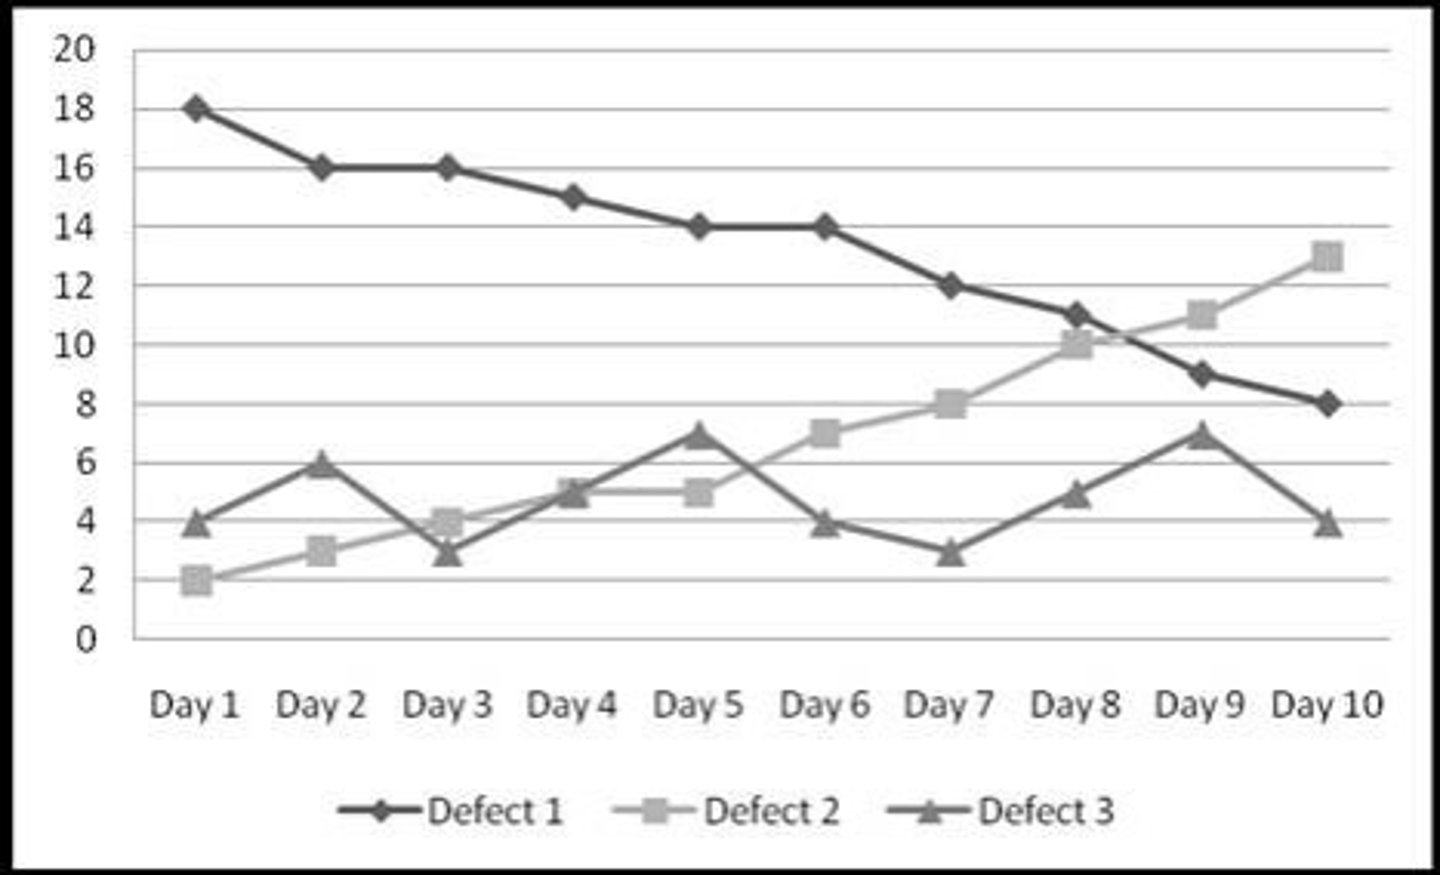
Run Chart
Displays data in the time sequence in which it occurred. helpful in spotting IMPACT OF CHANGE CAN NOT SHOW AVERAGE DATA)
Pareto principle
Establishes priority