Chapter 9: How to analyze time-series data
1/11
Earn XP
Description and Tags
Name | Mastery | Learn | Test | Matching | Spaced | Call with Kai |
|---|
No analytics yet
Send a link to your students to track their progress
12 Terms
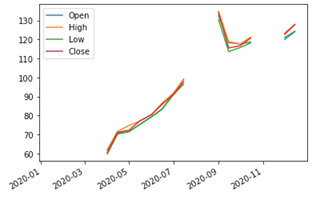
To fix the gaps in this plot of some reindexed data, you could:
a. upsample the data to fill the gaps
b. index a different subset of the data to avoid creating the gaps
c. downsample the data so that it will be aggregated instead of creating the gaps
d. define and call a function that adjusts the dates after the data has been reindexed
a. upsample the data to fill the gaps
2. When you use the label and closed parameters of the resample() method,
a. the label and closed parameters should be set to opposite values
b.the data for the closed bin edge won’t be included in that bin
c. the label parameter determines which bin edge will be used for the index value
c. the label parameter determines which bin edge will be used for the index value
3. Downsampling can improve plots by
a. smoothing the plotted line which makes it easier to interpret
b. aggregating the data before it is plotted
c. rounding the data before it is plotted
d. making the plotted line less smooth which adds detail to the plot
a. smoothing the plotted line which makes it easier to interpret
4. Reindexing affects plotting by
a. smoothing the curve of a plot
b. possibly adding blank rows, which can lead to gaps in the data
c. filling missing values in the data
d. allowing data to be plotted with Seaborn by removing the index
b. possibly adding blank rows, which can lead to gaps in the data
![<p>5. Refer to the mortality DataFrame. Given a date range that is stored in the dateRange variable, this code reindexes the data for the “1-4 Years” age group:</p><p> </p><p>a. mortality['1-4 Years'].reindex(dateRange)</p><p>b. mortality.query('Age_Group == "1-4 Years"').reindex(dateRange)</p><p>c. mortality.reindex(dateRange, columns=['Age_Group'])</p><p>d. mortality.query('Age_Group == "1-4 Years"').resample(dateRange).mean()</p>](https://knowt-user-attachments.s3.amazonaws.com/e89ddbf6-f6fe-4523-b5fb-db1474bdf4f2.png)
5. Refer to the mortality DataFrame. Given a date range that is stored in the dateRange variable, this code reindexes the data for the “1-4 Years” age group:
a. mortality['1-4 Years'].reindex(dateRange)
b. mortality.query('Age_Group == "1-4 Years"').reindex(dateRange)
c. mortality.reindex(dateRange, columns=['Age_Group'])
d. mortality.query('Age_Group == "1-4 Years"').resample(dateRange).mean()
b. mortality.query('Age_Group == "1-4 Years"').reindex(dateRange)
6. Refer to the mortality DataFrame. This code resamples the data so the index will be the first day of every 5 year period and the death rate will be the mean death rate for period.
a. mortality.resample(rule='5YS', aggfunc='mean')
b. mortality.resample(rule='Y5', columns=['Death_Rate'])
c. mortality.resample(rule='5YS').mean()
d. mortality.Death_Rate.resample(rule='Y5')
c. mortality.resample(rule='5YS').mean()
7. Refer to the Rolling Mortality DataFrames. This code uses rolling windows to produce the rolling_mortality DataFrame from the mortality DataFrame:
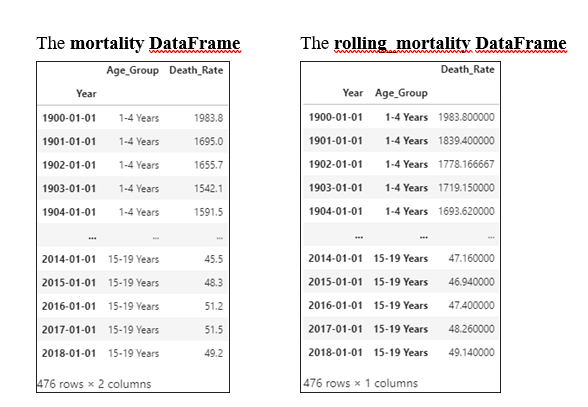
a. rolling_mortality = mortality.set_index('Age_Group', append=True).rolling(window=5, min_periods=1)
b. rolling_mortality = mortality.set_index('Age_Group', append=True).rolling(window=5, min_periods=1).mean()
c. rolling_mortality = mortality.expanding(window=5, min_periods=1).mean()
d. rolling_mortality = mortality.rolling(window=5, min_periods=1).mean()
b. rolling_mortality = mortality.set_index('Age_Group', append=True).rolling(window=5, min_periods=1).mean()
8. This This code generates a DatetimeIndex that holds the end date of every quarter in a year:
a. pd.date_range('01/01/2020', '12/31/2020', freq='Q')
b. pd.daterange('01/01/2020', '12/31/2020', freq='QS')
c. pd.reindex('01/01/2020', '12/31/2020', freq='Q')
d. pd.date_range('01/01/2020', '12/31/2020', freq='QE')
a. pd.date_range('01/01/2020', '12/31/2020', freq='Q')
9. Reindexing:
a. extends the current index with a new index, keeping all rows and leaving new index entries blank
b. replaces the index with a new index, keeping only the rows that match the new index
c. resets the index for a dataframe and retains it as a column
d. converts the data to a lower frequency and aggregates the data
b. replaces the index with a new index, keeping only the rows that match the new index
10. The difference between downsampling and upsampling is that
a. downsampling converts the index to a higher frequency but upsampling converts the data to a lower frequency
b. upsampling rounds the index up while downsampling rounds the index down
c. upsampling converts the index to a higher frequency but downsampling converts the index to a lower frequency
d. upsampling automatically aggregates the data but downsampling doesn’t
c. upsampling converts the index to a higher frequency but downsampling converts the index to a lower frequency

11. Refer to the Rolling Mortality DataFrames. This code plots the data in the rolling windows in the rolling_mortality DataFrame:
a. sns.relplot(data=rolling_mortality.reset_index(), x='Year',
y='Age_Group', hue='Death_Rate', kind='line')
b. rolling_mortality.plot()
c. sns.relplot(data=rolling_mortality, x='Year', y='Death_Rate',
hue='Age_Group', kind='line')
d. sns.relplot(data=rolling_mortality.reset_index(), x='Year',
y='Death_Rate', hue='Age_Group', kind='line')
sns.relplot(data=rolling_mortality.reset_index(), x='Year',
y='Death_Rate', hue='Age_Group', kind='line')
12. The expanding() method:
a. creates a set-sized running window for a column that can be used to apply other operations
b. creates a cumulative running window for a column that can be used to apply other operations
c. creates a cumulative running sum for a column
b. creates a cumulative running window for a column that can be used to apply other operations