BME438 Final Exam Study Guide (pt.2/2)
1/62
There's no tags or description
Looks like no tags are added yet.
Name | Mastery | Learn | Test | Matching | Spaced | Call with Kai |
|---|
No analytics yet
Send a link to your students to track their progress
63 Terms
Thermal noise
type of noise due to e- motion and electrical components of scanner cause changes in signal proportional to intensity
System noise
imperfect shimming, unstable gradient coils, and unstable RF fields causes changes in signal
Scanner drift
variation in B0, changing frequency of proton precession, and unstable RF field causes subsequent excitation pulses to be slightly different. More significant in fMRI because signals are observed over time, unlike anatomical MRI.
Motion and physiological noise
head motion and other body motions causes voxels to contain a different area of the brain. respiration changes lung volume and cardiac pulsation changes B0 at the brain
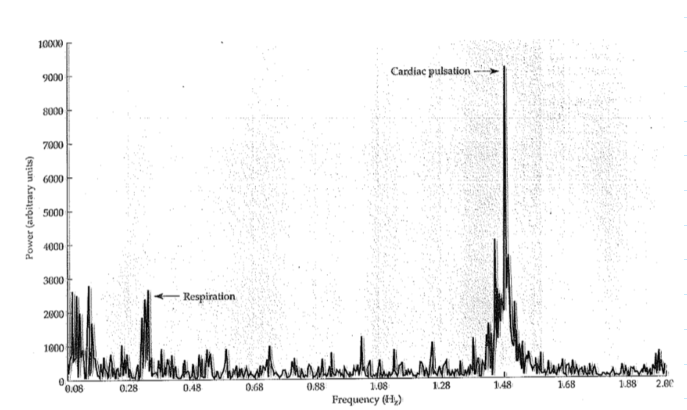
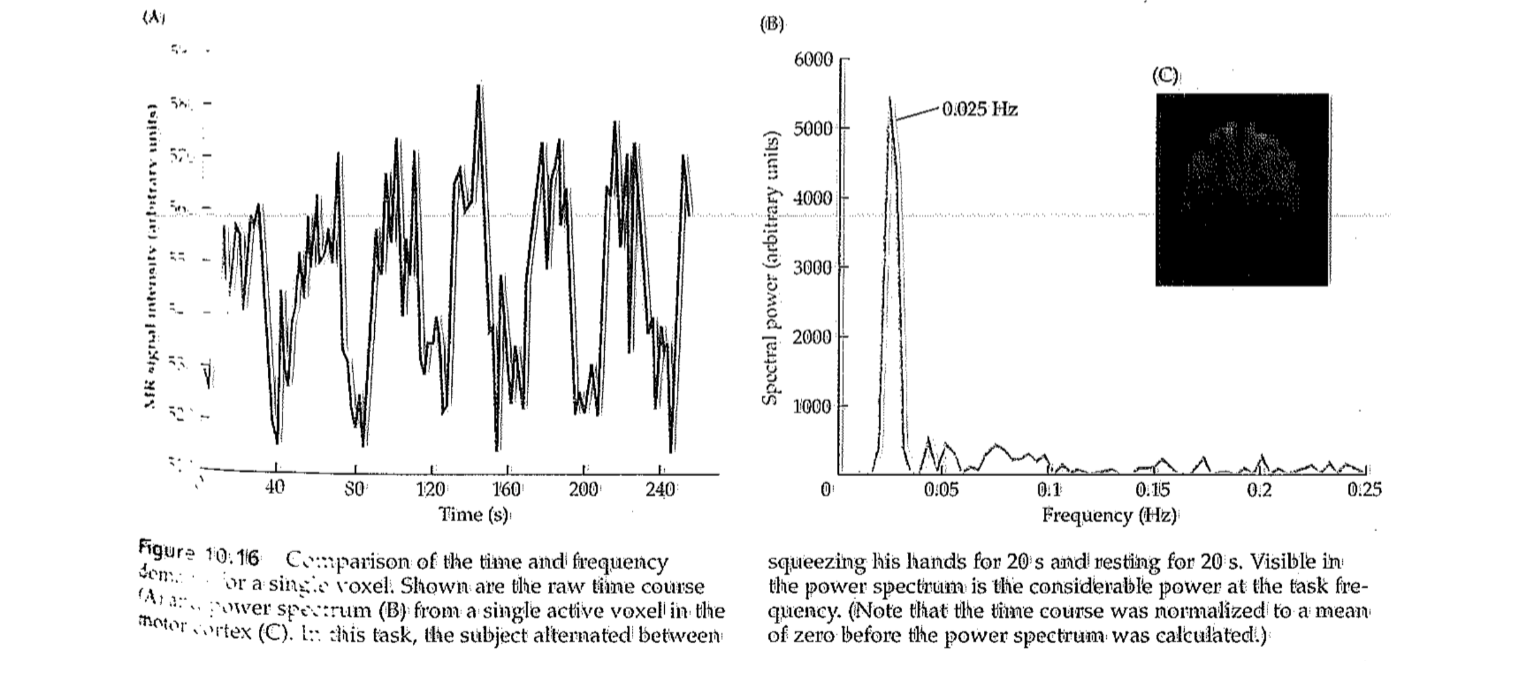
If TR = 2 sec, looking at the spectral analysis, which peaks will alias?
Sampling f = 1 / TR = 0.5 Hz. According to Nyquist, frequencies up to fs/2 (0.25 Hz) won’t alias > respiration and cardiac pulsation
Non-task related neural variability
subject thinks about something other than the task they are asked to perform, causing change in signal intensities > producing activation map based on hemodynamic response causes wanted regions to not appear and unwanted regions to appear activated
Behavioral and cognitive variability
prolonged execution of task causes fatigue, altering speed of response vs. accuracy, and also causing different regions to activate when performed incorrectly as well as strategy changes.
How to reduce noise from BOLD signal acquisition
signal averaging
Preprocessing steps of fMRI data
quality assurance - phantom testing, raw data testing
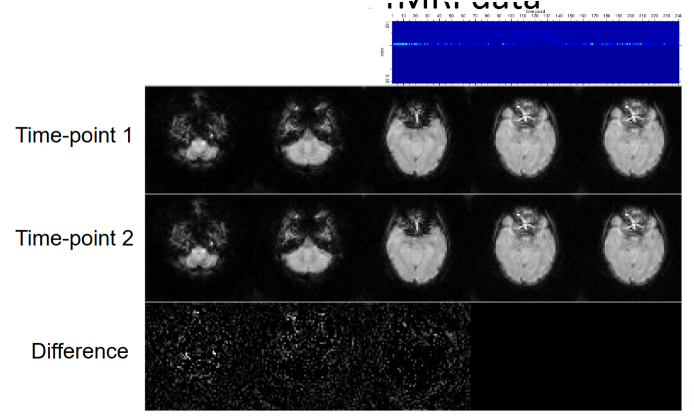
Scanner hiccup
for some reason, scanner copy and pastes same image for later time points (later slices)
Post-processing steps for fMRI
Slice acquisition time correction > Motion correction > distortion correction > functional structural coregistration > temporal filtering > spatial filtering
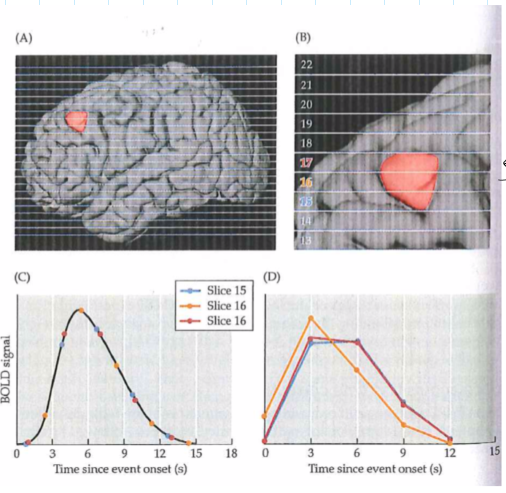
Slice acquisition time correction
used with interleaved acquisition; initially, later slices (even slices) are collected TR/2 later, therefore a shift in time for each voxel is required to sync the even slices with the odd slices
Motion correction
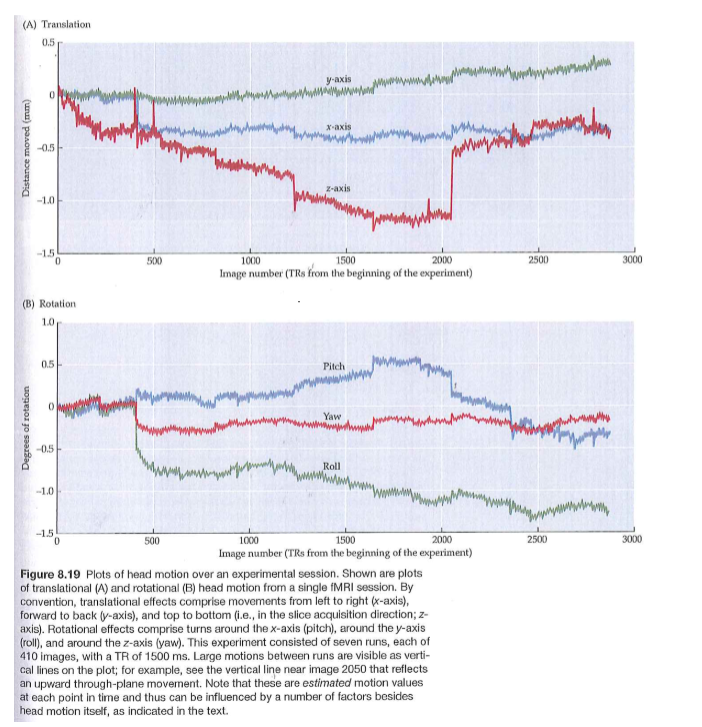
translation (x,y,z) and rotation (xy, yz,xz) correction by coregistering fMRI image with reference image and using cost function to minimize difference between 2
What does motion correction not fix
local changes in B-field and spin history
Distortion correction
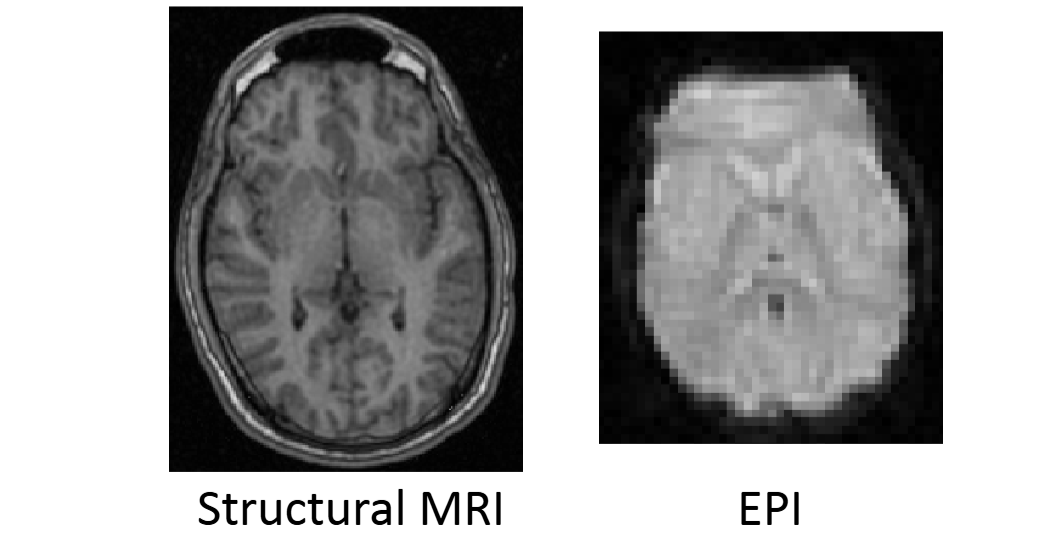
EPI acquisition causes distortions due to susceptibility artifacts. Perform field mapping to correct for phase accumulation and collect EPI data with forward and reverse phase encoding gradient to subtract distorted regions
Functional structural coregistration
EPI fMRI has low detail and contrast. register with anatomical image to account for these two shortcomings.
Temporal filtering
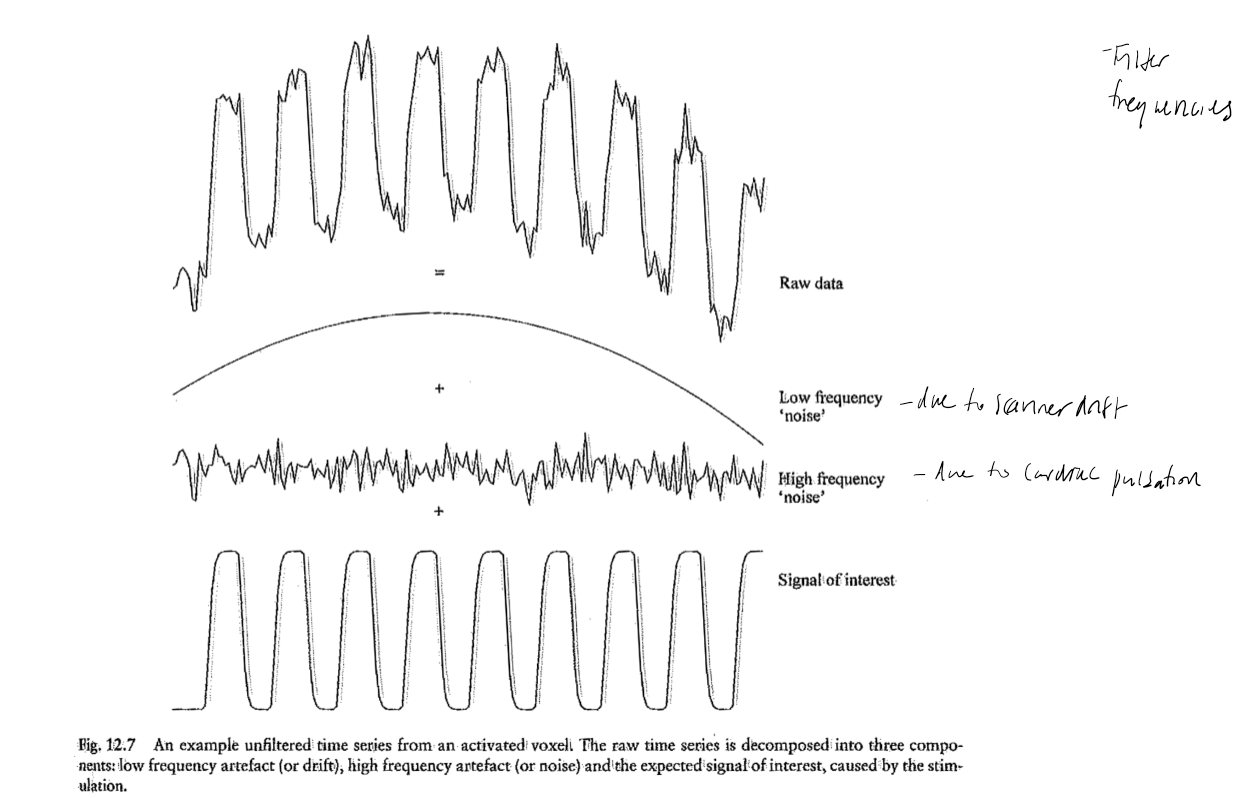
remove signal variations not related to task performed. Sampling frequency is 1/TR, max f in frequency spectrum is 1/2TR (nyquist). Task frequency is 1/task duration.
Spatial filtering
smoothing or blurring image by applying low pass spatial filter to spread voxel data across neighboring voxels.
Advantages and disadvantages of spatial filtering
increases SNR and validity. decreases false positives and signals become more normally distributed. however too much attenuates activation.
Steps to fMRI data analysis
Experimental design > quality assurance > quality control > preprocessing > statistical analysis
Components of experimental design
Hypothesis (hemodynamic, neuronal, psychological), experiment (test of hypothesis), design
Example of fMRI Independent variable
finger-tapping, flashing image, reading word, etc.
Example of fMRI dependent variable
BOLD signal
Confounding factors
the ‘off’ or control condition must not activate same part of the brain.
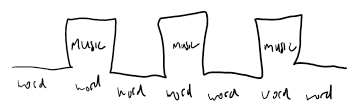
Block design
experimental condition (music+word) and control condition (word) to test whether it answers research question (is word memorization different with music?). it allows for maximum increase in BOLD signal
When is block design appropriate for research question
Concentration to task is required
When is block design inappropriate for research question?
task involves element of surprise
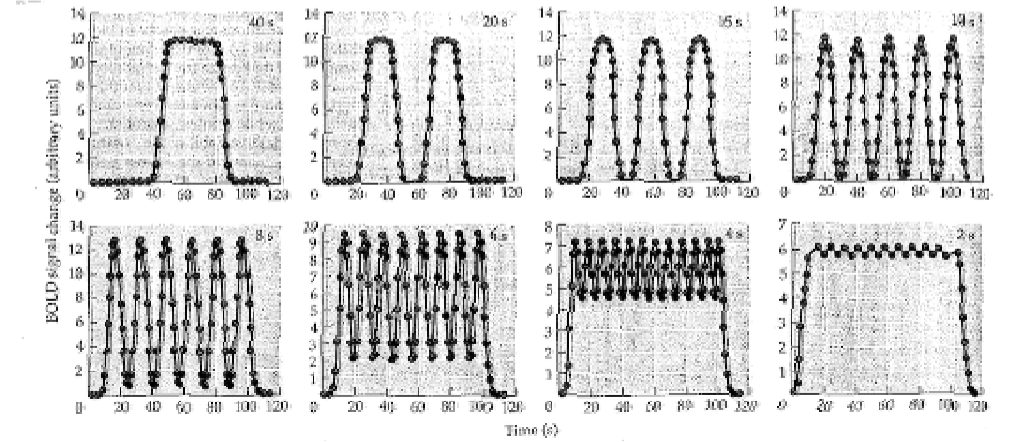
Duration of block conditions?
Each block should be same duration. Too short makes tasks too easy and BOLD signal may not reach max or minimum value decreasing variation . Too long makes tasks too difficult and may make task frequency = scanner drift frequency
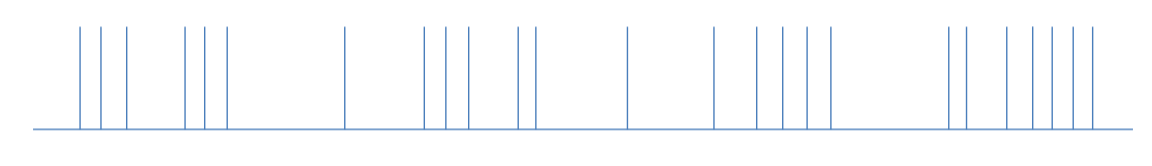
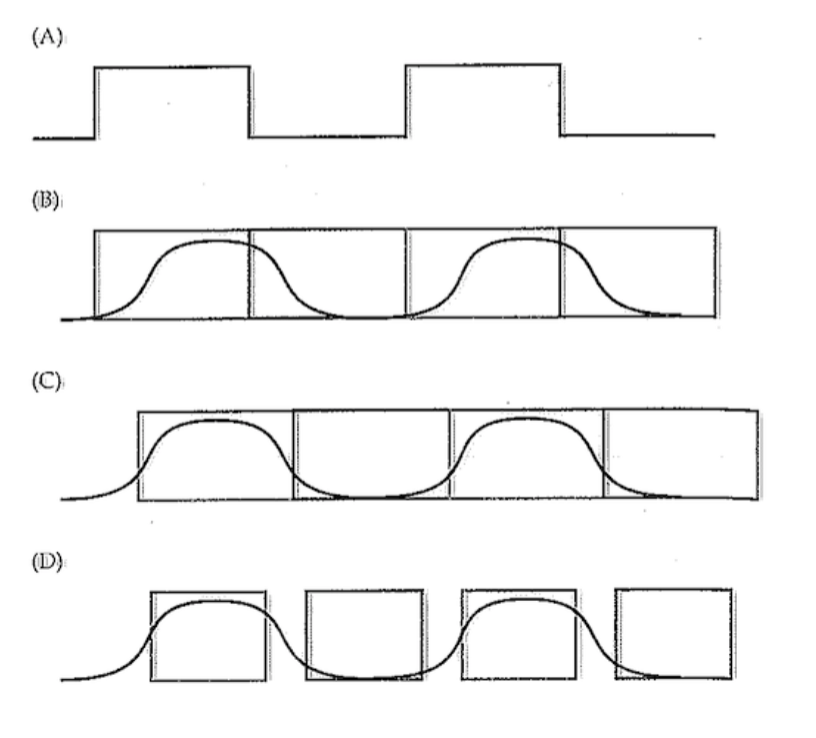
Event-related designs
short-duration stimuli presented at different interstimulus intervals to approximate hemodynamic response function
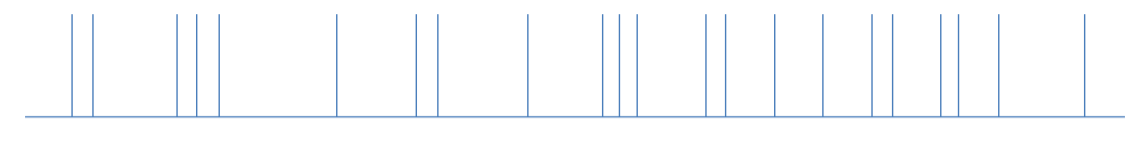
Semi-random design
probability of event changes in sinusoidal manner
Advantages of event- and semi-random- designs
allows researchers to answer questions not answerable with block design. allows separate analysis of error trials and correct trials. allows task to be defined to the subject after exam finished.
Which experimental design has high detection and low estimation?
Block because BOLD signal reaches maximum intensity
Which experimental design has good estimation but bad detection?
event-related
Which experimental design has even ok detection and ok estimation?
Semi-random
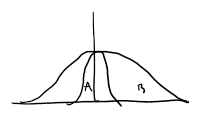
Type I error: false positive
deciding null hypothesis is false when it’s really true (voxel is actually inactive)
Type II error: false negative
accepting null hypothesis when it’s really false (voxel is actually activated)
Student’s t-test
evaluates if mean values of 2 sets of observations (x = experimental measurements, y = control measurements) are significantly different
t-score formula
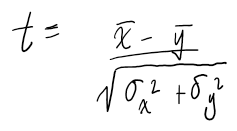
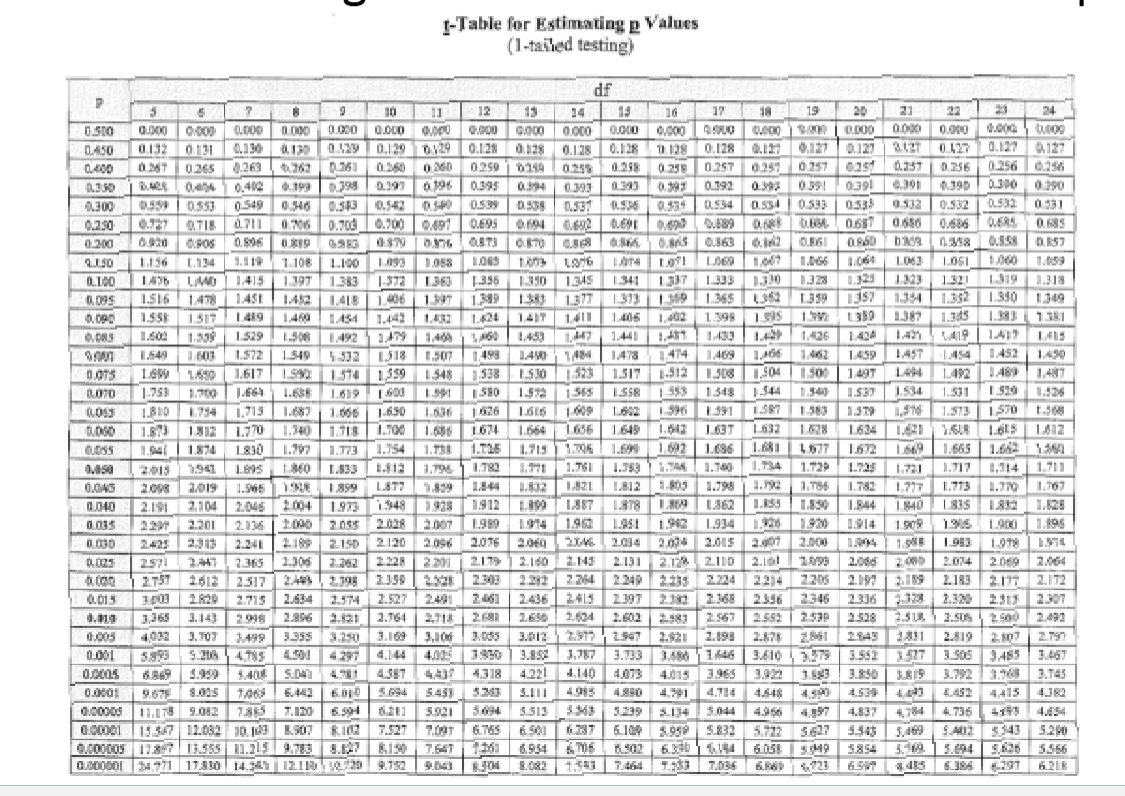
t-score and p-value
p-value increases with t-score and degrees of freedom
How to increase t-score
shift and/or narrow sampling window to better reflect block design
Disdvantage of t-test
insensitive to differences in variability. only compares groups of signals and not whole signal time-course
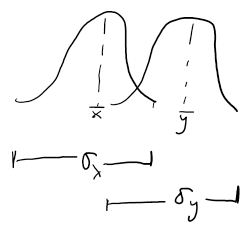
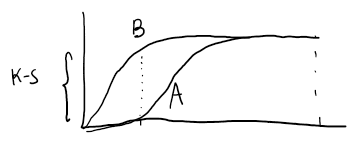
Kolmogorov-Smirnov (K-S) test
evaluates for differences in variability between 2 distributions
K-S score
max difference between 2 cumulative distributions
Disadvantage of K-S test
insensitive to differences in mean values. only compares group of signals and not whole signal time course.
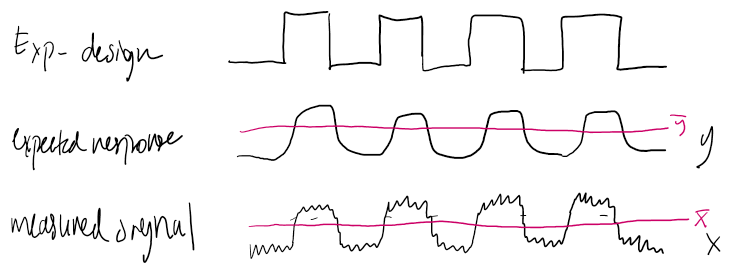
Correlation analysis
compares signal time course to expected signal time course
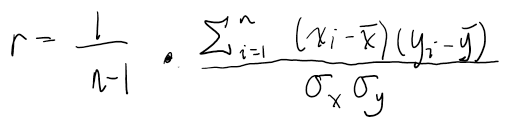
Correlation coefficient formula
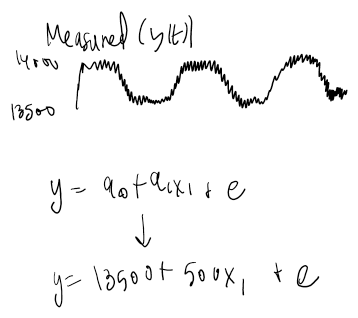
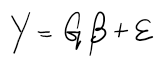
General linear model
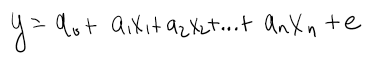
x1 represents time-bound function related to task, and xn represents nuisance factors. Adding more factors decreases error (high t-score) however decreases degrees of freedom decreasing t-score and p value. Latter is compensated by adding more time points to compensate for loss of df or by adding meaningful factors (related to task) to increase p value..
Example of general linear model
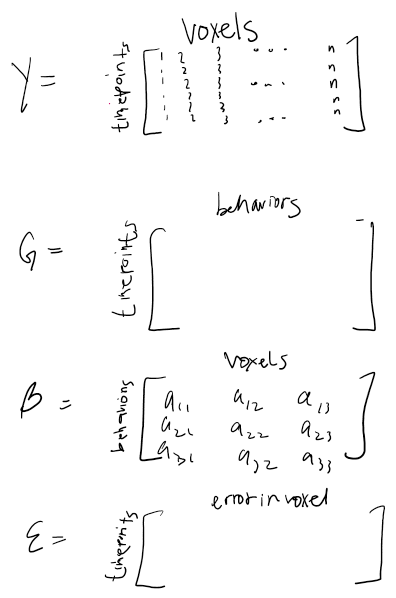
General Linear Model with multiple voxels
Multiple comparisons problem
as number of voxels increase, the probability of no false positives decreases (1-alpha)^n
Bonferroni correction
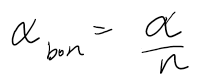
this type of correction very strict and reduces false positives however increases false negatives
Gaussian correction
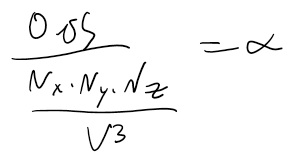
V is the FWHM of smoothness in data. use this due to the fact that neighboring voxels are not spatially independent, therefore there are less than Nx*Ny*Nz unique signal time courses. less conservative.
Region of interest analysis
Draw ROI and average signal time courses. Adv: only one statistical test, higher SNR, easier to compare data between subjects. Disadv: hard to select ROI accurately, time consuming, prone to bias, same anatomy doesn’t guarantee same function
What does BOLD signal measure?
hemodynamic response function (HRF), CBF, CMRO2, CBV
Cerebral blood flow (CBF)
vol of blood in capillary bed / 100 g of tissue supplied / time OR vol of blood in capillary bed / vol of tissue supplied / time.
Cerebral blood volume
vol of tissue occupied by blood / vol of tissue (%). refers to arterial, venous, and capillary blood. changes due to contraction/dilation of arteries, expansion of veins, and recruitment of capillaries.
Transit time
CBV / CBF
What does contrast agent measure?
Signal inversely proportional to CBV
Arterial spin labeling
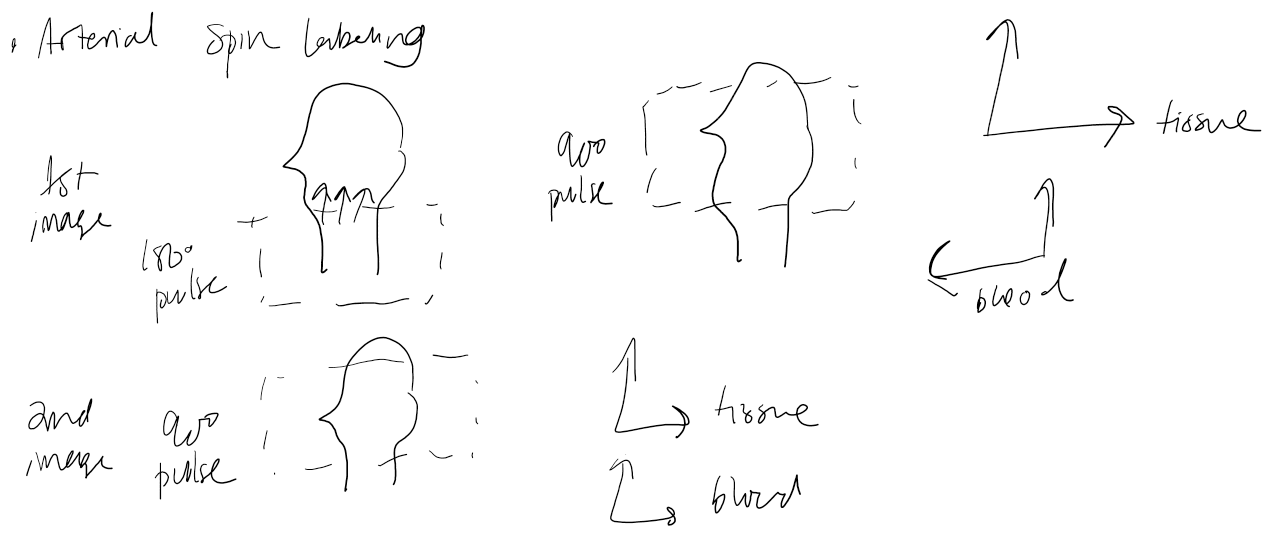
Acquires perfusion weighted image. Signal diference proportional to CBF
Total rate of arterial flow
local CBF * voxel volume
Volume of blood delivered during inversion time
CBF x V x TI
Fraction of voxel volume replaced by blood during inversion time
CBF * TI
Ernst Angle
determines optimal tip angle for TR less than 5 * T1. tip angle = e-TR/T1.