econ formulas, graphs and stuff
1/65
There's no tags or description
Looks like no tags are added yet.
Name | Mastery | Learn | Test | Matching | Spaced | Call with Kai |
|---|
No analytics yet
Send a link to your students to track their progress
66 Terms
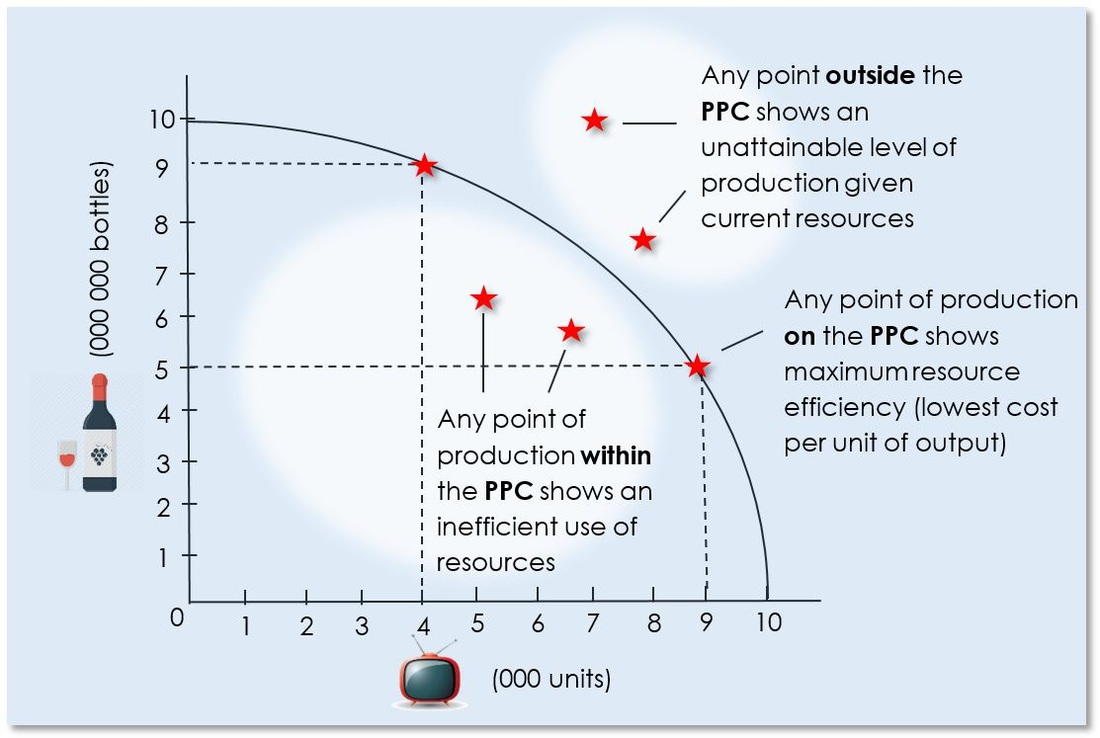
Chap 1: PPF
llustrates scarcity, opportunity cost, and efficiency
Chap 2: GDP Formula
Y=C+I+G+NX
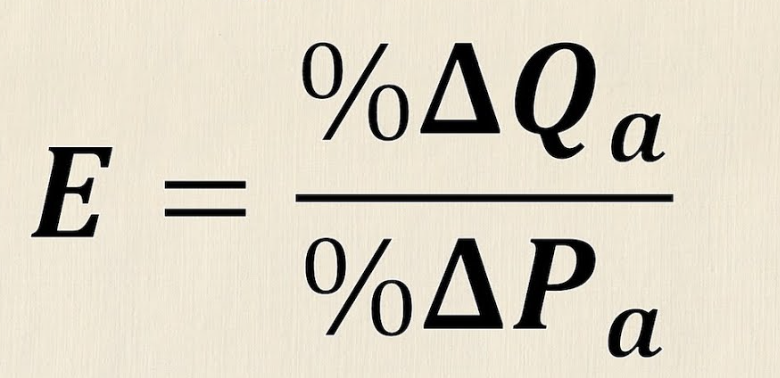
Chap 2: PED

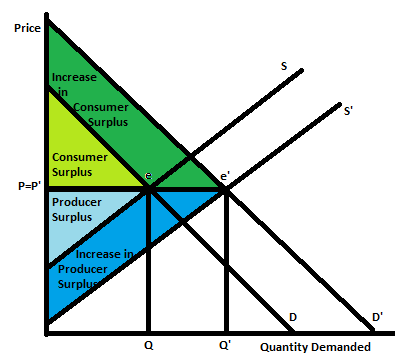
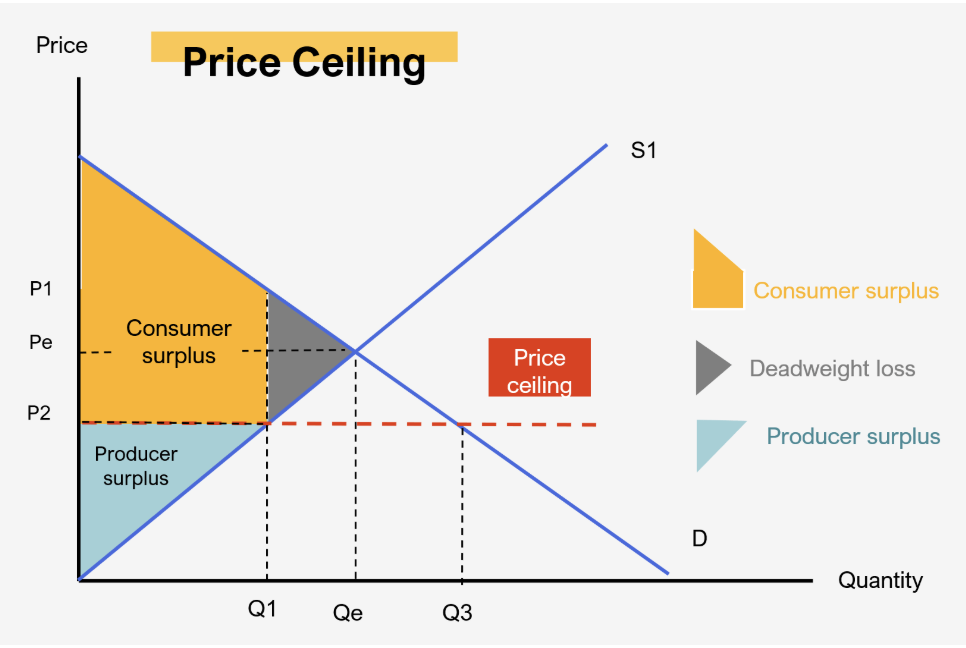
Chap 2: Consumer & Producer Surplus
Chap 3: (Own Price) PED
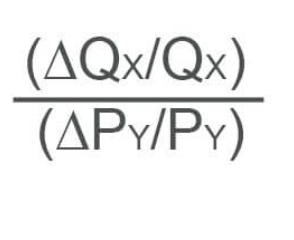
Chap 3: Cross Price Elasticity
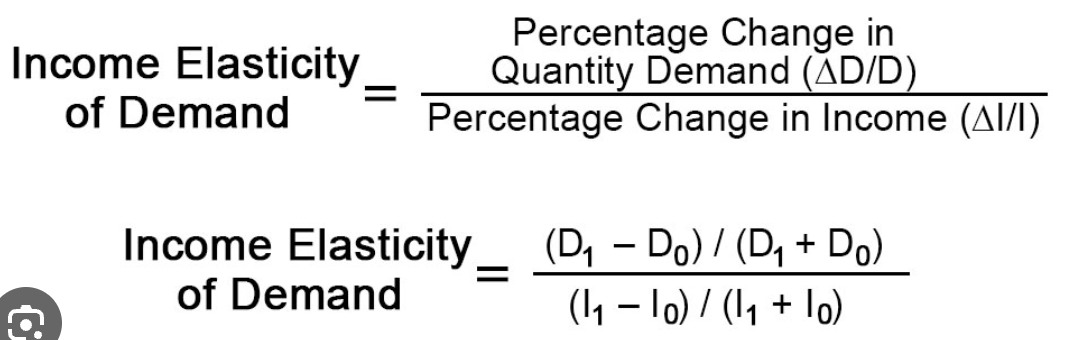
Chap 3: Income Elasticity of Demand
Chap 3: Elastic v Inelastic Demand
Elastic if PED > 1, inelastic if PED < 1
Chap 3: Total Revenue Relationship
Total revenue changes based on elasticity; elastic demand increases revenue with price decrease
Chap 4: Budget Constraint

Chap 4: Marginal Rate of Substitution (MRS)
rate at which a consumer is willing to substitute one good for another

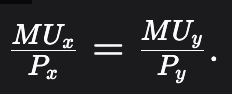
Chap 4: Utility Maximization Condition
Chap 4: Indifference Curve
Graphs showing combinations of goods that provide the same utility, shows preferences
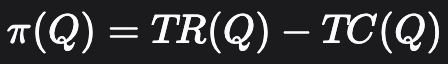
Chap 5: Profit Equation
profit as revenue minus total cost
Chap 5: MR = MC
profit maximization occurs when MR = MC

Chap 5: Total Revenue Function

Chap 5: AC and MC relationship
AC increases if MC > AC and decreases if MC < AC

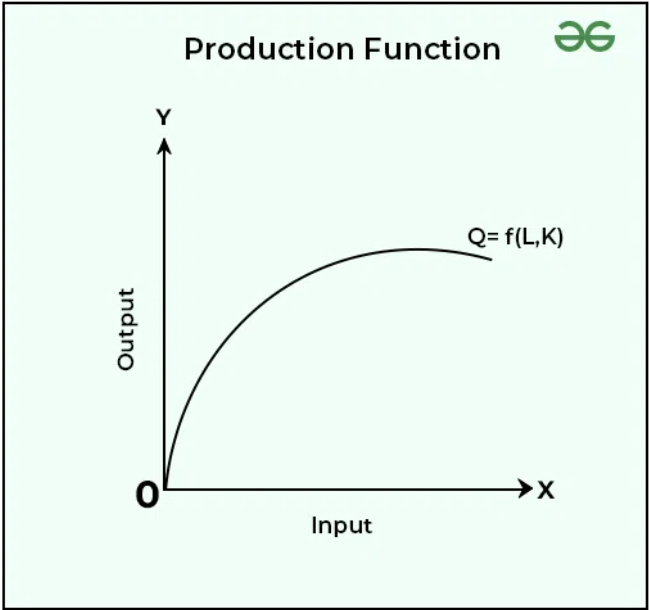
Chap 5: Production Function
Q = f(K,L) (long run) Q = f(L) (short run)
Chap 6: Equilibrium Condition
P = MC for profit maximization
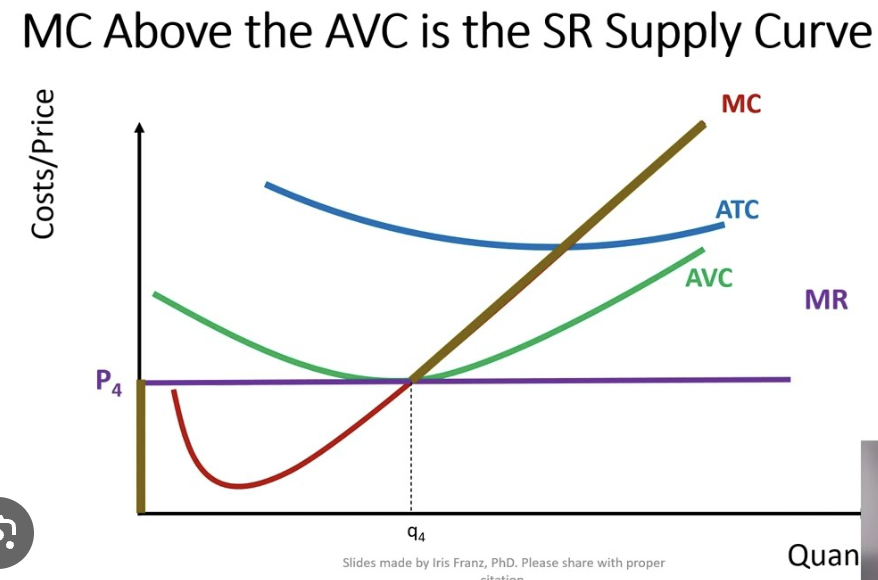
Chap 6: Short Run Supply Curve
The firm's supply curve is the MC curve above the AVC
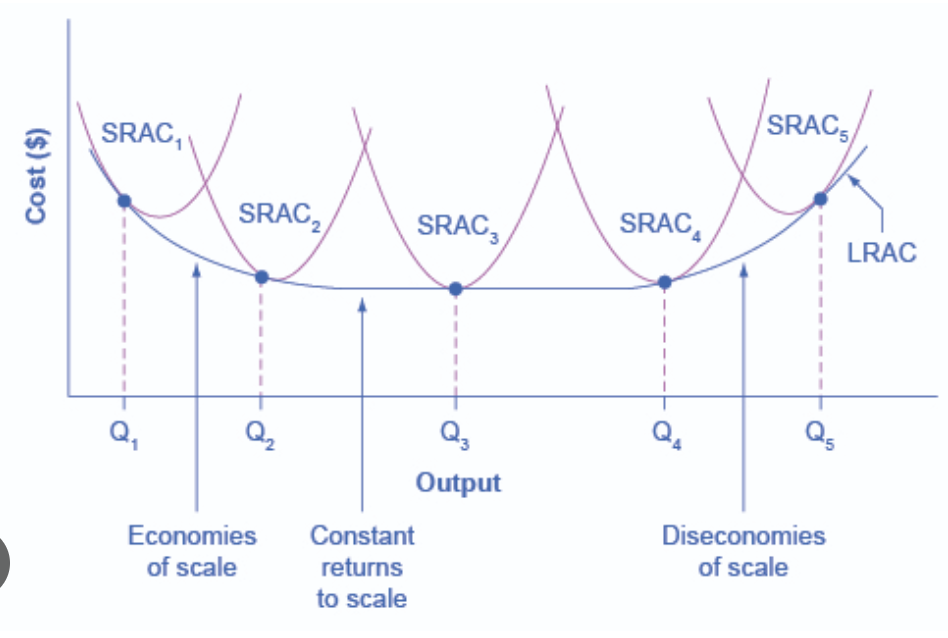
Chap 6: Long Run Average Cost Curve
Firms enter/exit until P = LAC
Chap 6: Consumer & Producer Surplus in Perf Comp
Maximized under perfect competition
Chap 6: Shifts in Demand/Supply affecting Eq
Affect equilibrium price and quantity
Chap 7: Monopoly Pricing Rule
Profit maximization occurs where MR = MC
Chap 7: Marginal Revenue Relation
marginal revenue is less than price (for monopoly)

Chap 7: Deadweight Loss
Area representing lost consumer and producer surplus due to monopoly pricing
Chap 7: Social Cost of Monopoly
Allocative inefficiency due to higher prices and lower output
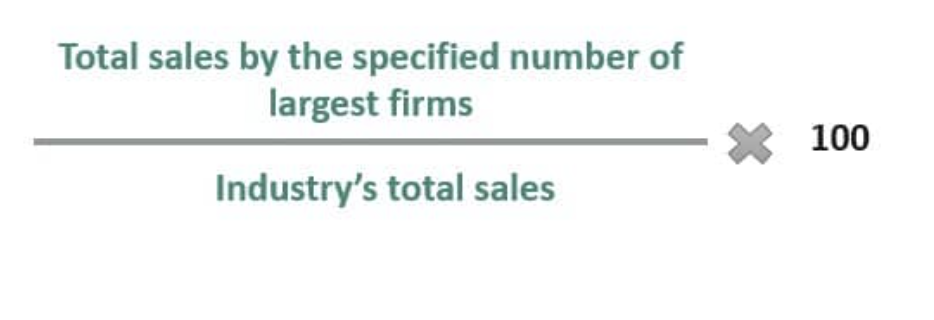
Chap 8: N Firm Concentration Ratio
Measures market dominance by largest firms
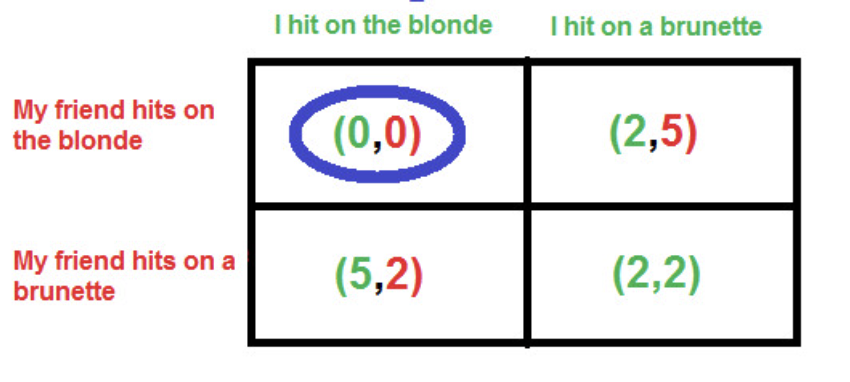
Chap 8: Nash Equilibrium
Stable outcome in game theory where no player has an incentive to change. Game theory is meant for analyzing strategic interactions among firms
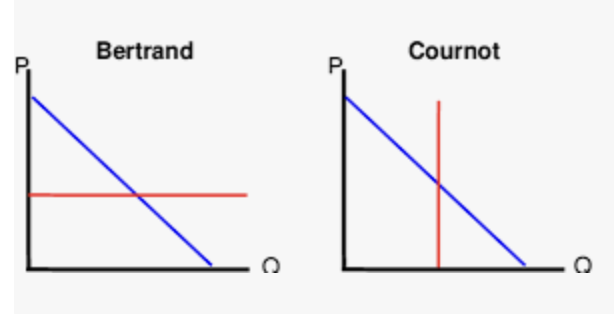
Chap 8: Cournot v Bertrand Competition
Output competition vs. price competition
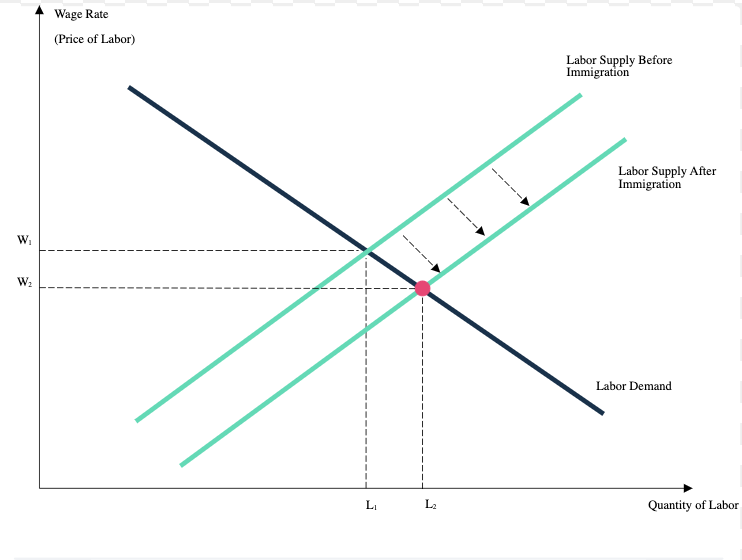
Chap 9: Labor Demand Equation
wage equals marginal revenue product of labor

Chap 9: Labor Supply Curve
Depends on wage rate, participation rate, and hours supplied
Chap 9: Equilibrium Wage
Where demand for labor equals supply
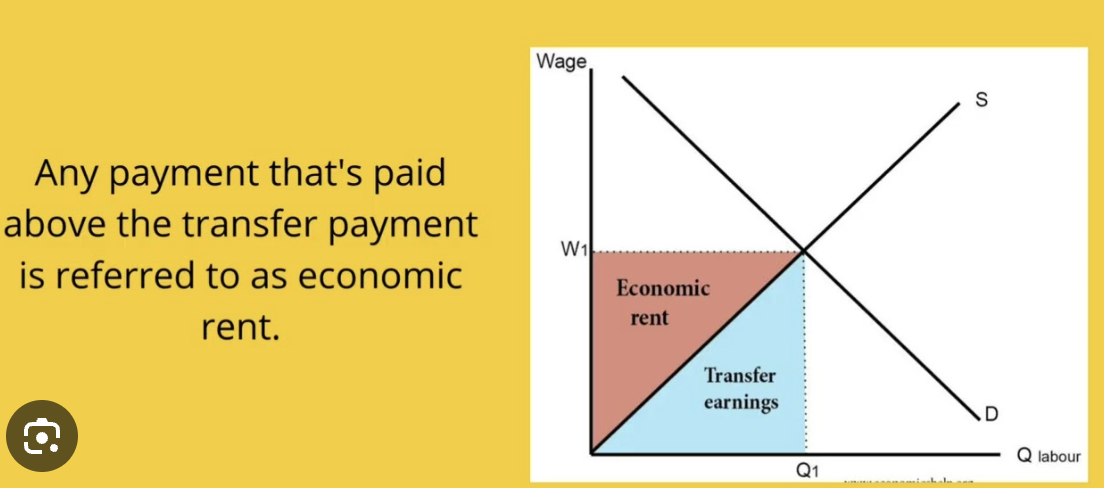
Chap 9: Economic Rent
an amount of money earned that exceeds that which is economically or socially necessary
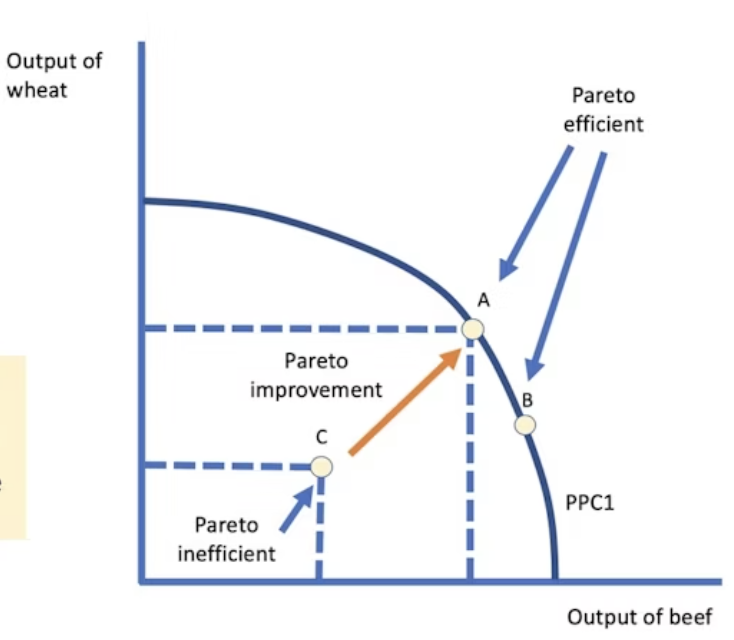
Chap 10: Pareto Efficiency
No reallocation can make someone better off without making someone worse off
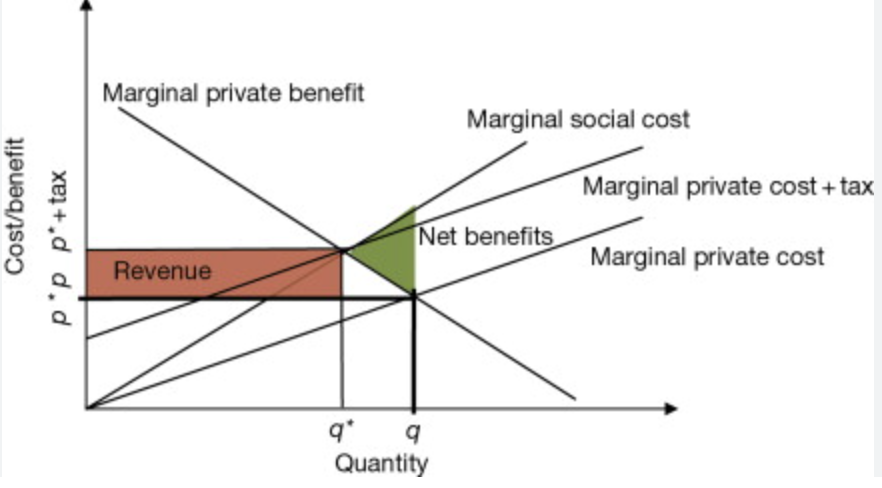
Chap 10: Pigouvian Tax
Tax to correct for negative externalities
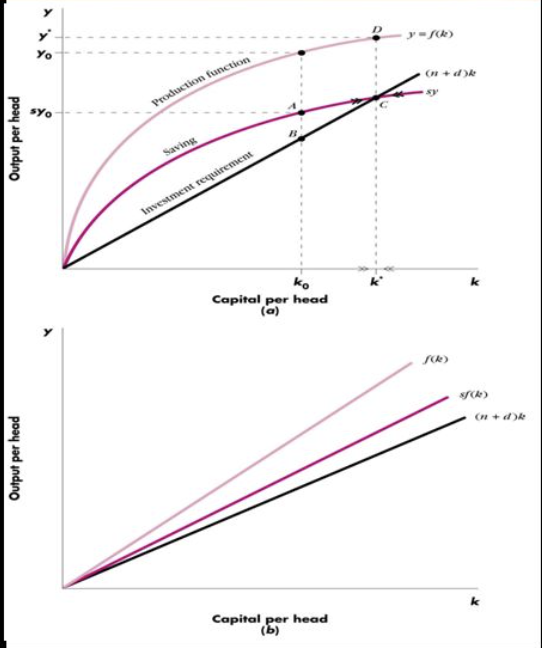
Chap 12: Solow Growth Model
Y (output) = A (technological progress) x f(K,L) , output as a function of capital and labor
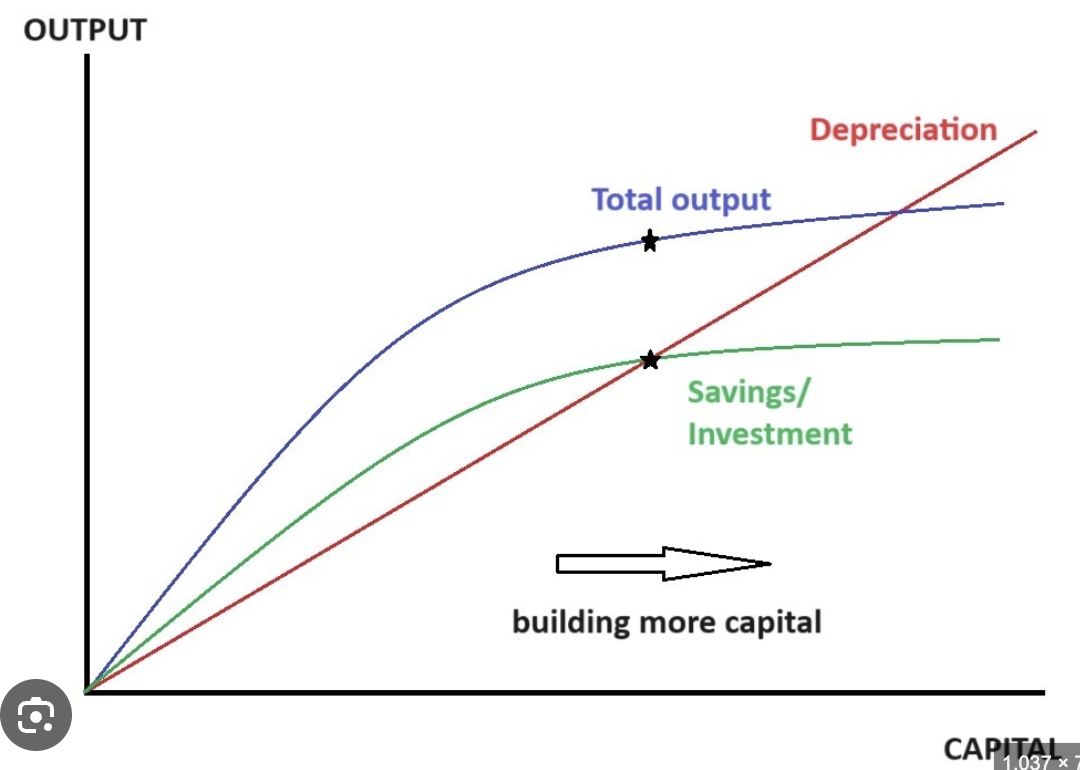
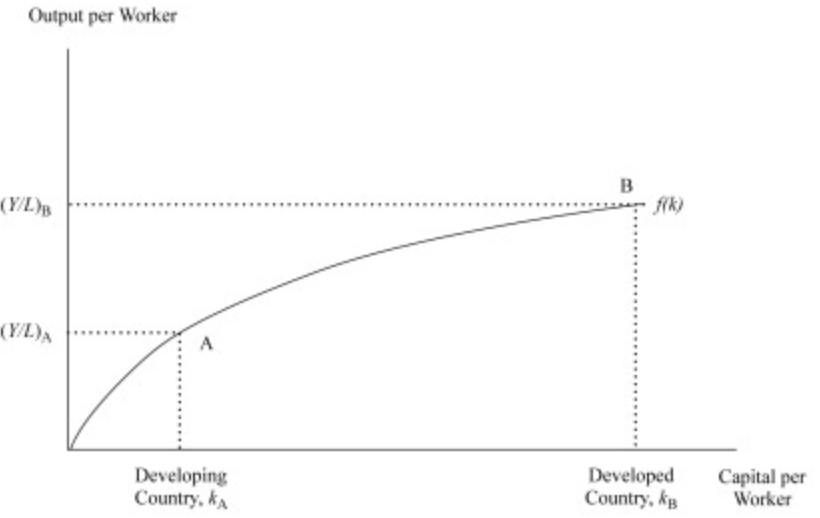
Chap 12: Convergence Hypothesis
Poorer countries can catch up to richer ones over time
Chap 12: Endogenous (Romer) Growth Model
Growth driven by factors like human capital and innovation
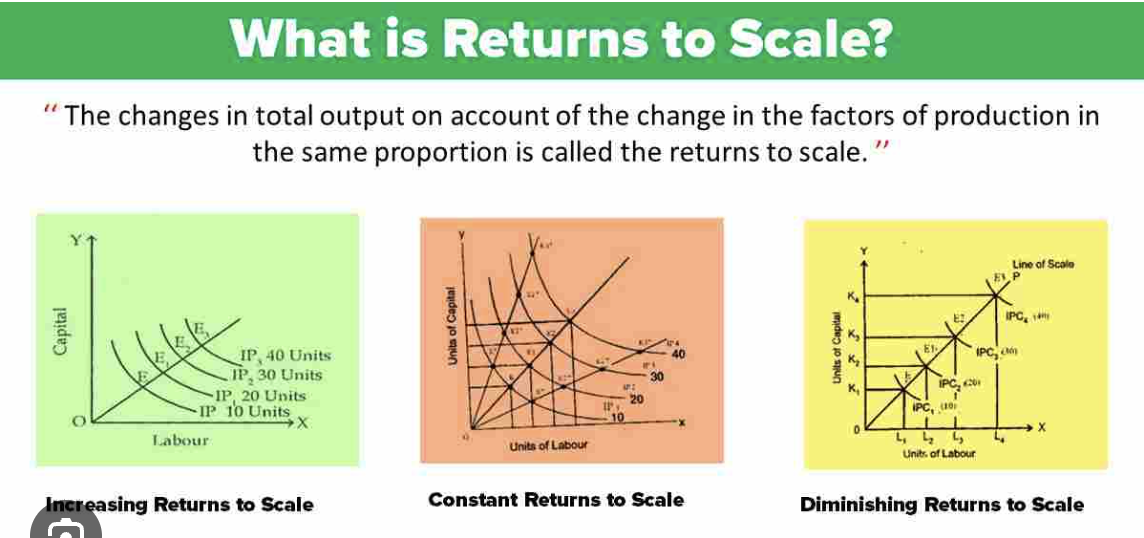
Chap 12: Returns to Scale
multiplying each input function by a multiplier. If the result is greater than the multiplier, it increases returns to scale. If the result is less than the multiplier, then the production function will result in decreasing return to scale
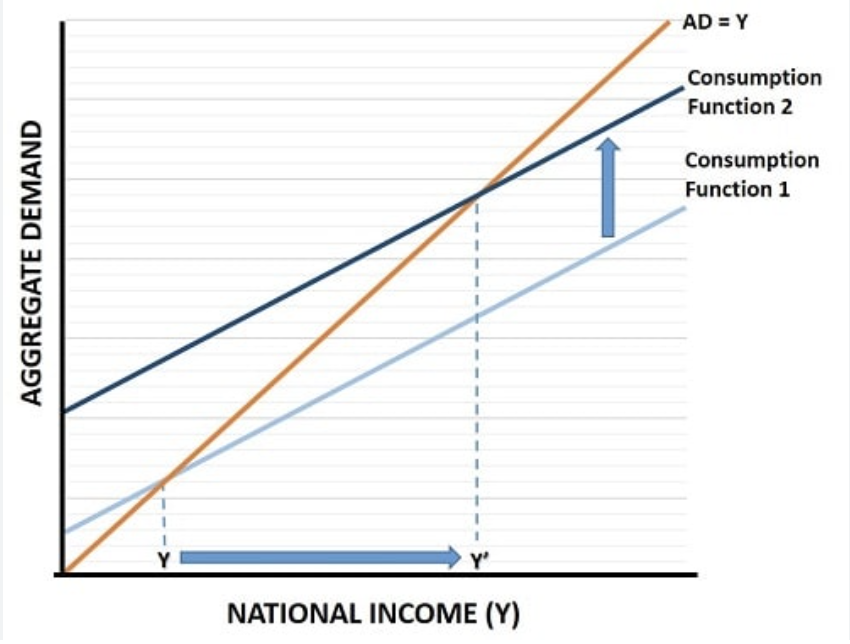
Chap 13: Multiplier Effect

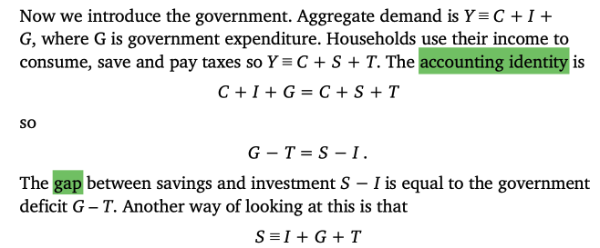
Chap 13: Accounting Identity
consumption + investment + gov exp = consumption + savings + taxation
Chap 13: GNP at market prices
income at market prices + depreciation = GDP at national prices + net property income from abroad
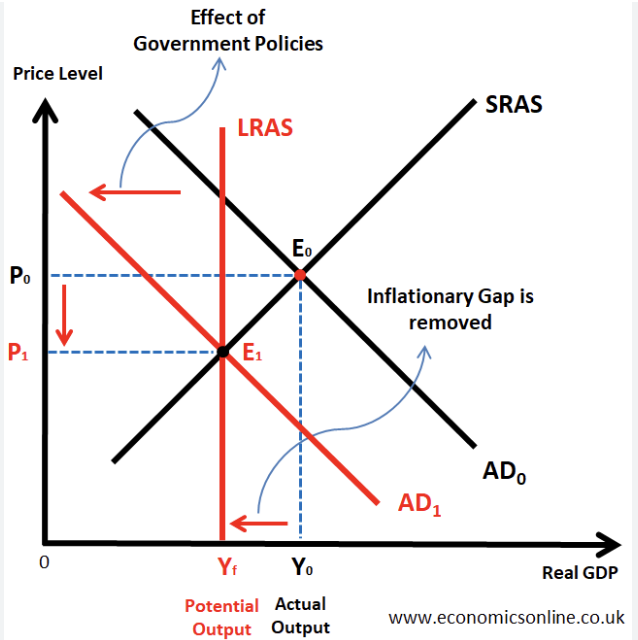
Chap 13: Inflationary Gap
Chap 14: Demand For Money

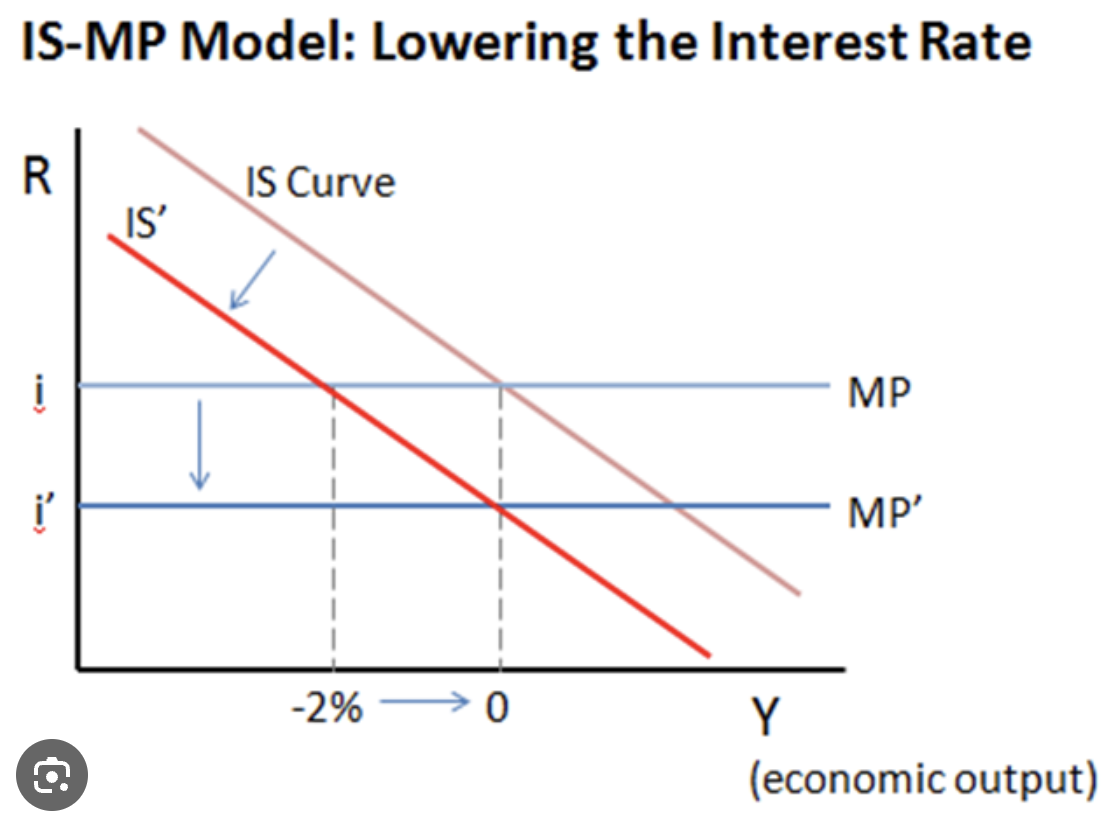
Chap 15: IS-MP Model
Y = C + I + G
Chap 15: Keynesian Law
Y = C + S, I = C + I + G
Chap 16: Aggregate Demand Function

Chap 16: Short Run Aggregate Supply Curve (SAS)
upward sloping because firms tend to increase price levels when demand increases

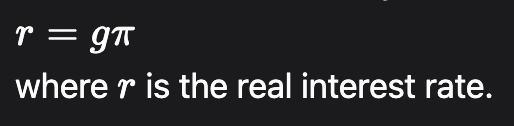
Chap 16: Real Interest Rate Policy Rule
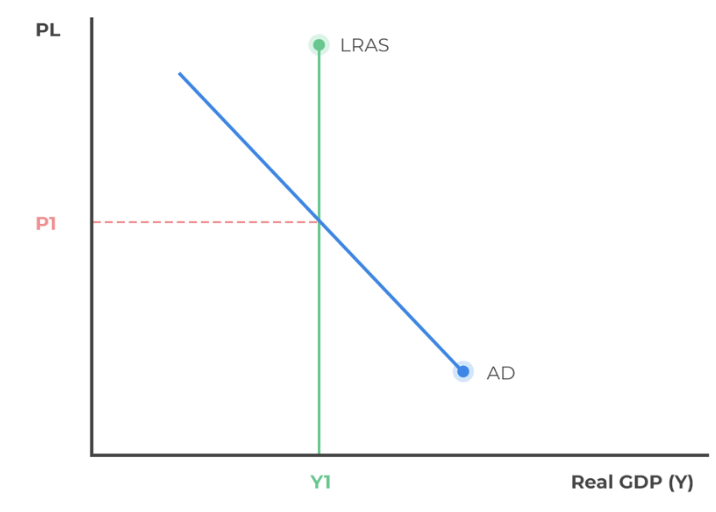
Chap 16: Long Run Aggregate Supply Curve
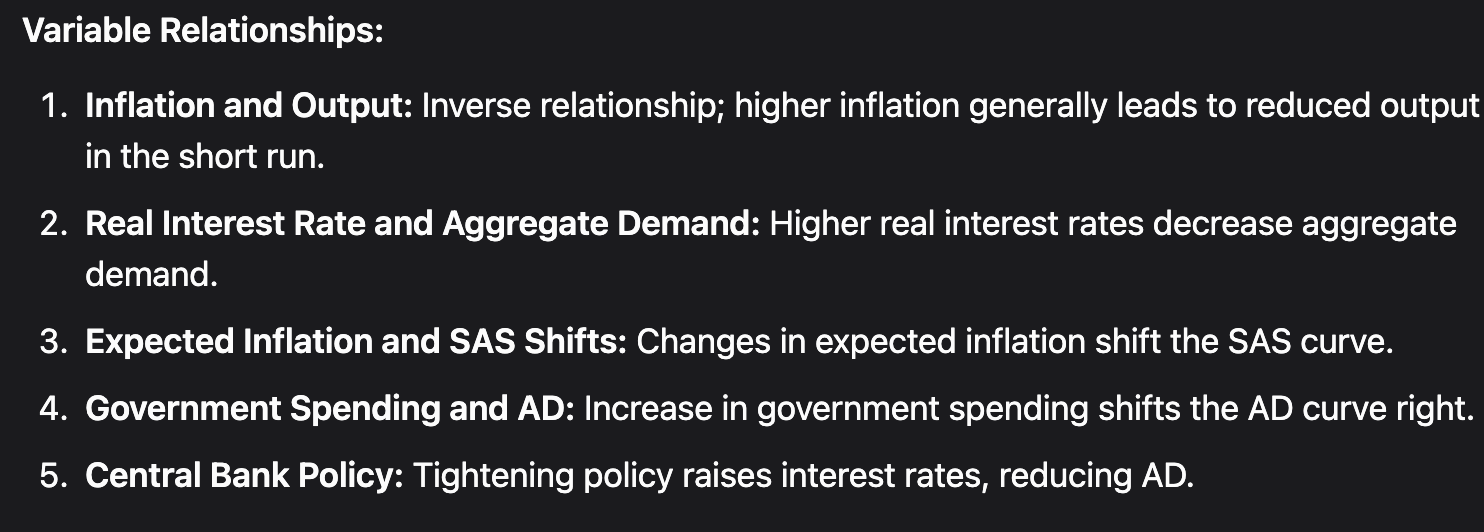
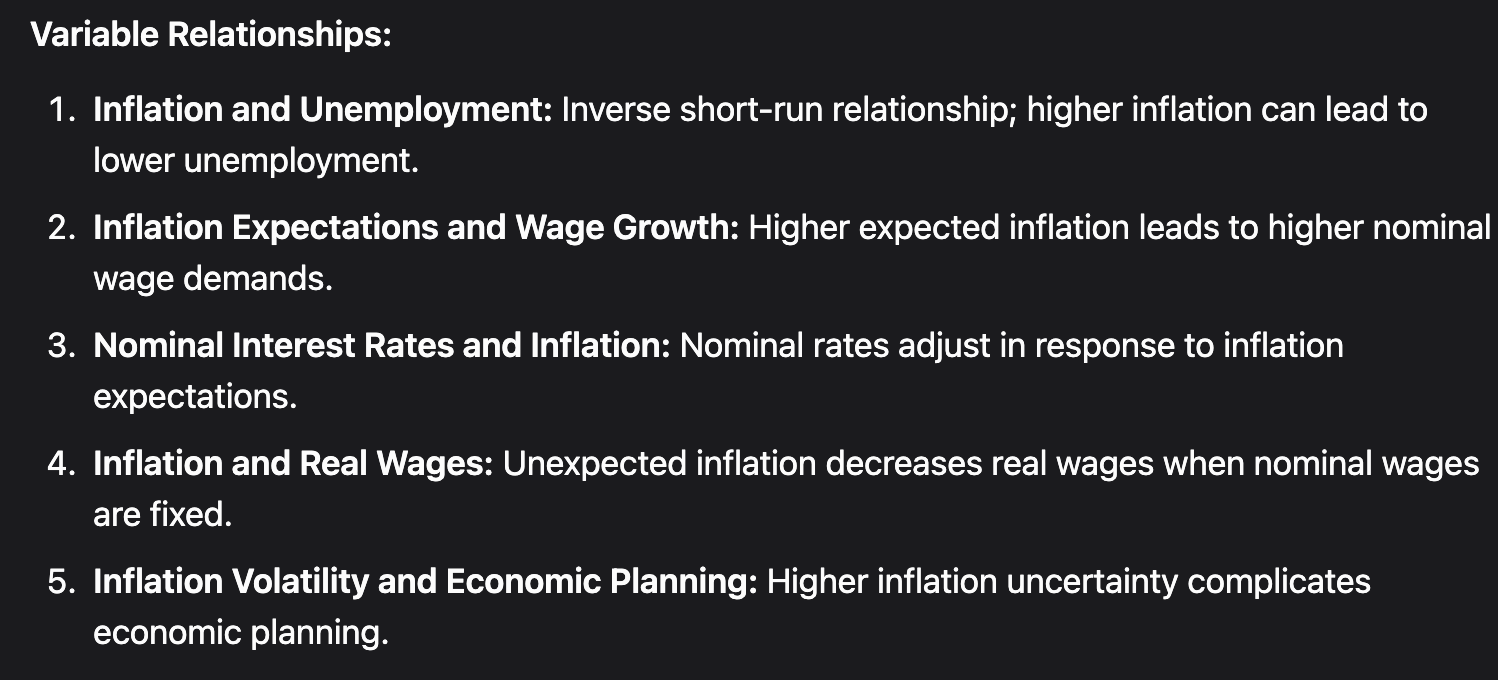
Chap 16: Variable Relationships
as well as demand and supply shocks impacting the AS and SAS
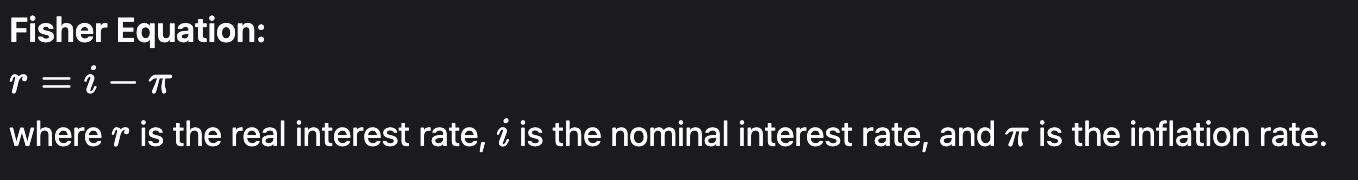
Chap 17: Fisher equation
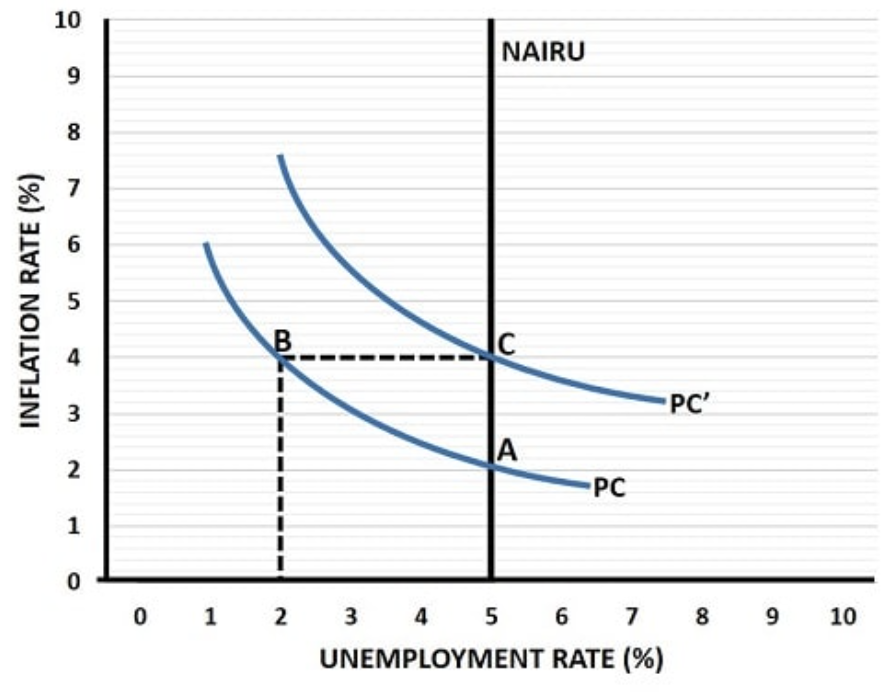
Chap 17: Phillips Curve (Short run)

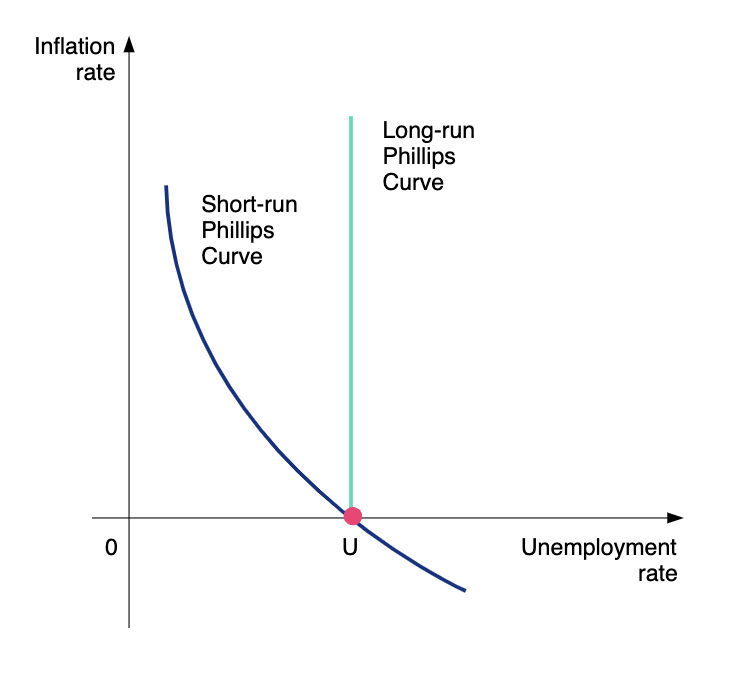
Chap 17: Phillips Curve Graph
Shows trade-off between inflation and unemployment
Chap 17: Variable Relationships
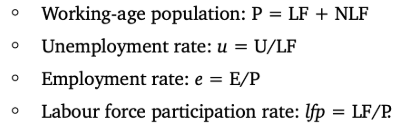
Chap 18: The 4 Employment Formulas
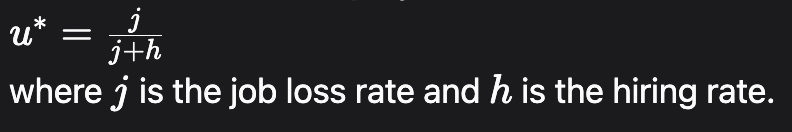
Chap 18: Natural Rate Of Unemployment
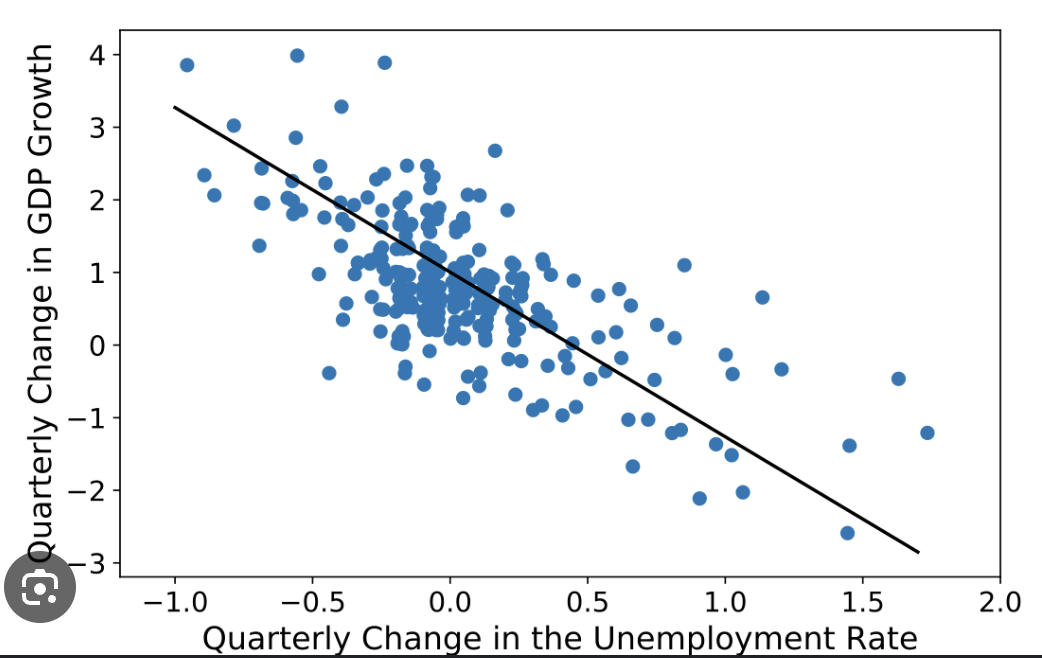
Chap 18: Okun’s Law
Relates changes in unemployment to changes in output
Chap 18: NAIRU Graph
Chap 19: Balance of Payments Identity

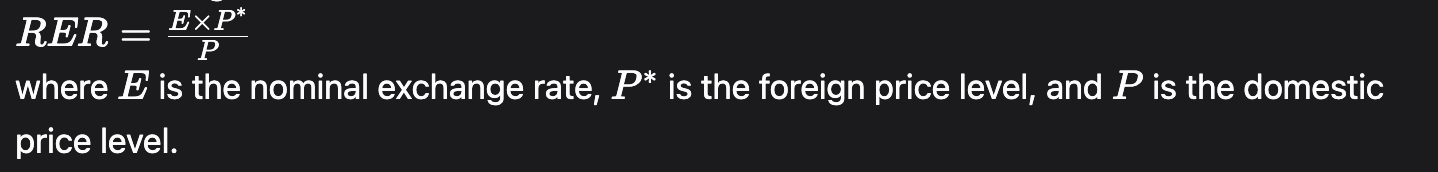
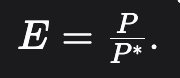
Chap 19: Real Exchange Rate
Chap 19: Purchasing Power Parity (PPP)
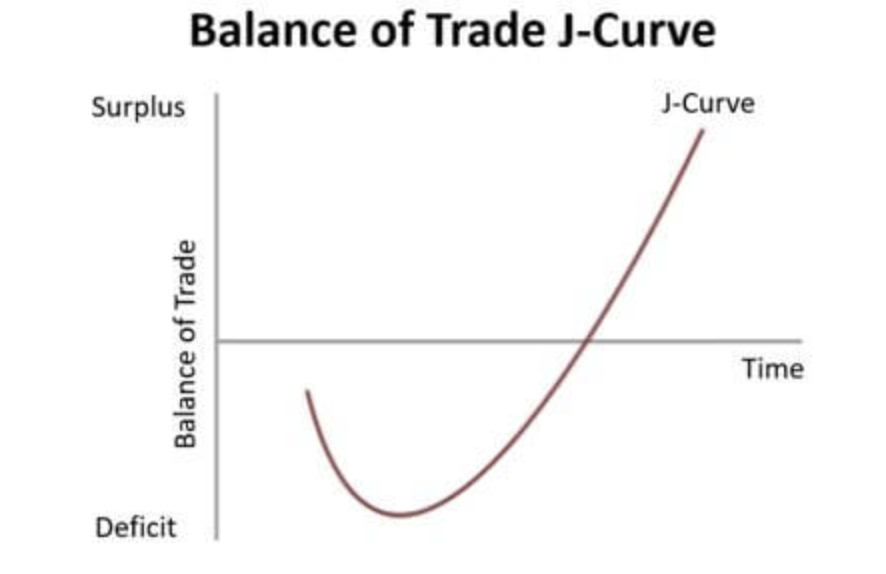
Chap 19: J curve
explains the effect devaluation has on a country's current account
Chap 20: Current Account Balance

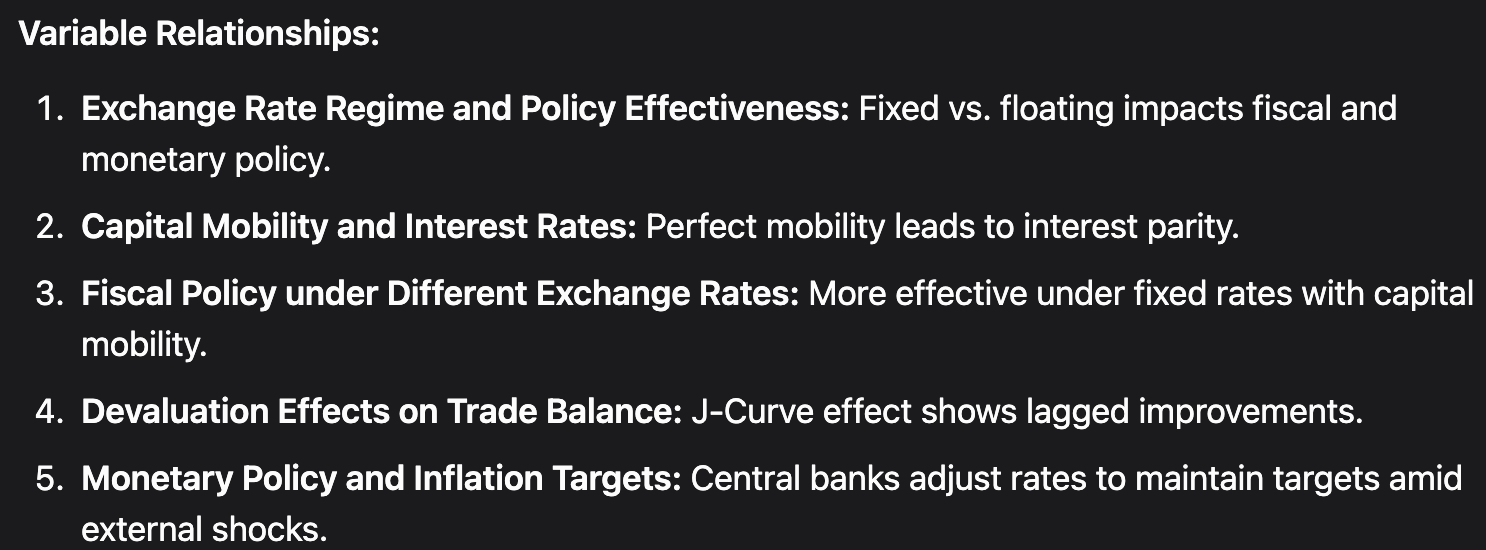
Chap 20: Variable Relationships