Biostats Test 2
1/32
There's no tags or description
Looks like no tags are added yet.
Name | Mastery | Learn | Test | Matching | Spaced | Call with Kai |
|---|
No analytics yet
Send a link to your students to track their progress
33 Terms
Useful for comparing means among categories if the data is normally distributed
Bar plot
Useful for comparing medians among categories if the data is skewed or has outliers
Box plot
Useful for comparing means among treatments that have a ranked or quantitative relationship or to display trends across time
Means plot
Useful for visualizing the relationship between two quantitative variables and checking assumptions for linear models.
Scatter plot
A list of values in a dataset and how often they occur.
frequency distribution
Describe a density curve and its relationship to a histogram
grouping the data into discrete bins and creating a histogram. Histogram—visualizes the distribution of quantitative data by dividing it into equal ranges (called bins) and plotting the frequency of values that fall within each bin
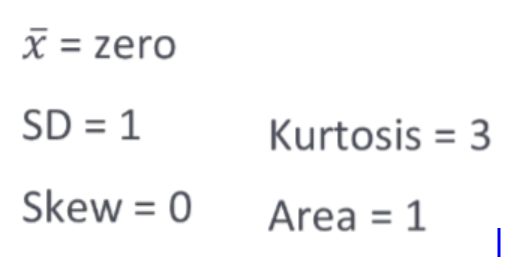
• What is needed to fully describe a normal distribution?
If you take enough samples, the average of those samples will always look like a bell curve, even if the original data looks like a mess
central limit theorem
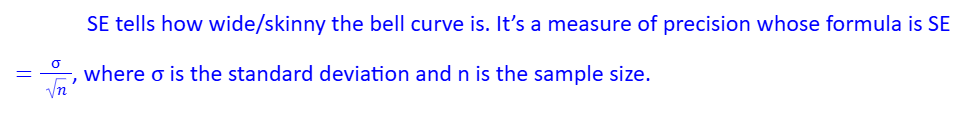
standard measure of error
the tendency to obtain value in the tails of the distribution
kurtosis
the horizontal symmetry of a probability distribution
skew
What is the standard normal distribution? What is the advantage of using the standard normal distribution?
a specific version of the normal distribution created by transforming data into z-scores. The advantages is that it is easier to calculate probabilities and can directly compare different distributions
For a normal distribution, approximately what percentage of the area under a curve is within 1, 2, and 3 standard deviations
w/in 1: 68%
w/in 2: 95%
w/in 3: 99.7%
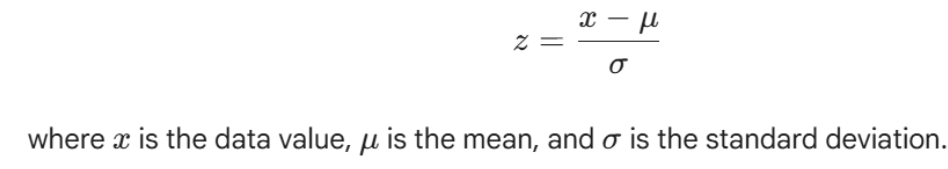
a value used to transform a normal distribution into a standard scale to make calculating probabilities easier
z score
Calculating the margin of error around a statistic
confidence interval
the range of values above and below a sample statistic (like a mean) that likely contains the true population parameter. It represents the maximum expected difference between the sample result and the actual population value
margin of error
describe dispersion around the sample mean
standard deviation
This represents the standard deviation of the sampling
Standard error
A range of values, derived from sample statistics, that is likely to contain the true population parameter. It is expressed as the sample mean plus or minus a Margin of Error
confidence interval
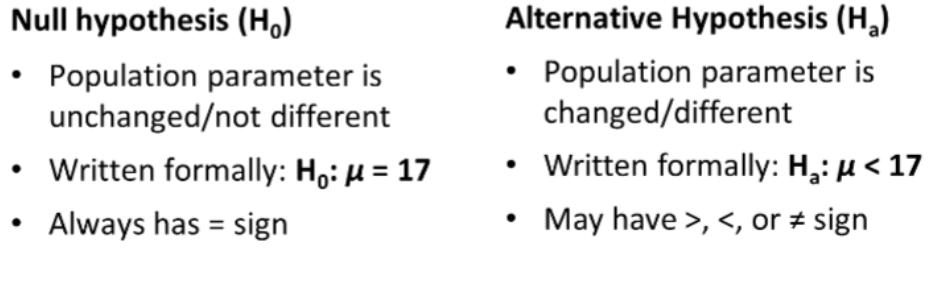
Define/describe a null and alternative hypothesis and describe how they are used during hypothesis testing
• What are the requirements (assumptions) of a z-test?
Data are independent
Data are normally distributed
We know the true value of the population standard deviation, σ. Often we do not know σ
We are comparing a sample mean (x̅) to an expected mean (the null hypothesis)
• Define alpha (α) and why it is important in statistical tests.
set a threshold value of p
A clearly stated proposed description of how a system works including the biological mechanism and a testable statement
Biological hypothesis
Follows logically from the hypothesis; explains what will happen in the system under anticipated conditions; utilizes measurable dependent variables
Biological predictions
Formal, testable claims about a population parameter that are evaluated using
sample data involving both the null hypothesis and alternative hypothesis
statistical hypothesis
rejecting a null hyp that is true
type 1 error
failing to reject null hyp that is false
type 2 error
Discuss why statistical analyses do not provide absolute truth, but also why they are
important to science.
Our default assumption is that there is no difference, change, or relationship. Thus, science advances by proving things false, not by proving absolute truths. Additionally, they quantify probabilities rather than certainties. There is also always risk of statistical error.
comparing a sample mean (x̅) to an expected mean (the null hypothesis), and know the true value of the population standard deviation
z test
• Describe and identify when it is appropriate to use a one-sample t-test.
population sd is unknown
• Describe/explain the equation for calculating t and how a one-sample t-test works.
Gather info, plug into formula, and express margin of error
• List the assumption that must be met when performing a one-sample t-test.
Data are independent: Built into the sampling method and/or experimental design
Data are random: Built into the sampling method and/or experimental design
Data are normally distributed
• Describe normality and discuss how the normality of a data set can be checked.
Shapiro–Wilks test