AP Macroeconomics Unit 1
1/44
Earn XP
Description and Tags
Name | Mastery | Learn | Test | Matching | Spaced | Call with Kai |
|---|
No analytics yet
Send a link to your students to track their progress
45 Terms
Scarcity
when society has unlimited wants, but limited resources, so choices must be made
Macroeconomics
Study of large economy as a whole/economic aggregates
5 Key Economic Assumptions
1) Scarcity exists
2) Trade-offs must be made b/c of scarcity
3) Everyone acts in their self-interest
4) People make decisions by comparing marginal cost
5) Real-life situations can be explained with graphs and charts
Marginal Analysis
making decisions based on increments: when marginal benefit > marginal cost, you should take the opportunity
Trade-offs
alternatives that are given up to make a choice
Opportunity Costs
Most desirable alternative given up when a choice is made
Utility =
satisfaction
Marginal =
additional
Consumer vs Capital Goods
Consumer = created for direct consumption
Capital = created for indirect consumption, to make more consumer goods
4 Factors of Production
1) Land
2) Labor
3) Capital (Physical & Human)
4) Entrepreneurship
Land (as factor of production)
all natural resources that are used to produce goods & services (ex: water, sun, plants)
Labor (as factor of production)
any paid-for effort towards a task by a person
Physical Capital
any human-made resources used to create other goods/services
Human Capital
any skills or knowledge gained by a worker through education & experience
Entrepreneurship (as factor of production)
lenders that combine the other factors of production to create goods & services
Requirements for an Entrepreneur
1) take initiative
2) innovate
3) act as risk bearers
Goal of an Entrepreneur
to earn profits
Profit =
Revenue - Cost
Productivity
a measure of efficiency that shows the number of outputs per unit per hour (# output/unit/hour)
better productivity = more stuff w/ fewer resources
Production Possibilities Curve
a model that shows the alternate ways an economy can use its scarce resources—demonstrates scarcity, trade-offs, opportunity cost & efficiency
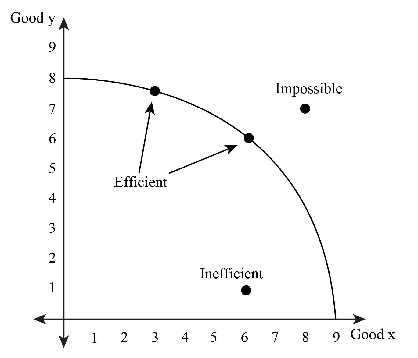
Four Key Assumptions for PPC
1) only 2 goods can be produced
2) all resources can be utilized
3) fixed resources (ceteris paribus)
4) fixed technology
Constant Opportunty Costs
when the resources needed for 2 goods are relatively similar so the loss of one is equal to the gain of the other
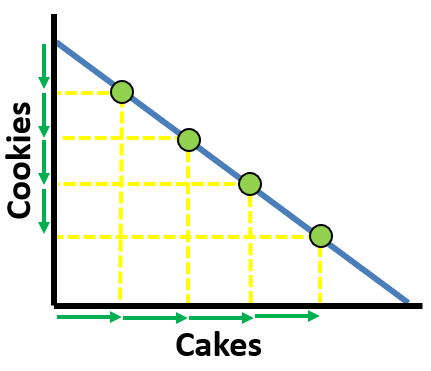
Straight PPC =
constant opportunity cost
Increasing Opportunity Cost
when the resources needed for 2 goods are very different, so as you produce more of one, the opportunity cost of the other keeps increasing
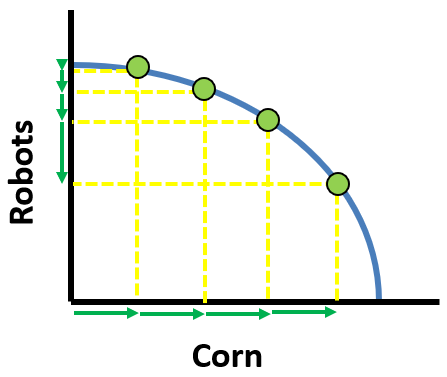
Bowed Out/Curved PPC =
increasing opportunity costs
3 Shifters of PPC
1) change in resource quantity/quality
2) change in technology
3) change in trade (allows for greater consumption)
Relationship between capital goods and future growth
Countries that produce more capital goods will have more future growth
Per Unit Opportunity Cost =
(opportunity cost)/units gained
Absolute Advantage
the benefit of one option over the other w/o comparing opportunity cost (producer that makes the most output/needs the least input)
Comparative Advantage
the benefit of one option over the other when comparing opportunity cost (producer w/ lowest OC)
Demand (consumer perspective)
the different quantities of goods that consumers are willing & able to buy @ different prices
Law of Demand
there is an inverse relation between price & quantity demanded by nature
Law of Diminishing Marginal Utility
as you consumer something, the additional satisfaction that you received will eventually start to decrease
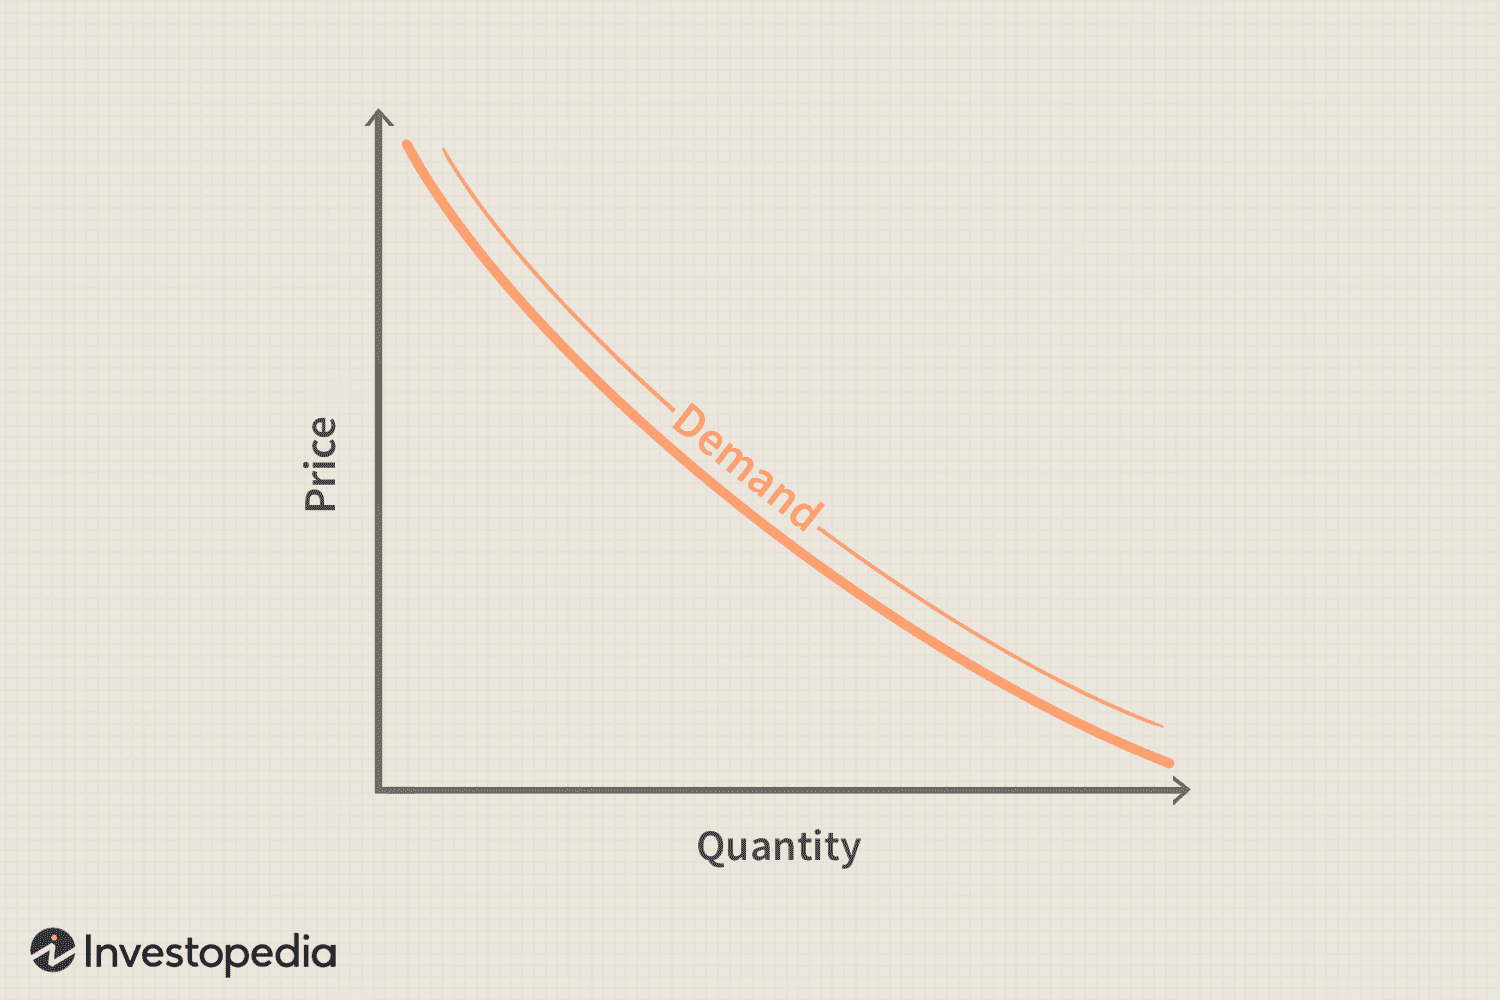
Demand Curve
a graphical representation of demand schedule, slopes downward to show inverse relation between price & quantity demanded
Change in Price for Demand & Supply Curves
results in a change in QUANTITY demanded/supplied (it’s a movement along the curve and doesn’t move the curve itself)
5 Determinants of Demand (RIPEN)
1) related goods (prices of substitutes/complements)
2) income
2) # of consumers
4) income
5) future expectations
Substitutes
if price of one increases and demand of other increases /vice-versa (P1 decrease = D2 decrease)
Complements
if price of one falls and demand for other increase /vice-versa (P1 decrease = D2 increase)
Normal Goods
when, as income increases, demand increases and vice-versa
Inferior Goods
when, as income increases, demand decreases and vice-versa
Examples of Normal Goods
seafood, jewelry, homes
Examples of Inferior Goods
fast food, cup noodles, used clothes
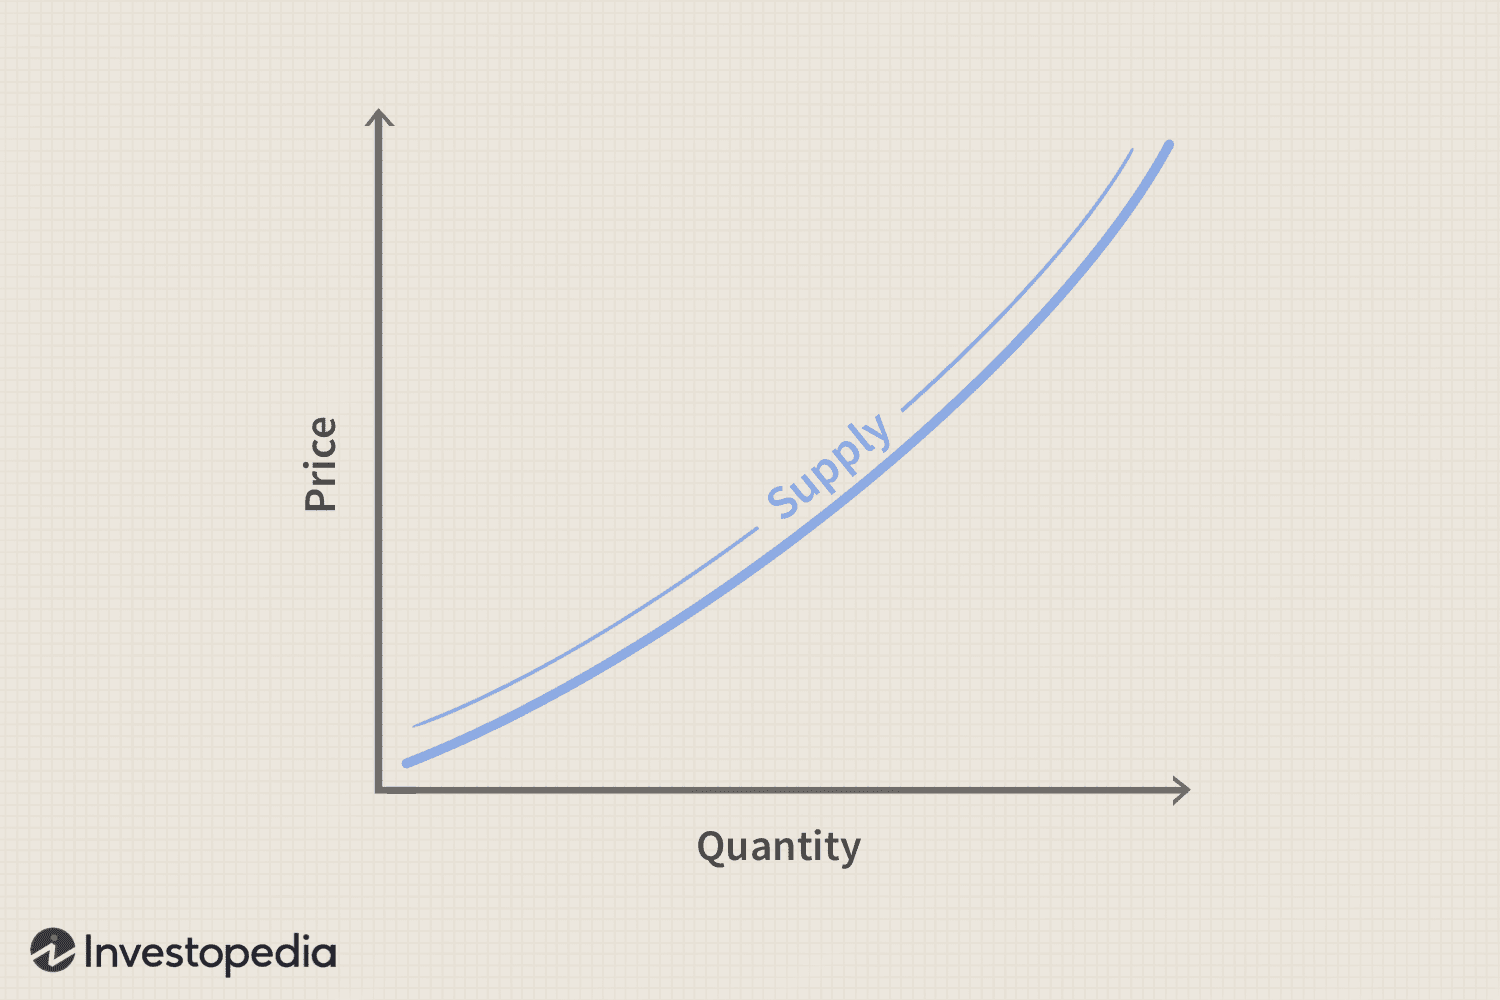
Supply (consumer perspective)
different quantities of a good that sellers are willing & able to sell
Law of Supply
there’s a direct relationship between price and quantity supplied
Six Determinants of Supply (ROTTEN)
1) resource cost/availability
2) other products (price of related goods)
3) technology
4) taxes & subsidies (govt. action)
5) expectation of future profits
6) number of sellers