1 Linear Regression
1/20
Earn XP
Description and Tags
This is linear regression model
Name | Mastery | Learn | Test | Matching | Spaced |
|---|
No study sessions yet.
21 Terms
Linear regression
This is used to predict the continous value.This is also called as ordinal least square.
Assumption of linear Regression
Linearity: The relationship between the independent variables (predictors) and the dependent variable (target) is linear.
Independence: The residuals (errors) are independent of each other, meaning there is no correlation between them.
Homoscedasticity: The variance of the residuals is constant across all levels of the independent variables (no heteroscedasticity).
Normality of Errors: The residuals of the model are normally distributed, which is important for hypothesis testing and confidence intervals.
No Multicollinearity: The independent variables are not highly correlated with each other
regression metrics (MAPE, MAE, MSE, RMSE, SMAPE)
📏 1. MAE (Mean Absolute Error)
What it is: The average of how much your predictions are off, ignoring whether they’re too high or too low.
Simple idea: “On average, how wrong were we?”
Example: If your model predicts house prices and is off by ₹50,000, ₹30,000, and ₹20,000, the MAE is ₹33,333.
🔢 2. MSE (Mean Squared Error)
What it is: Like MAE, but it squares the errors before averaging.
Why square? Bigger mistakes hurt more. Squaring makes large errors count more.
Example: If errors are ₹10 and ₹100, MSE gives more weight to ₹100.
📉 3. RMSE (Root Mean Squared Error)
What it is: Just the square root of MSE.
Why use it? It brings the error back to the original units (like ₹ or °C), making it easier to understand.
Example: If MSE is 100, RMSE is 10.
📊 4. MAPE (Mean Absolute Percentage Error)
What it is: Like MAE, but shows the error as a percentage of the actual value.
Simple idea: “On average, how far off were we, percentage-wise?”
Example: If you predict ₹100 and the real value is ₹80, the error is 25%.
🔄 5. SMAPE (Symmetric Mean Absolute Percentage Error)
What it is: A more balanced version of MAPE that avoids problems when actual values are very small.
Why use it? It’s more stable when values are close to zero.
Formula tweak: It divides by the average of actual and predicted values instead of just actual.
Gradient descent
This is used for optimization.
This is used in many algorithms like
- Linear regression - Logistic regression - Neural Network - Deep neural networks
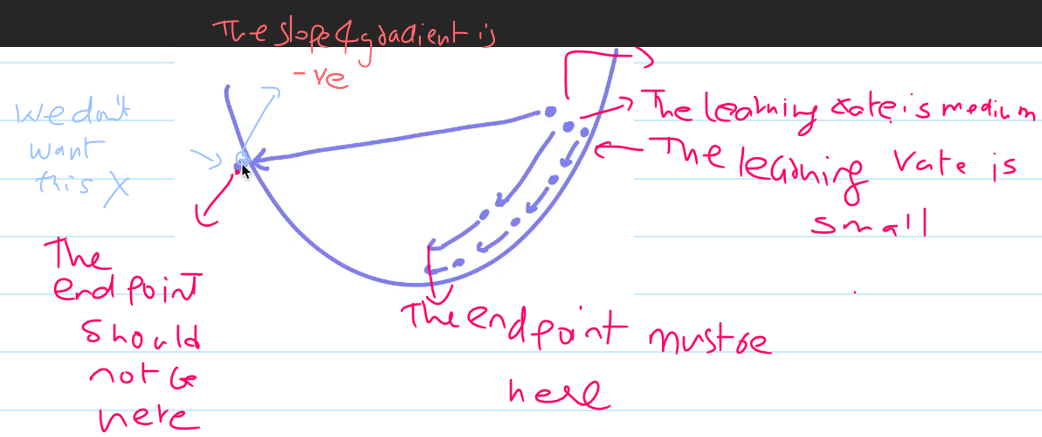
using the gradient decent we must make sure the slope is
Zero
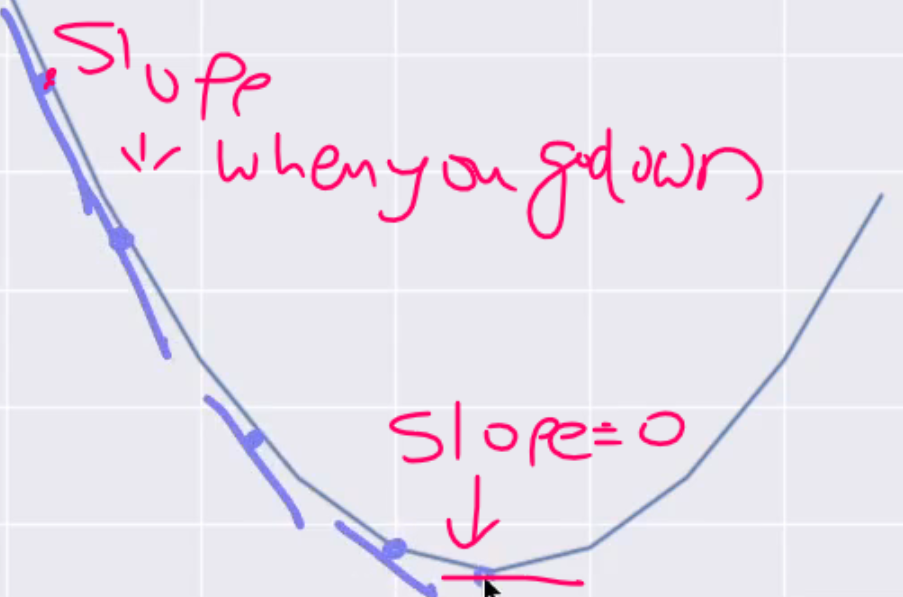
The movement of slope is due
Convergance algorithm.
if learning rate is low then movement will be low
If learning rate is hight then slope will never be zero
Its better to take less lerning rate.
what is best fitted line
This will help us in doing the prediction. If the model is correclty predicted then the point will be near the best fitted line.
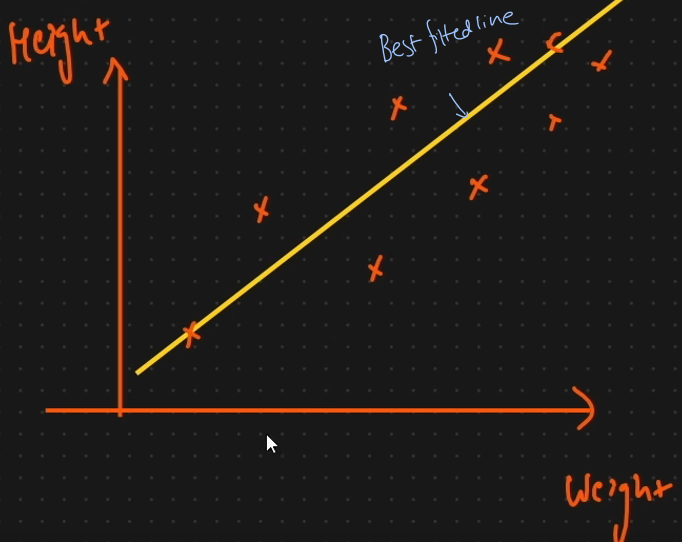
Equation of straight line
y = mx+c

Perfomane of linear regression
R square
if r square increases then accuracy increases. It measures how well the model explains the variance in the
dependent variable, with a higher value indicating a better fit.
The range is between 0 to 1.
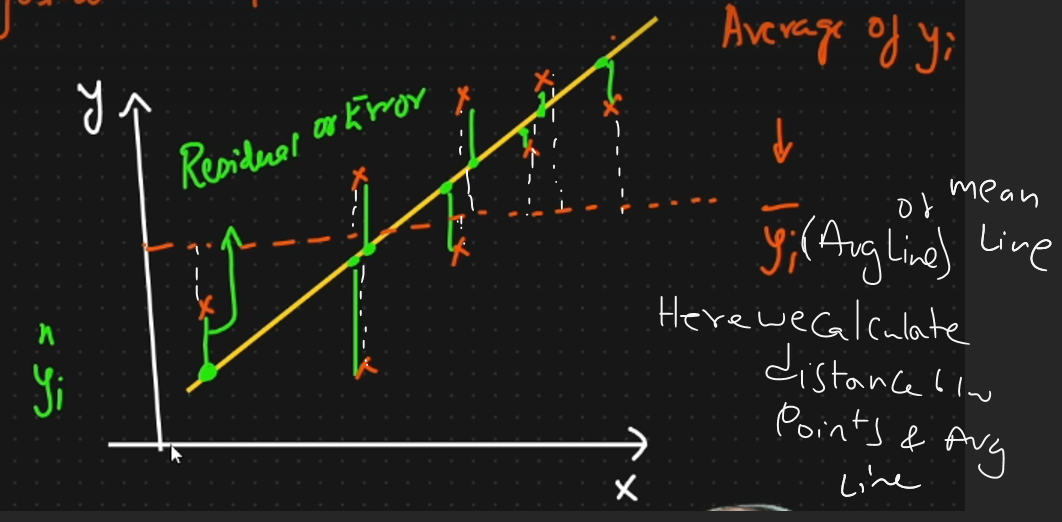
adjusted r square
Adjusted measure accounting for number of predictors.
The range is less than R square
mean square error
Not roboust to outlier. Not used much.
Mean absolute error
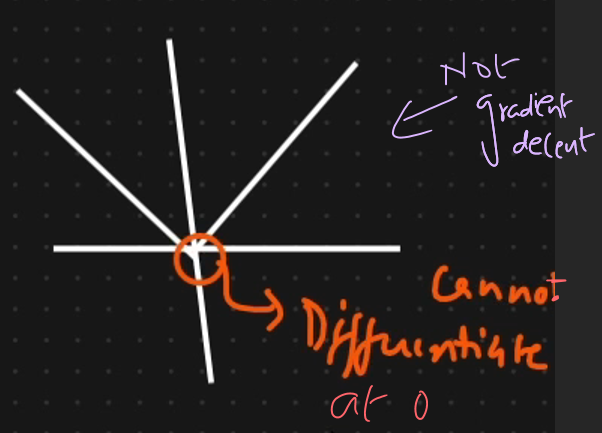
This is roboust to outliers. This Cannot have graadient decent.
RMSE
This is not roboust to outlier. square root of mean square error.
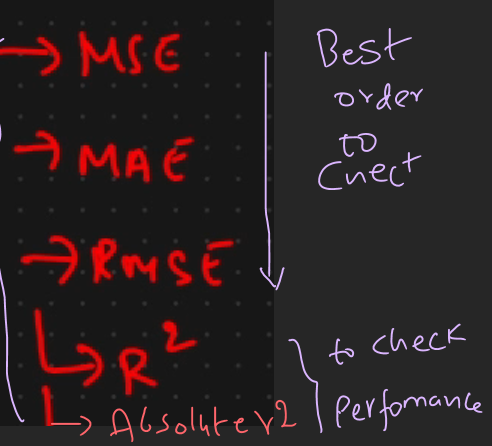
Best order for checking perfomance
Z score rule
Mean = 0 & standard devation = 1
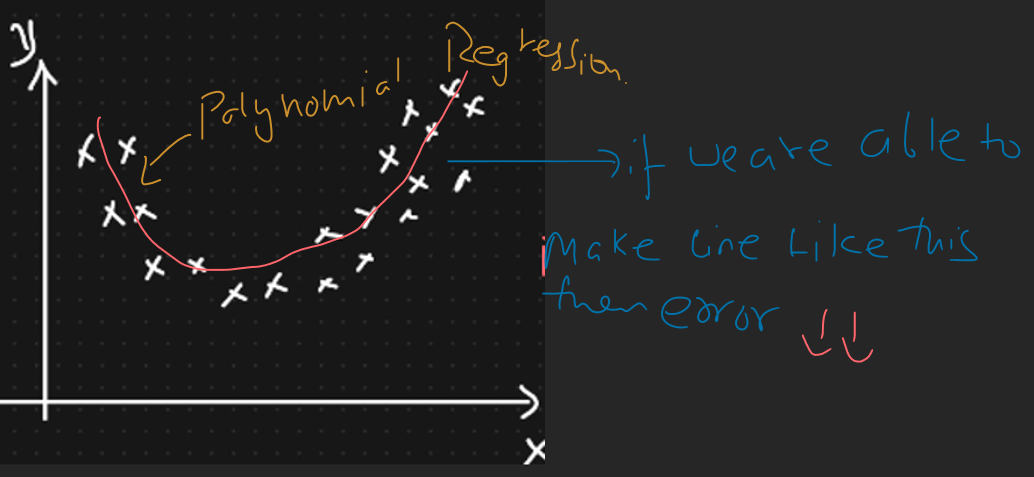
Polynominal Regression
How Do You Interpret the Coefficients of a Linear Regression Model?
In linear regression, each coefficient represents the expected change in the dependent variable for a one-unit change in the corresponding independent variable, holding all other variables constant.
Intercept: The intercept (constant term) represents the predicted value of the dependent variable when all independent variables are zero.
Slope (Coefficient): Each slope represents how much the dependent variable changes with a one-unit increase in the corresponding independent variable. For example, if the coefficient of a variable is 3, it means that for each unit increase in the predictor, the dependent variable increases by 3 units, assuming other predictors remain constant.
Regularization techniques
L1 (Lasso): Adds the absolute value of coefficients. This adds a penalty equal to the absolute value of the magnitude of coefficients. This can lead to some coefficients being zero, which means the model ignores the corresponding features. It is useful for feature selection.
○ L2 (Ridge): Adds the squared value of coefficients.Adds a penalty equal to the square of the magnitude of coefficients. All coefficients are shrunk by the same factor, and none are eliminated, as in L1.
○ ElasticNet: A combination of L1 and L2 regularization.This combination of L1 and L2 regularization controls the model by adding penalties from both L1 and L2, which can be a useful middle ground.
What are the variants of Gradient descent?
Stochastic Gradient Descent: We use only a single training example for calculation of gradient and update parameters.
Batch Gradient Descent: We calculate the gradient for the whole dataset and perform the update at each iteration.
Mini-batch Gradient Descent: It’s one of the most popular optimization algorithms. It’s a variant of Stochastic Gradient Descent and here instead of single training example, mini-batch of samples is used.
In linear regression, why is it important to check for multicollinearity?
Checking for multicollinearity in linear regression is crucial because it can cause unstable coefficients, inflated standard errors, and reduce the model's reliability.
When predictor variables are highly correlated, it becomes difficult to interpret the effect of each predictor accurately, leading to less reliable and interpretable results.
Do we require Scaling?
Linear Regression might not need scaling, but it can still help with stability and understanding the results.