GEO 150 - SFU
1/121
There's no tags or description
Looks like no tags are added yet.
Name | Mastery | Learn | Test | Matching | Spaced |
|---|
No study sessions yet.
122 Terms
Geography
The art and science that attempts to study, explain and predict spatial distributions and variations of human activity and physical events on or near the Earth's surface
GIS (geographic information system)
- organized collection of computer hardware, software, geographic data, trained personnel and procedures for capturing, managing, analyzing and displaying, spatially referenced data to aid problem-solving
- Simple words - a visual representation of the real world
The goal of GIS
- Transform data into info and evidence
- solve problems using mapping
- extract quantitative info from maps
- enhance geo data to make meaningful to users
2 ways to organize spatial data
- Thematic - network of streets in a city (real world)
- Temporal - tree cutting at a certain time (by time)
How is GIS data arranged
- Layer based approach
- one layer contains the same type of features
- there is a geographical extent or boundary
Why is spatial location important ?
- any data that has anything to do with location information
- delivery of services - postal
- delivery of abstract - credit cards
- delivery of management - land taxes
- with an address you become a part of modern society
Geospatial reference system
identifies locations on the earth's surface
3 main categories of Geospatial reference systems
- census geography
- geocoding
- Latitude, Longitude
Census geography
- Location specified by a label or code
- geographic identifier reference system
- ex. - postal codes
Geocoding
- location specified by reference to a segment and distance from that segment to a point
- linear reference system
- ex - postal address
Longitude, Latitude
- Location specified with respect to a datum
- coordinate reference system
- ex - degrees
Perspectives of GIS
- Database
- map view
- model view
The Database view
A GIS is a unique kind of database of the world - a geographic database (geodatabase). It is an "information system for geography". Fundamentally a GIS is based on a structures database that describes the world in geographic terms.
The Map View
A GIS is a set of intelligent maps and other views that show features on the earth's surface. Maps of the underlying geographic information can be constructed and used as "windows into the database" to support queries, analysis and editing of the information- this is called geovisualization
The Model view
A GIS is a set of information transformation tools that derive new geographic datasets from existing datasets. These geoprocessing functions take info from existing datasets, apply analytic functions and write results into newly derived datasets.
Critiques of GIS
- expensive
- time consuming
- time flows and changes
- privacy
- a tool that controls the masses ( changing )
- not all perspectives
Spatial thinking
- Finding meaning in shape, size, orientation, location, direction or trajectory of objects, processes or phenoma
- Spatial data and questions fuel spatial thinking which results in spatial solutions
Spatial concepts a GIS can answer
- Location
- Condition
- Trends
- Routing
- Patterns
- Modeling
Maps
- Primary output of GIS analysis
- scaled representation or model of geographic reality portrayed using a selected set of features on a flat medium
2 most common types of Maps
- Topographic - natural features on surface of the earth
- Thematic - one specific theme
Map Creation process
Real world - map maker interpretation of world - map - map reader interpretation of the world
Map Scale
- Map scale becomes important when info about Earth has to be represented on a flat map
- in defining an appropriate scale, we are also determining the map info that can be included on the map
- a scale defines the map info that can be included on the map
- a scale defines the ratio between distance of a map and corresponding distance on ground
3 types of Scales
- Functional scale - numerical expression
- verbal scale - written description
- graphic scale - calibrated bar on line
Generalization (scale of relevance)
- Process of choosing which features to represent on map and how they will be represented
- 5 types
- classification
- simplification
- exaggeration
- symbolization
- Induction
Classification
- Expressing key characteristics of distributions
- grouping similar points together
Simplification
Determining important characteristics of features attributes
Exaggeration
enlarging or altering the features in order to capture the real world importance
symbolization
assigning graphic marks on the maps to features from the real world
induction
making influence on relationships among features on the map
3 hierachies in Map Design
- Target Audience - what we want to portray
- map components - scale bar, legend , etc
- arranging features - position, layout, visuals
Lettering
Process of selecting a type face design, preparing names, placing it at the right position (top right preferred)
Graphic Variables
shape, colour, size, texture
visual variables
priority, distance, order, quality
Symbology
- The process of rendering the graphic variables.
- in the vector data model the colour, and width are changed
Classifying Qualitative Spatial data
- the purpose of classification is to break down the data into categories to improve our understanding of the underlying patterns that may exist
- ex - natural breaks, equal interval, quantile
Georeferencing
Georeferencing is the principles and process of transforming spatial data from an arbitary system into a geographic or projected system
Process of Georeferencing
1. Define the correct shape of the earth
2. Project the spherical earth to a flat plane
3. Transform between coordinate system and datums

Globes
-Highly accurate
- difficult to move
- time consuming to make
- new map projections move the 3D globe to a 2D place and overcome the problems above
Mathematical shapes as models
- The shape of the earth is key in determining the relationship between digital maps and what they represent
Ellipsoid
- Ellipsoid shape and bulge account for the earth's rotation - more accurate
- Many ellipsoids existed before satellite technology
- After satellite tech, earth-centered ellipsoids became common
- ex - WGS 84, GRS 80
Geoid
- Accurately represents the earth's shape and size
- based on equipotential gravity surfaces at mean sea level
- Rock density causes the geoid to deviate from ellipsoid
- Extremely accurate representation of the earth
Datum (or control network)
- Highly accurate and well-designed arrangement of ground points
- Horizontal Datum - frame/reference for measuring locations on the surface of the earth
- Vertical Datum - provides frame/ reference for measuring elevations with respect to the mean sea level
- removing a datum is a crime and you could get 7 years in prison
Geographic Coordinate System
- Longitude, Latitude graph
- The key lines are the prime median and the equator
- related to the 3D earth shape
Projected Coordinate System
- Mapping includes determining the geographic locations of features on the earth's covered surface and the transforming these geographic locations into positions on a flat map
- makes 3D earth into flat map
How the projection distort Earth ?
- These important distortions result from sphere transformation to a place
- distortions can be in shape, size, direction, distance
What properties is it possible to retain the fidelity of
- Accurate transformation of Areas
- Accurate transformation of Angles
- Accurate transformation of Distances
- Accurate transformation of Directions
How to Project Earth ? - you need a light source
1. Gnomonic - light source is at the center of the earth
2. Stereographic - light source is at point opposite
3. Orthographic - at a considerable distance
UTM (Universal Transverse Mercator) - after we made earth into a flat plane
- UTM is a worldwide system defined in meters
- The world is divided into 60 zones, 6 degrees of longitude each from 84 N to 80 S latitude
- Zone 1 is the international dateline
- each zone divided by a central; median and the equator (N/S)
Spatial Data representation process
Representation of the real world - we decompose into information model (objects, fields) -- representation or data model ( vector, raster ) - databases ( physical model) - file structures
Objects
- collection of well defined discrete and spatially referenced objected
- well defined boundaries
- each object, identified through attribute table
- roads, streets
Field
- Events that vary continously across geographic space
- boundaries fuzzy
- space mutally exclusive and collectively exhaustive
- represented by category or value
- beach, lake, natural places
Vector Model
- Human world
- lines, point, polygon
- there is one geometry per layer in the GIS database
- If the beginning and end points of vector are the same then the vector polygon feature is created
Geometery
Branch of mathematics describing the shape, size and relative configuration of objects
Topology
- Science and mathematics studying
- properties of objects that do not change as the object is distorted ( train route map )
- it expresses the spatial relationships between connected or adjacent vector features in a GIS database
- deals with linkages between the computer entities used to represent them
Raster Model
- Natural world
- images, photos or scanned maps
- cell, pixel is basic unit
- coloums , rows
- pixels are equal size
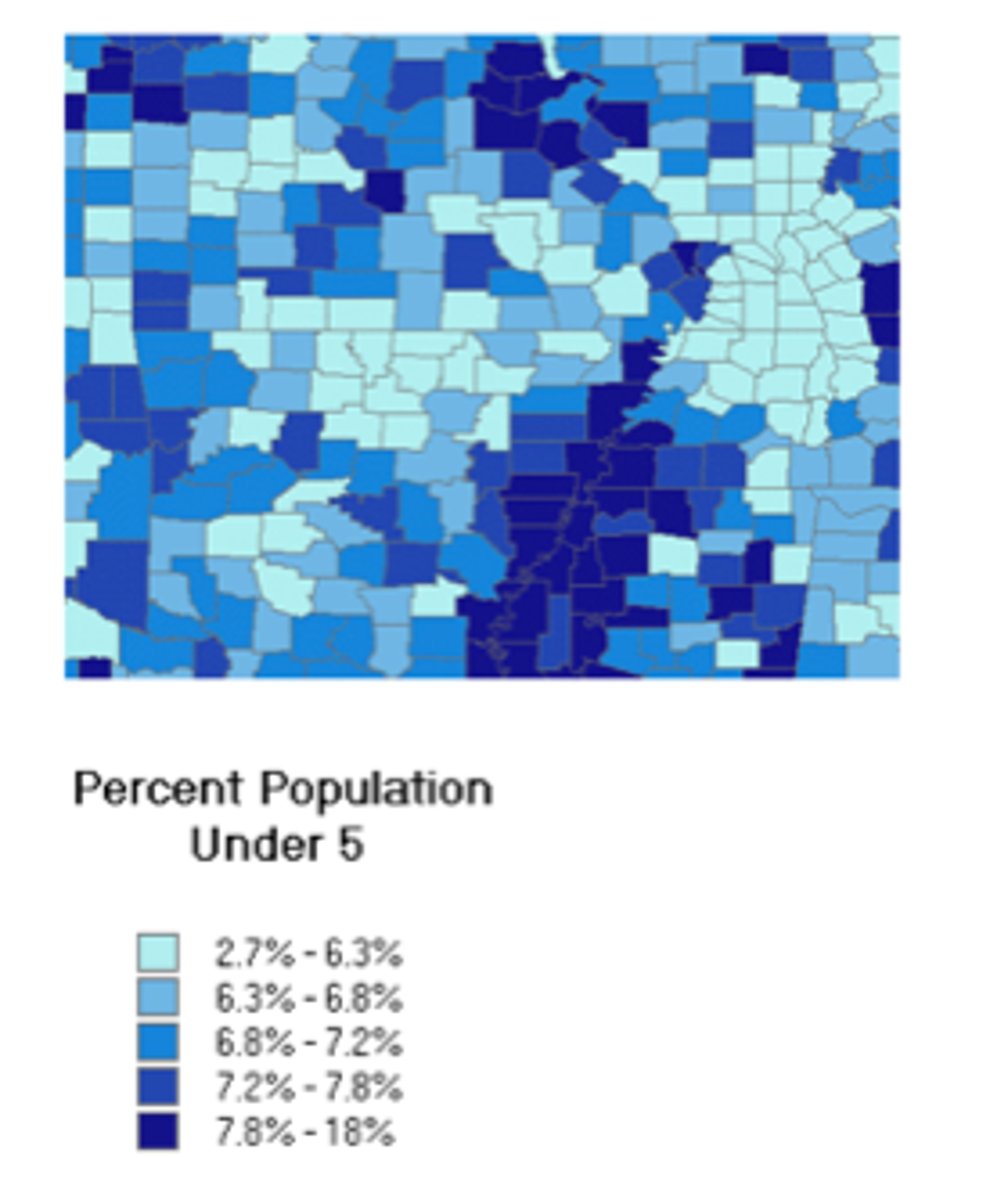
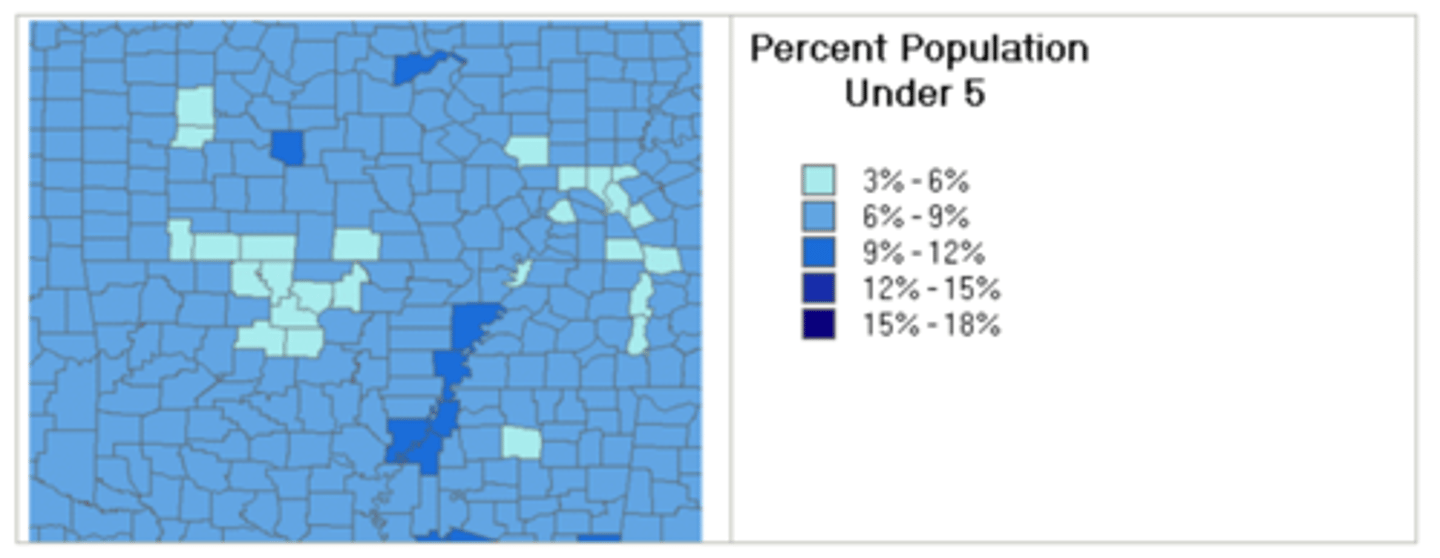
Choropleth Map
Shows relative quantity by symbolizing area units such as countries, and municipalities, using colour
GIS Data Sources
- Can link and store data from multiple sources
- maps, tables, images, user input, digital products, reports
What is Data Quality based off ?
- Overall suitability of dataset for a specific purpose
- error and uncertainty
- accuracy
- precision
- resolution
- generalization
Completeness ( Data Quality )
data must be spatially and temporally complete
Compatible
mutitple dataset used in the same project must be of the same format, scale and extent
Consistent ( Data Quality )
multiple data sets should undergo consistent methods of data capture, storage, manipulation and editing
Applicable ( Data Quality )
data must be suitable for the anaylsis or project
Meta Data
- Information about data
- identify geospatial resources
- exchange geospatial resources
- manipulate geospatial resources
- catalogue geospatial resources
- Stylesheets are used to format the metadata.
- useful when data is being exchanged and benefit decisions about quality, storage, etc
Errors
- tells us about "our confidence in what is known about the data"
- deal with the difference of the measurement from a true value
Discretization
- representing spatially continous features using point, lines, polygons
- hows is the real world mis - represented
Accuracy
Measures how close our data is compared to reality
Precision
measures the level of detail in which we record the data
Uncertainty
- "confidence about what is not known"
GIS data input sources
- Keyboard entry - entering value into tables/ templates
- manual digitizing - digitizing tablet, point mode, stream mode
- Automatic Digitizing - using a large format scanner
- Data Transfer - data from a GPS, importing existing data
- Scanning - digitizing
GPS (global positioning system)
- Constellation of earth-orbiting satellites maintained by USA for the purpose of defining geographic positions on and above the surface of the earth
- not accurate, they contain errors especially when the instrument is not a dedicated one
GNSS
Global Navigation Satellite System
- Space segments - satellites
- control segment - base stations
- user segment - gps receivers
Multipath Errors
- Signalling coming directly from the satellite and reflected off other objects interfere and create location errors
- how to fix - receivers filter the signals and determine the strongest one
Dilution of Precision
- Geometery of satellites are not equally spread out
- no solution
How to reduce location errors
To reduce location errors is to take simple averages, over time the average of a series of location values will give the best estimate of the real location value
GIS
Visual represenation of the real world
Selective ability
the way signals from the gps satellites in orbit around the earth are masked
Cartography
science or art of making maps
GPS can support ...
- digital compass
- store landmarks
- dynamic routing
- mapping applications
T/F - Spatial data can only come from physical data
False, It can be from many sources such as population census, social media data, cell phone data, etc.
T/F - The GIS is only meant to store data
False, it allows us to find solutions to problems
quantile classification
Distributes the data so that an equal number are in each bin
Natural breaks classification
bins are bassed on natural groupings within the data
equal interval
divides the range of attribute values into equal-sized bins
What is the need for database management
- There is a lot of data, which causes overloads, anxiety and fatigue
- Database management is a coping strategy
- It allows us to find meaningful information for decision-making purposes
What is a database?
- A structured set of data that has some connection or relationship to each other
- May contain both non-spatial and spatial data
- In GIS we are going to deal directly with spatial data
- Descriptive info or metadata usually accompany the database
Spatial Database Management Systems ( SDMS )
Software tools and systems to achieve :
- create both attributes and spatial data
- manage the storage and retrieval of data records
- provides a GUI interface to inquire the spatial database
Database Models
set of explicit rules for representing the data objects and their relationships
Relational ( Tabuler ) Database Model
- Data is stored in and relationships are created between one or more flat files or tables where each pair of tables has a field in common, or "key"
- Data is extracted by structured query language (SQL)
Correcting Location and Attribute Errors
- All spatial data contains some level of error
- It is the responsibility of the data user to be aware of errors and make necessary corrections
- Indications of errors: impossible values, external values, internal consistency, scatter plots and trend surfaces
Management Tasks might be :
- Converting data from vector to raster and vice versa
- importing and exporting data between different sources
- the fancy term for this is Spatial Data Interprobability
Querying the Database
SQL ( Structured Query Language)
- Allows us to to ask questions
- uses = , <, >
- uses "and, or"
- number, dates, texts, other types
- math operations do not work
- queries can simply select records
- queries can perform advanced operations
- for spaital data we use things such as : " near to, far, from "
What capabilities does ArcGIS Online software have ?
The ArcGIS Online software has capabilities to control what happens to your data in terms of editing
Coordinate system
keeps all locations across the data layers to be in sync with each other
Digital Earth
a virtual representation of the Earth that is georeferenced and connected to the world's digital knowledge archives.
Geographic Information Science
- Philosophical, epistemological and ontological contexts of geographic information
- deals with concepts, theories and methods as well as their applications
Geographic Information Systems
Provides the infrastructure, tools and methods for tackling real world problems
Geographic Models and Algorithims
- Investigating important problems
- Scientific software that is used to represent and manipulate scientific domain objects, relationships and processes
- Converts computer information into science that advances the infrastructure of hardware and software networks and data management for problem-solving
Methods and Concepts
- Used to discover knowledge
- Methods must be objective, transparent, reproducible and verifiable for others
- Methods are systematic approaches or procedures employed to achieve a specific goal
- concepts are abstract ideas or general notions representing categories of objects, events, or phenomena.
Measurements ( Spatial Relationship )
- What are the physical distances, lengths and areas?
- vector - deals with points, lines and polygons
- vector deals with point coordinates to do the calculations
- patterns, distance, perimeter, area, recoding, cost distance
Cost Distance
- Distance travelled that takes in friction and effort
- For example: travelling on a road - it is not always the same because there are different barriers and obstacles in the way