Introduction, Data and Experiments
1/31
There's no tags or description
Looks like no tags are added yet.
Name | Mastery | Learn | Test | Matching | Spaced | Call with Kai |
|---|
No analytics yet
Send a link to your students to track their progress
32 Terms
What are Histograms?
Histograms visualise the distribution of a dataset.
What are the shapes of histograms described by?
The shape of many histograms (but not all) are described by the mean, variance, skewness and kurtosis. Note that in distributions shape is important.
Histograms and Distributions - how do we summarise data?
We need to take steps to simplify and summarise the numbers into something more digestible. E.g. simply count how often each number occurs.
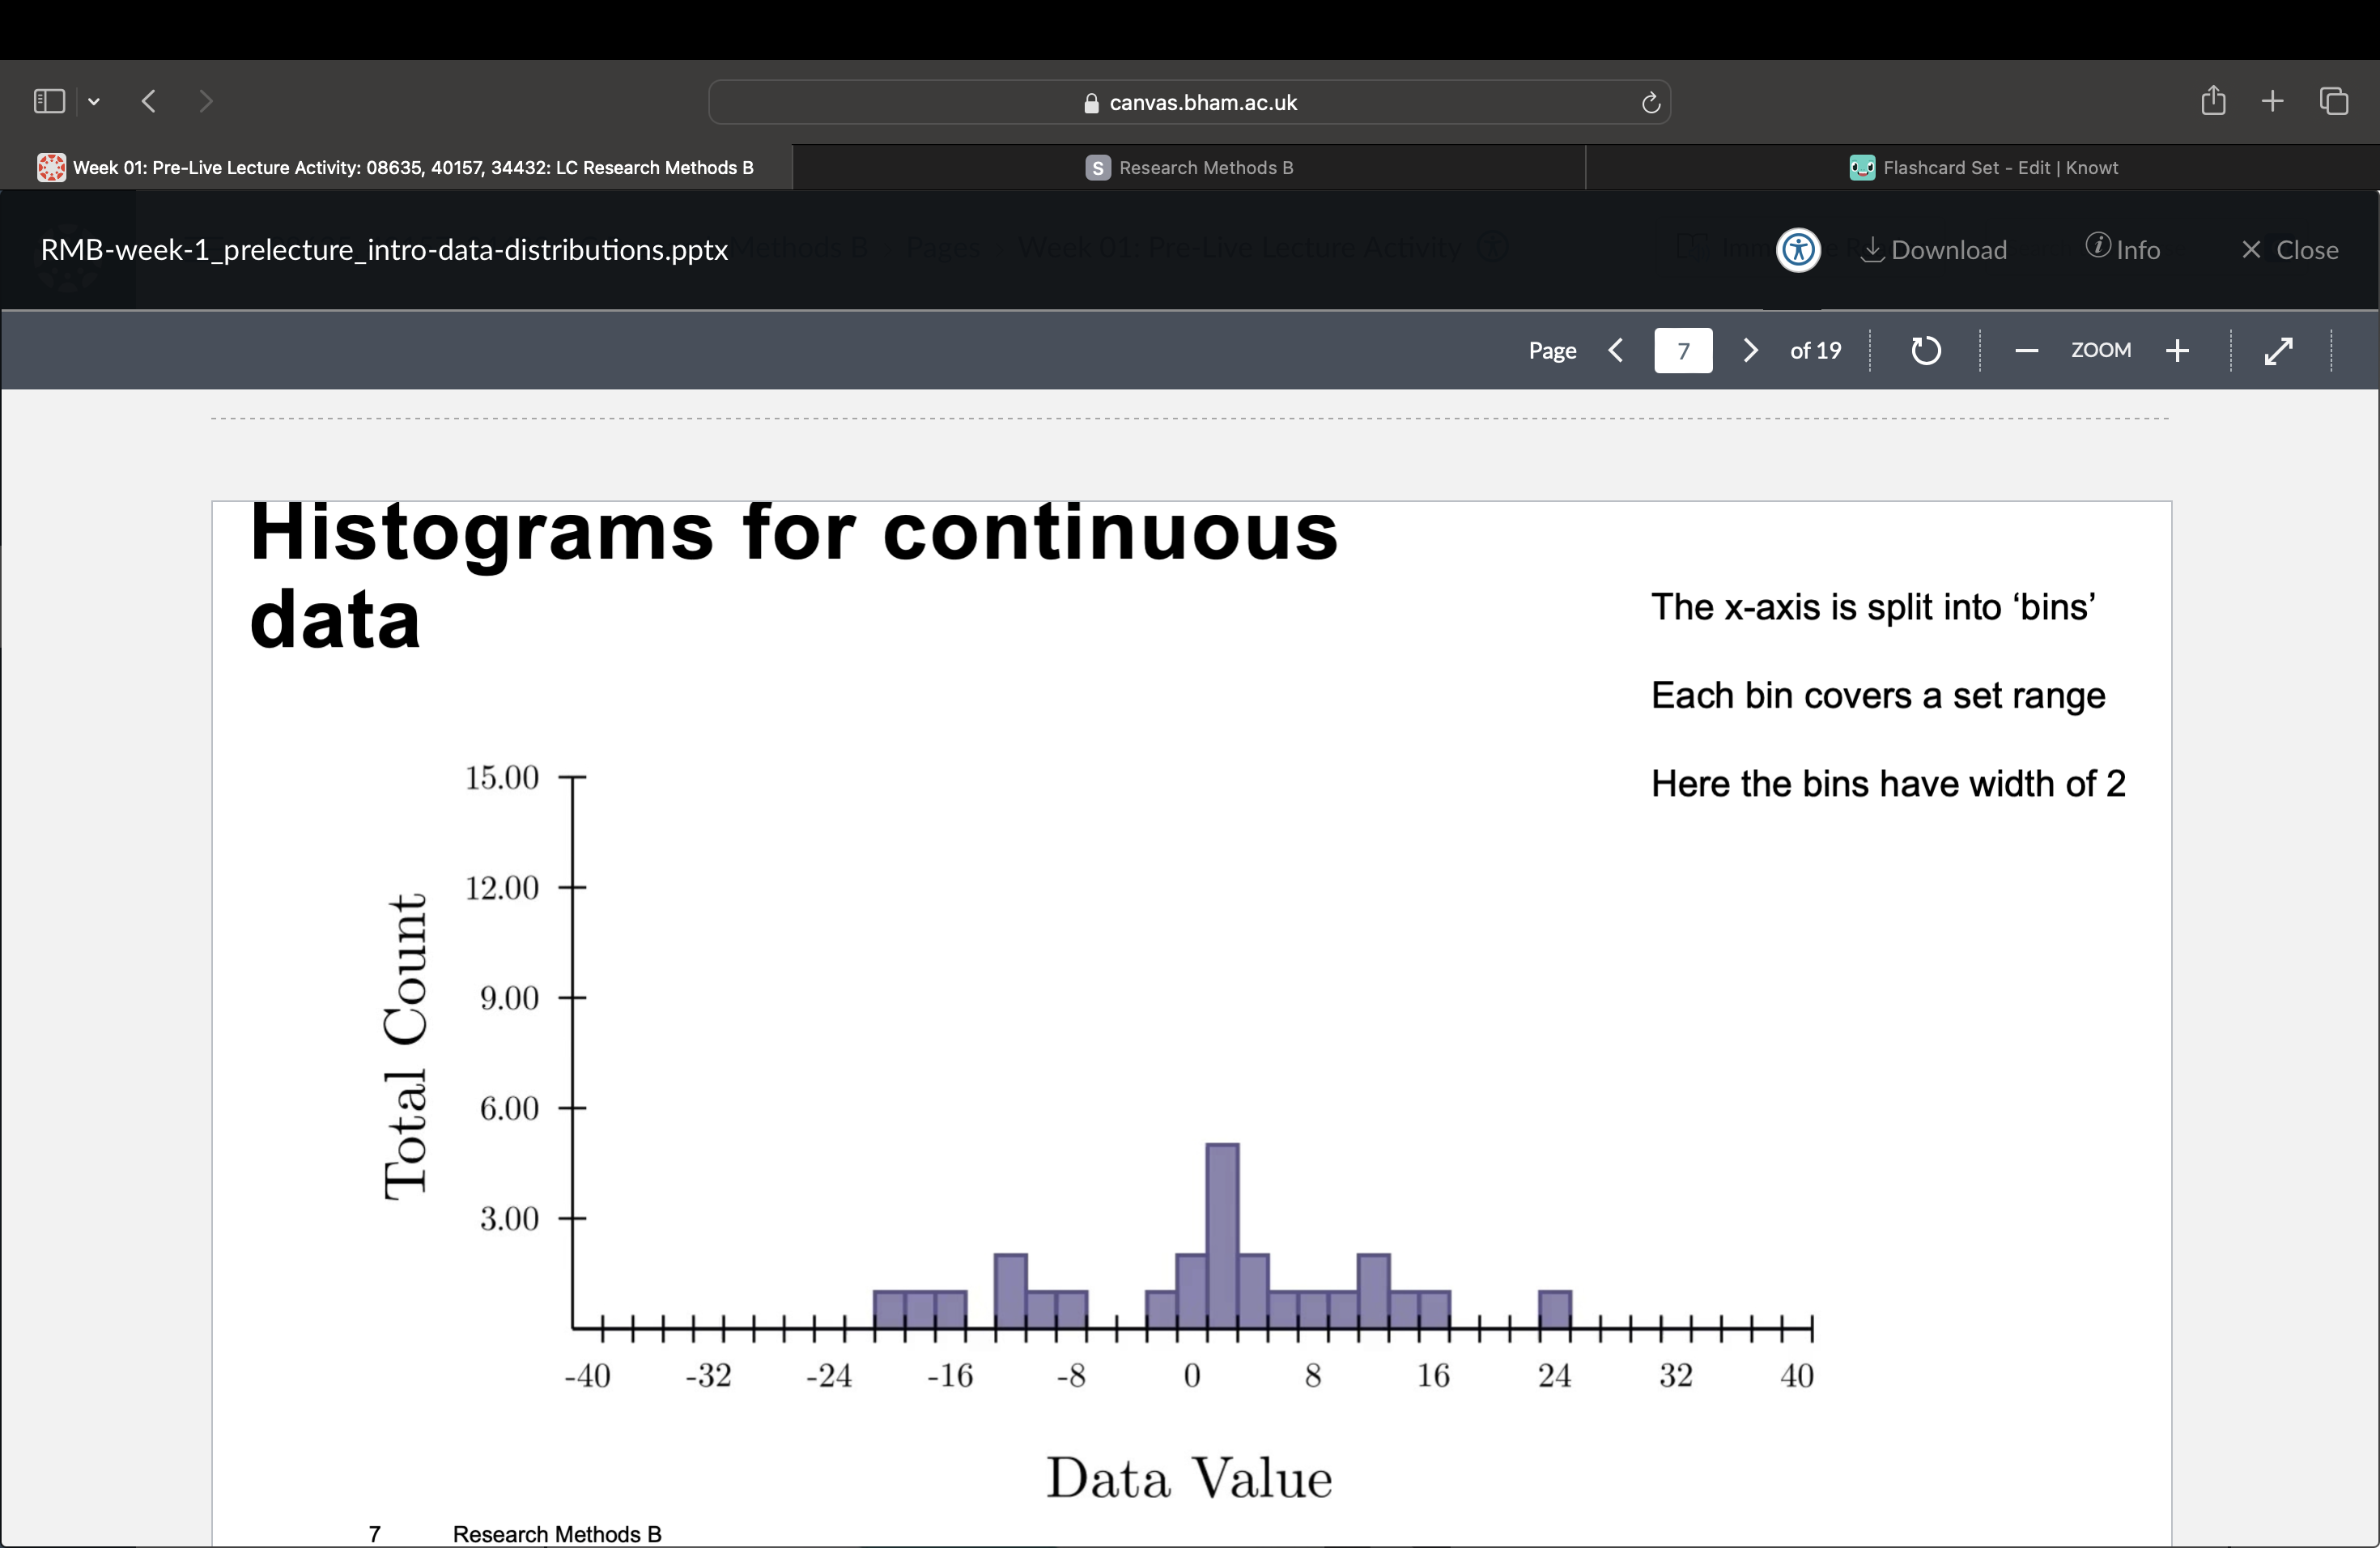
What does histograms for continuous data look like?
The x-axis is split into ‘bins’ and each bin covers a set range. Here the bins have a width of 2. Each data point in the dataset is added to its bin until the whole dataset is displayed.
What do bins show in a histogram?
More bins show the distribution with higher resolution but this can get noisy. Fewer bins are less noisy but can also be less informative.
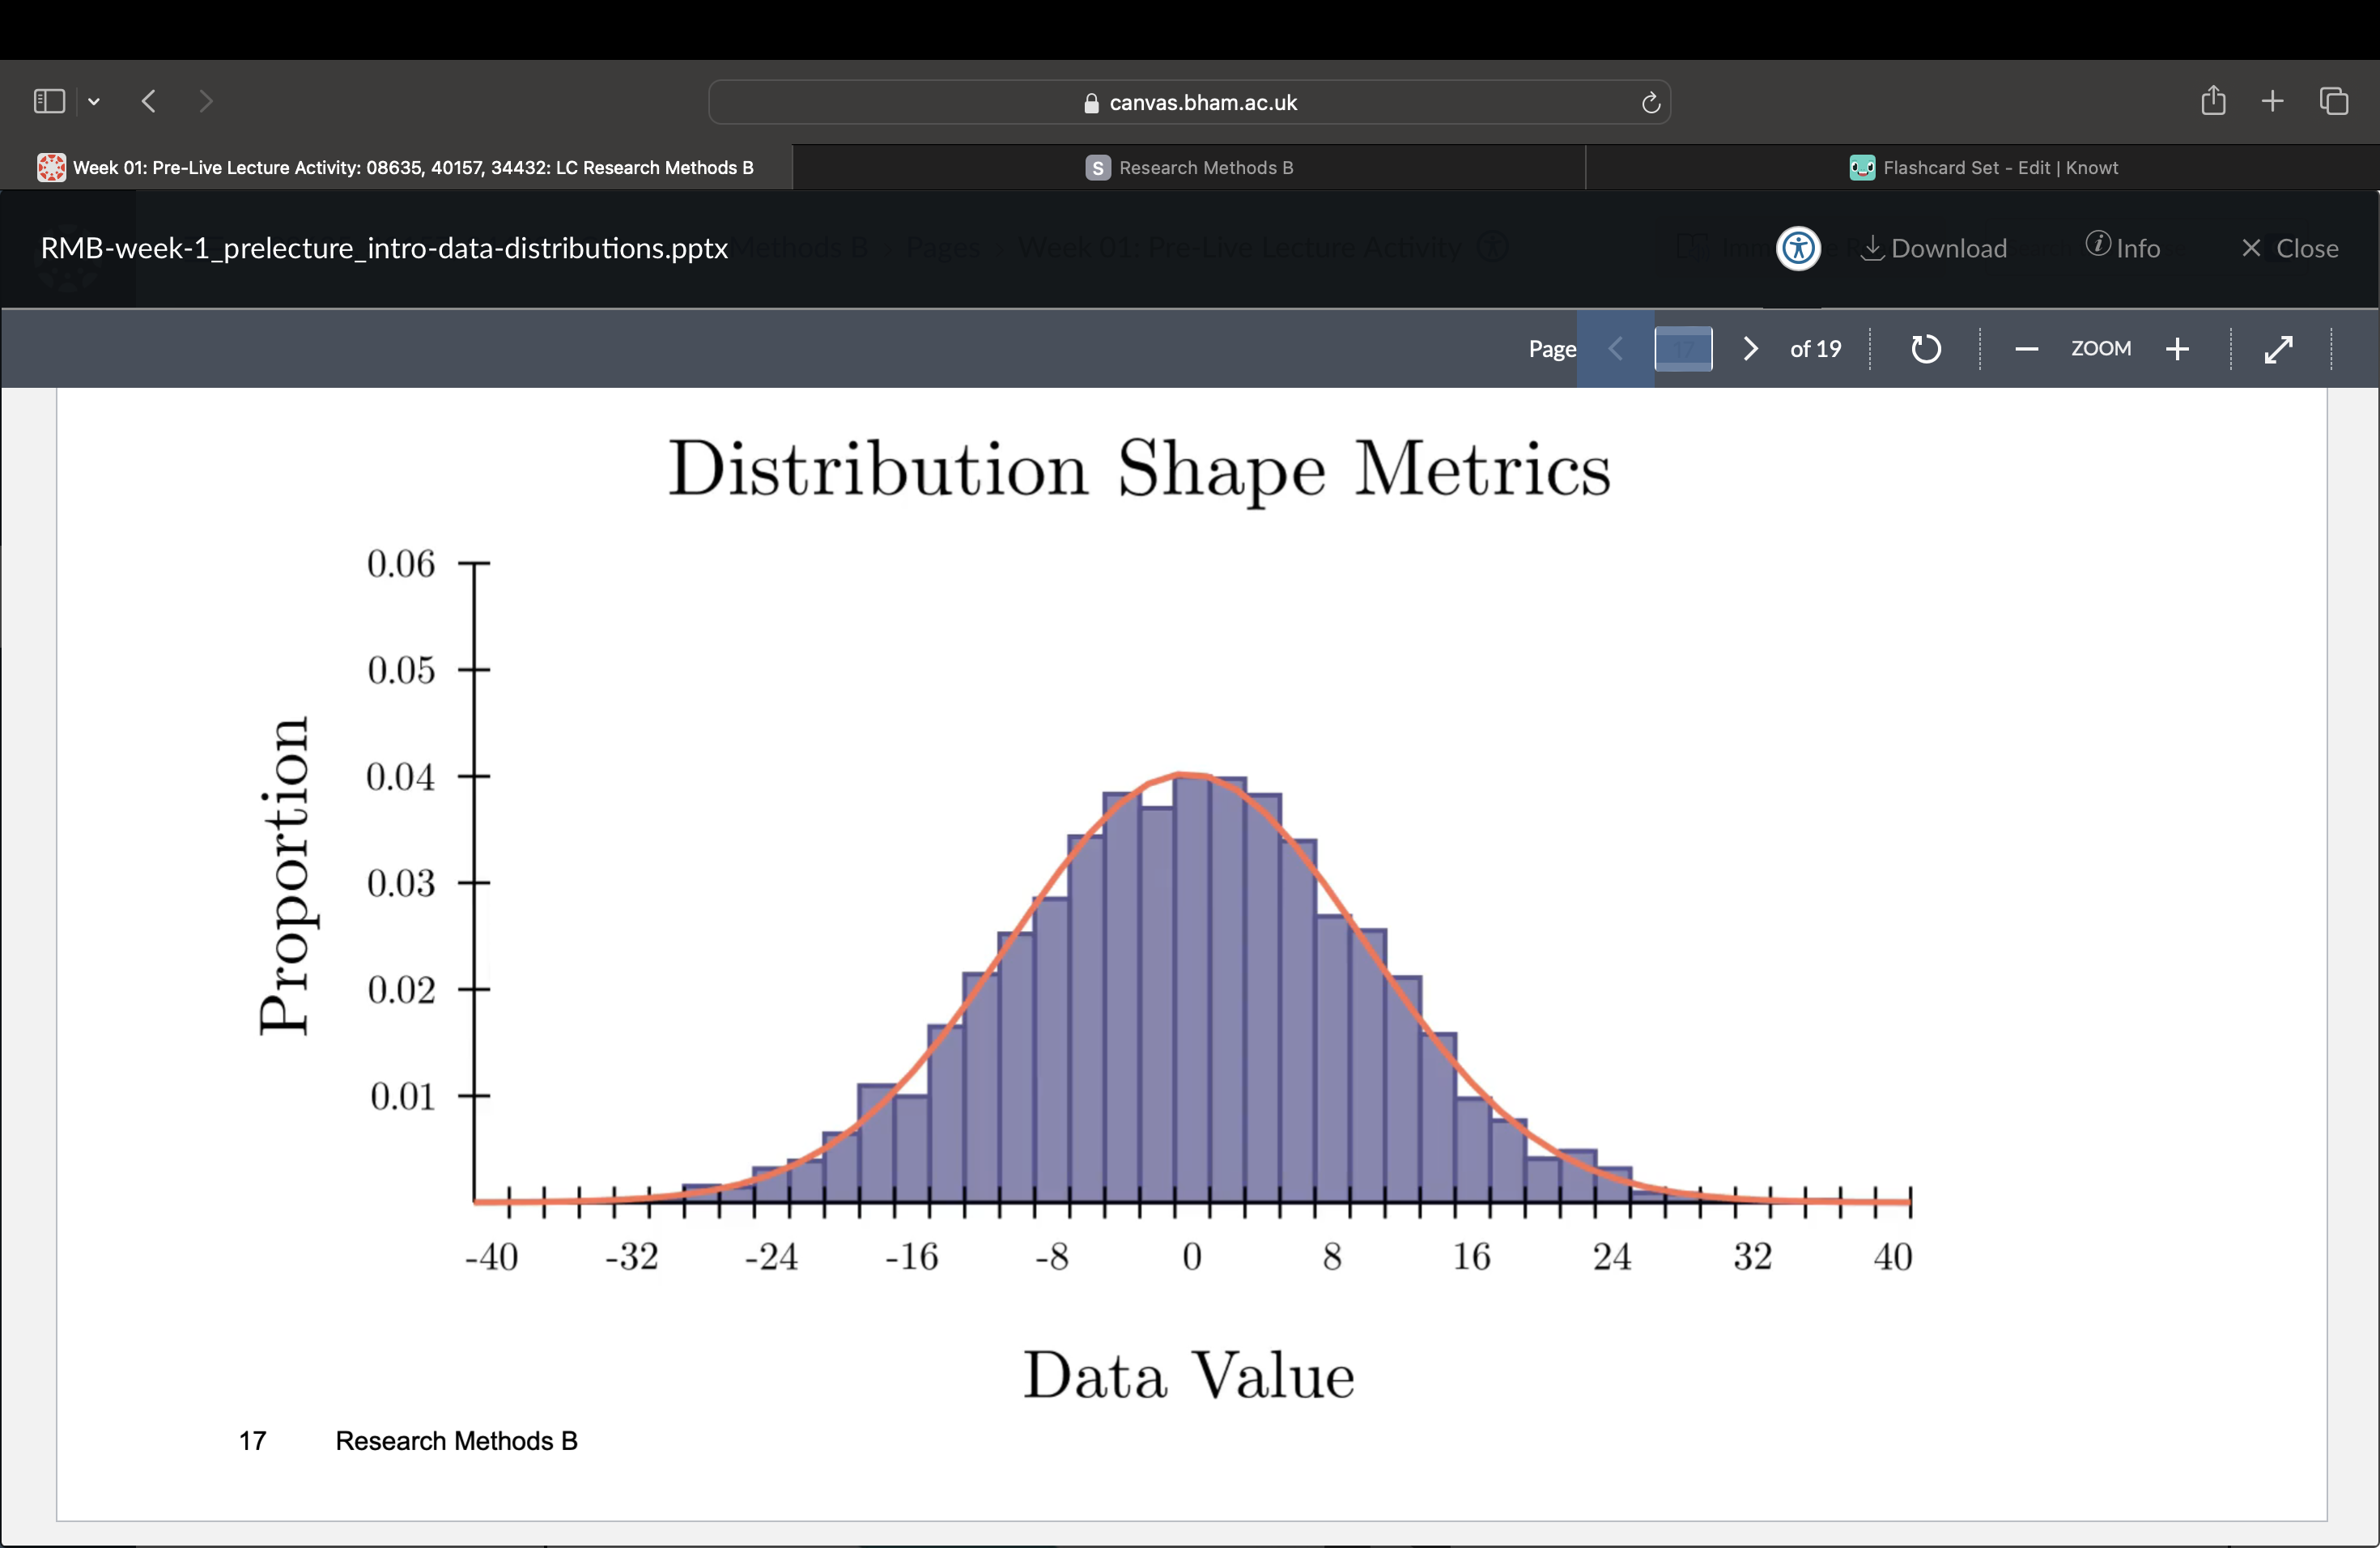
What does a normal distribution look like?
What is a hypothesis?
A proposed prediction about a phenomenon and a scientific hypothesis is a testable prediction derived from pervious data or theory. E.g. “drinking coffee will improve how people drive when they are tired.
How are scientific processes defined?
By generating and testing different hypotheses.
How can hypotheses be compared?
Statistics are formal methods for comparing different hypotheses using data.
What is a null hypothesis?
This is typically a description of how the data would look if there was no effect at all. They are used because we need something to compare our hypothesis to. E.g. “people will drive the same whether they have consumed any coffee or not.”
What do statistical tests do to the null hypothesis?
They work to reject the null hypothesis and if the null hypothesis is not supported by the data then we accept the experimental hypothesis.
What is an experiment?
A scientific procedure used to test a specific hypothesis. We manipulate one variable in a controlled way to see its effect on another variable. Often we will need to design an experiment to test a hypothesis.
What is an independent variable?
The factor in an experiment that is intentionally changed, manipulated, or controlled by the researcher to observe its effect on another variable. Also known as a ‘predictor’ and there can be more than one in a single study.
What is a dependent variable?
The specific factor being measured, observed, or tested in a scientific experiment or statistical model. Also known as a ‘outcome’ and there can be more than one in a single study.
What are statistics?
Statistics enable us to make comparisons based on data and to tell whether a hypothesis is supported by the data.
What is a test statistic?
A value that quantifies how close the data are to the null hypothesis.
How does the test statistic relate to the null and experimental hypothesis?
If the test statistic is small and likely to have happened by chance, then we can accept the null hypothesis. If the test statistic is large and very unlikely to have occurred by chance, then we can accept the experimental hypothesis.
What is a P-value?
The probability that a particular test statistic could occur, if the null hypothesis is true.
What do statistical tests do?
They allow use to describe data and test between hypotheses.
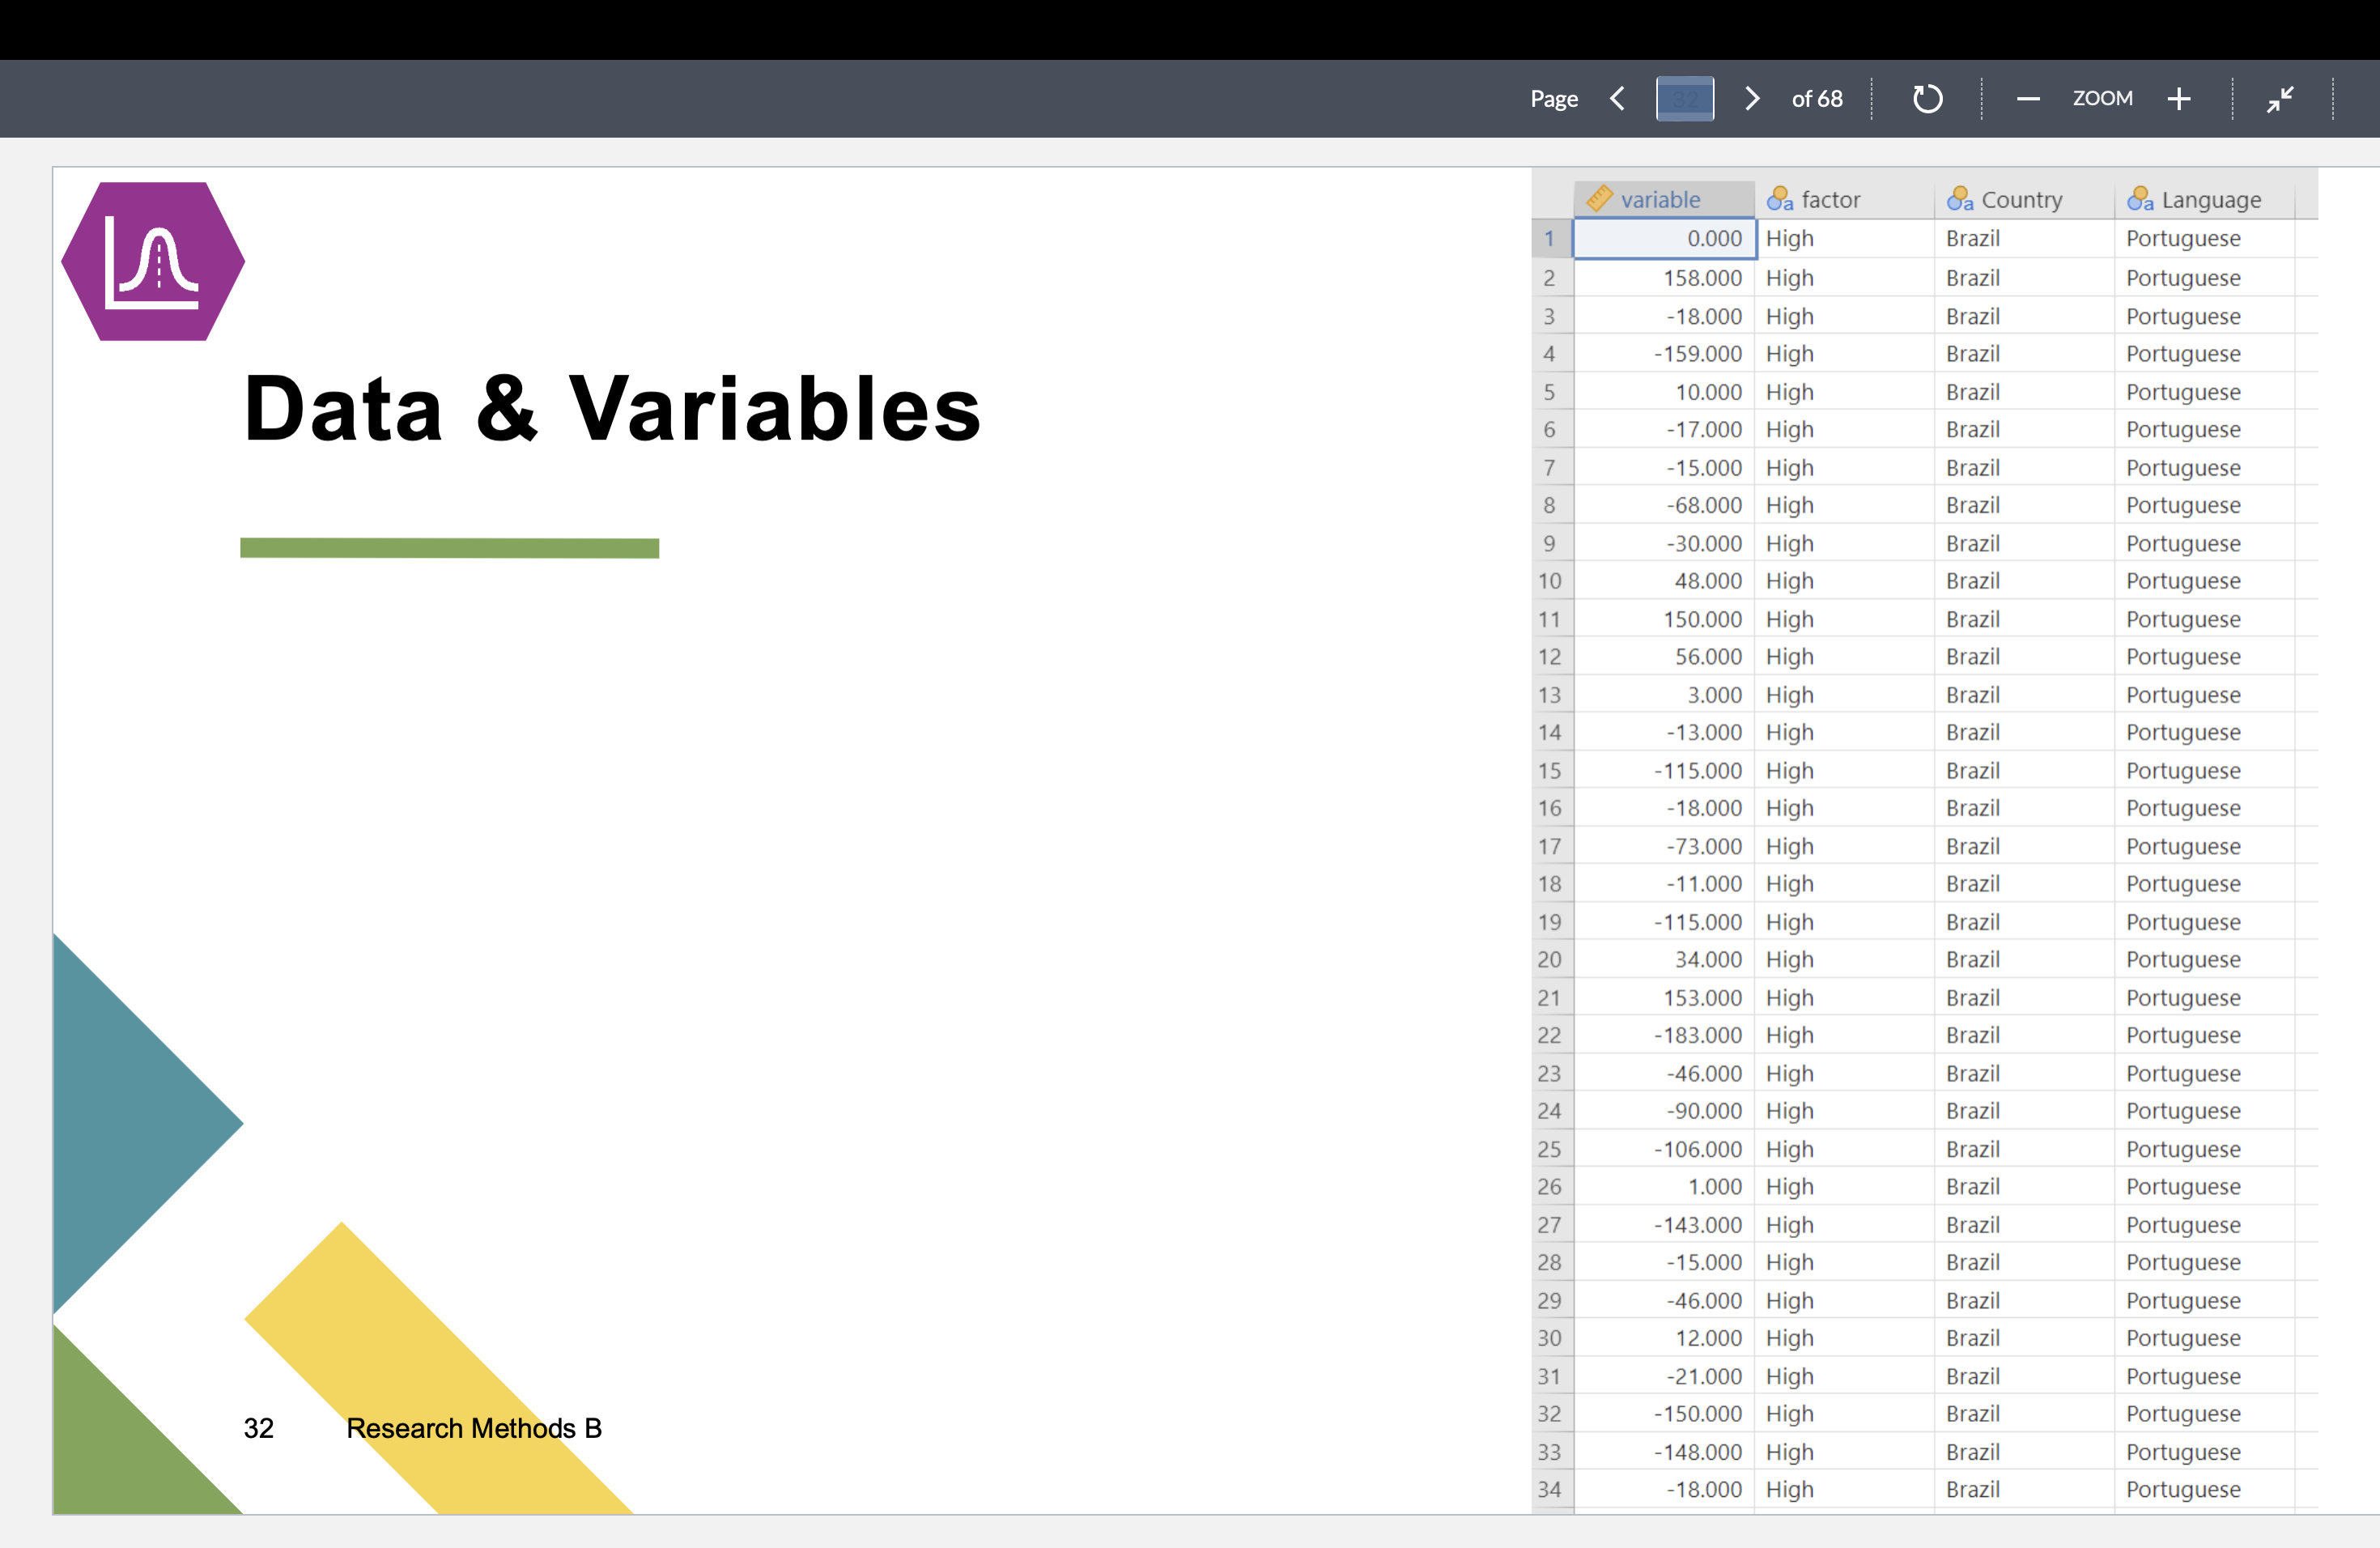
What is a dataset?
A collection of data acquired for a specific purpose. It may relate to multiple experiments or hypotheses.
What is a variable?
A number that can ‘vary’ (e.g. take a high or a low value) depending on an attribute that we’re trying to measure. We typically measure several variables from each participant and these typically form one column in a data file.
What is a nominal variable?
No relationship between different possibilities in a scale. Sometimes called ‘Categorical’ data. E.g. country of origin.
What is a ordinal variable?
A natural order between possibilities but nothing else. Can’t interpret the ‘magnitude’ of differences. E.g. likert scales.
What is a interval variable?
The possibilities are ordered and have interpretable magnitudes, though ‘zero’ does not have a special meaning. E.g. temperature.
What is a ratio variable?
Like interval data, but now zero is directly interpretable and we can interpret ratios between values. E.g. reaction times.
What is a continuous variable?
A variable that can change freely to take any value. E.g. temperature could be 4C, 10.34C or -0.0000513C. Interval and ratio are continuous.
What is a discrete variable?
A numbered variable that takes one of a fixed set of values. E.g. number of cars owned. Nominal, ordinal, interval and ratio are discrete.
What’s the importance of the choice of measurement?
How we choose to measure a variable can affect its type. E.g. a person’s true height is continuous and ratio as it is an attribute which has an exact value with an interpretable zero that we can measure to any precision but if an experimenter chooses to record height to the nearest cm, then that variable would be discrete and ratio. Therefore, these labels are not fixed or absolute - there is often a grey area between them. When choosing a measurement the labels are only a guide and judgement should be used to distinguish between them.
What is are latent variables?
Latent variables are variables that can only be inferred indirectly through a model from other observable variables that can be directly observed or measured. We must take care when research involves latent variables and ask questions like “what has actually been measured?” and “is the observed variable a good proxy”. We often must use observable factors as a proxy for important latent variables (this can be difficult though).
What is quality of life?
Quality of life is a ‘latent’ variable that is inferred from observed variables that we can directly measure e.g. health, financial stability, social support etc.
What is research about?
Research is about learning from data.
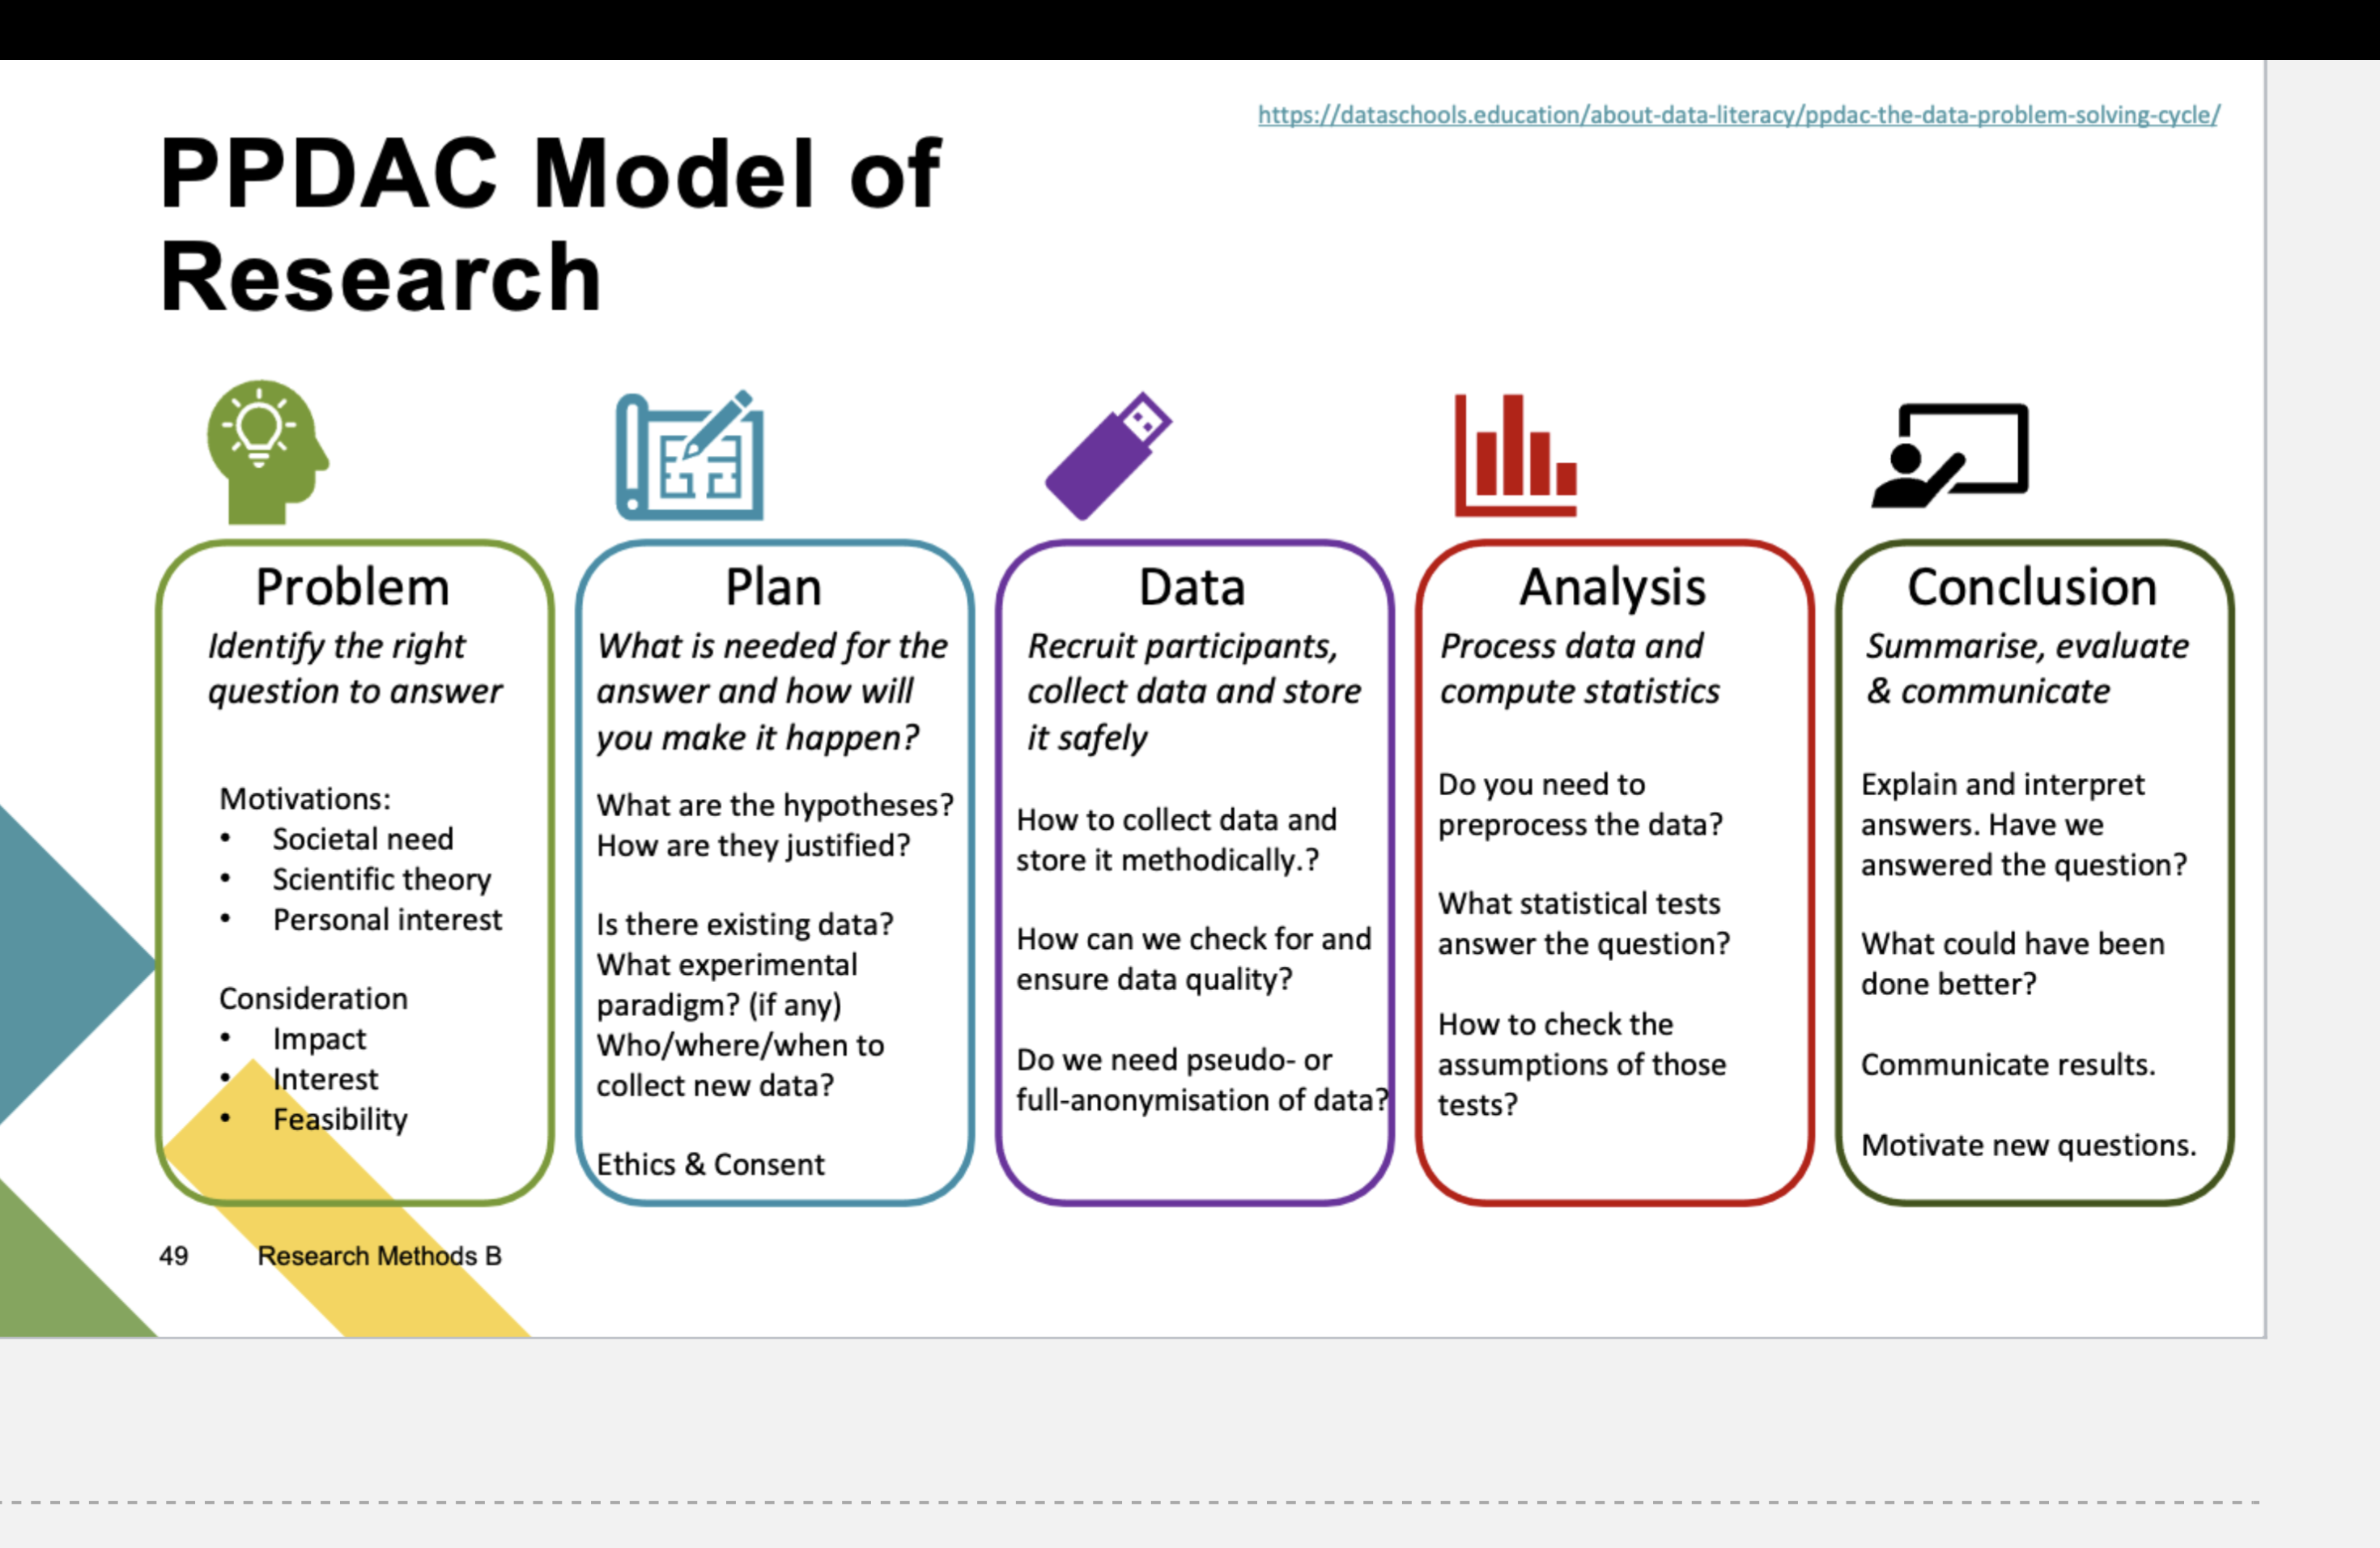
What is the PPDAC Model of Research?