MSCI 370 Final Midterm Review
5.0(1)
Card Sorting
1/90
Earn XP
Description and Tags
Final Midterm
Study Analytics
Name | Mastery | Learn | Test | Matching | Spaced |
|---|
No study sessions yet.
91 Terms
1
New cards
Chlorophyll can be found at low levels in those region because of poor nutrient availability.
Why do vast regions of the ocean contain chlorophyll at low levels?
2
New cards
Light, nutrients and temperature
Identify the three abiotic factors that control phytoplankton growth
3
New cards
There are oceanographic processes that can directly interact with the ocean and disrupt those layers.
How does the ocean remain so productive, if there is little nutrient availability in most parts of the region?
4
New cards
Local, short-term, seasonal variation, and upwelling
Identify the four mechanisms that disrupt the two-layered oceans
5
New cards
In shallow waters, wind and current-driven turbulence of the ocean can lead to the mixing of the water column. This causes nutrients to be resuspended in the water column and transported to surface waters that contain phytoplankton populations. This process essentially maintains the availability of trace nutrients in the water.
Identify and describe a local effect that disrupts the two-layered ocean.
6
New cards
Storms can induce turbulent mixing of the water column that mixes the nutrient rich deep water with the surface waters. In some cases, storms can briefly induce upwelling along their pathway.
Identify and describe a short-term effect that disrupts the two-layered ocean.
7
New cards
In temperate seas, the thermocline and pycnocline are broken down during the fall and winter months which induces vertical mixing between deep waters and surface waters.
Identify and describe a seasonal variation effect that disrupts the two-layered ocean.
8
New cards
Temperate seas only experience vertical mixing when the temperatures of both surface and deep waters are similar, providing a limited time frame for them to mix. In contrast, Arctic seas experience no thermocline which results in the mixing of both surface waters and deep waters for most of the year.
Explain how seasonal variation between temperate seas and arctic seas develops differing conditions for vertical mixing.
9
New cards
The effects of Ekman transport pulls the surface water away from the coastline and the deep waters move up to fill in the missing void and mix with surface waters. This is a form of coastal upwelling.
Identify and describe an upwelling effect that disrupts the two-layered ocean
10
New cards
Coastal upwelling occurs along the coast, where the movement of surface waters away from the shoreline is alleviated by the upward movement of deep waters. Equatorial upwelling is the result of Coriolis interactions that bring in macronutrients towards the surface.
Explain how coastal upwelling and equatorial upwelling differ?
11
New cards
The western basin experiences a thicker thermocline due to the movement of water piling up on the western basin
Why is nutrient enrichment absent/very little in the western basin of the Pacific Ocean?
12
New cards
The growth rate of phytoplankton is expected to increase with temperature to a maximum threshold before dropping. This is inclusive of all types of phytoplankton with different temperature tolerances.
What does the Eppley Curve describe?
13
New cards
Warmer temperatures influence the rate of metabolism for phytoplankton
According to the Eppley Curve, how does temperature affect phytoplankton growth?
14
New cards
Ammonia (NH4 +), Nitrate (NO3 -) Phosphate (PO4 3-), Silicic acid (SiCOH4), pure Iron (Fe)
Nitrogen, Phosphorus, Silica, and Iron are not normally obtained as single elements by phytoplankton. Identify a list of compounds that serve as sources for these elements
15
New cards
Nutrients are the scarcest resource for phytoplankton, thus the growth of phytoplankton is limited by the nutrient availability in the ocean (typically nitrogen)
Describe Liebig’s Law of Minimum under the context of nutrient limitation for phytoplankton
16
New cards
Growth is limited by the scarcest resource
Generally, describe Liebig’s Law of Minimum
17
New cards
Nitrogen can be extracted from “new” and “regenerated” sources
Identify the sources of Nitrogen that phytoplankton and the ocean carbon budget relies on
18
New cards
A source of a nutrient that comes from outside the system
Define allochthonous
19
New cards
A source of nutrient that comes from inside the system
Define autochthonous
20
New cards
Nitrogen gas is extracted from the atmosphere by nitrogen-fixing bacteria, which are then introduced to phytoplankton as dead organic matter
Describe how nitrogen enters a biological system (i.e., the ocean) from the primary producer perspective
21
New cards
Organisms in the ocean excrete nitrogen as ammonium and urea, these nutrients are picked up by phytoplankton and recycled into the system
Describe the movements of nitrogen as an autochthonous source
22
New cards
Nitrogen-fixing bacteria produces nitrate and introduces it as a form of nitrogen into the system where phytoplankton use that compound for primary production
What compound drives the allochthonous source of nitrogen? How is it formed?
23
New cards
This measurement is derived from new production divided by new production + regenerated production. These are determined by upwelling and limited nutrients.
What is the F-ratio?
24
New cards
cyanobacteria, haptophytes (coccolithophores, phagocytes), diatoms (centric and pennate), and dinoflagellates
Phytoplankton is an umbrella-term for photosynthetic microscopic organisms found in aquatic environments. Identify the groups that fall in this category.
25
New cards
This phytoplankton is responsible for harmful algal blooms (HABs) that produces a toxic chemical called domoic acid (causes shellfish poisoning).
What is the pennate diatom, __pseudonitzschia__, known for?
26
New cards
This group of phytoplankton can have harmful algal blooms (HABs) that produce either saxitoxin or breuetoxin
Can dinoflagellates produce toxins, if so, name these toxins.
27
New cards
Phytoplankton contain chlorophyll a, which allows them to absorb roughly 70% of blue light and 50% of red light. According to the Beer-Lambert Law, the iridescence of light decreases with depth and blue light takes the longest to dissipate as depth increases. Phytoplankton would be able to absorb blue light and survive at deeper depths until there is no light available (Compensation Depth)
Using the Beer-Lambert Law and the Compensation Depth, describe how phytoplankton are adapted to performing photosynthesis up to 200 m in depth within the Euphotic
28
New cards
This graph describes phytoplankton growth increasing as temperature increases. However, phytoplankton will reach a maximum threshold before dropping in growth rate.
What does the Eppley Curve describe?
29
New cards
Nitrogen is a limiting factor for phytoplankton growth
What element is a limiting factor for phytoplankton growth in terms of nutrients?
30
New cards
The “Redfield Ratio” best describes the typical ratio of nutrients needed for phytoplankton growth. Typically measured as 106:16:1 (C:N:P)
What is the best way to describe the limiting nutrients for phytoplankton growth
31
New cards
A smaller body size can uptake nutrients through active and/or passive transport
A small SA:V ratio allows for a higher nutrient uptake affinity in low-nutrient conditions
Most generally, a small size can allow phytoplankton to sink slower relative to other organisms
A small SA:V ratio allows for a higher nutrient uptake affinity in low-nutrient conditions
Most generally, a small size can allow phytoplankton to sink slower relative to other organisms
Describe “size matters” under the context of phytoplankton in the ocean
32
New cards
Primary production is the rate of photosynthetic carbon fixation. This can be further described by Gross Productivity, which is the total carbon uptake by photosynthesis without respiration (NP + Respiration), and Net productivity, which is the total carbon uptake by photosynthesis with respiration (GP - Respiration)
Define “Primary Production” and relate the term to Gross Productivity and Net Productivity
33
New cards
The “dark bottle method” is a way of measuring primary productivity at different light levels for a given depth in the euphotic zone. Typically involves the before and after measurements of dissolved oxygen.
What is one method to measure primary productivity in the ocean?
34
New cards
Photoinhibition described the level of light in which maximum gross productivity is decreased
What is photoinhibition?
35
New cards
The Beer-Lambert Law describes relationship between light iridescence with water depth. The area where all light is absorbed by water can mark where the Compensation Depth is located, where phytoplankton “break even” for the amount of light needed for primary production and net productivity is zero beyond this point.
Relate the Beer-Lambert Law with the Compensation Depth
36
New cards
Agricultural run-off of nitrogen into nearby rivers can result in an excess amount of nutrients and later an explosive population growth of phytoplankton that creates hypoxic conditions (eutrophication)
Identify and describe an example of an anthropogenic source that can cause harmful algal blooms.
37
New cards
Hypoxia is a common effect, this is due to the decay of phytoplankton and the excessive use of oxygen by the decomposers
What’s a common HAB effect on aquatic ecosystems?
38
New cards
This can be explained by food web vectoring, where primary consumers feed on the phytoplankton and their toxins concentrate inside their bodies. Bivalves are an example of this and consuming them when harvested from an affected area can expose you to neurotoxic shellfish poisoning.
While we can directly come into contact with toxins created by HABs, this normally comes in the form of accidentally consuming those toxins. Describe how we can contract these toxins without directly consuming phytoplankton
39
New cards
Optical proxies, toxin observations, and ocean observation systems
What are three methods that are used to detect HABs?
40
New cards
Fluorometry, Inherent Optical Properties (IOPs)
Identify the types of measurements for optical proxies
41
New cards
Target organism loading (bioassay), resin bean loading (SPATT), chromatographic (mass spectrometry measurements), molecular biology methods (ELISA)
Identify the types of measurements for toxin observations
42
New cards
Environmental sample processor (ESP)
Identify the types of measurements for ocean observation systems
43
New cards
This is a tool that can be used to monitor and forecast HAB events that can inform adaptive sampling approaches. These can present HAB events as anomalies and show how far the daily chlorophyll content differs from the mean content.
What is remote sensing imagery and why is this important for forecasting HABs?
44
New cards
Indirect measurements, cannot infer on a species level, coarse spatial resolution, limited by planetary patterns (atmospheric conditions) and space stuff (sun angle)
Identify the limitations for remote sensing imagery
45
New cards
The generation of biomass from heterotrophic organisms driven by the transfer of organic material between trophic levels
Define the term “secondary producers”
46
New cards
Some researchers like to classify them by size and function, while others prefer to classify them by taxonomy
What are two ways that we can use to identify secondary producers?
47
New cards
Energy flow is a unidirectional process, where sunlight will transfer energy to phytoplankton then the consumption of phytoplankton by zooplankton will transfer the energy between trophic levels.
How does the transfer of energy differ from the transfer of nutrients? Use the pelagic ecosystem while describing your answer.
48
New cards
Carbon can get locked into an ecosystem, and be transferred in multiple directions across the food web. This element makes up the majority of the biomass that is consumed or excreted. These biomass are then either transferred to another organism or can be lost in the sediments.
Using an element, explain why the transfer of nutrient not generally unidirectional.
49
New cards
Regardless of their biomass, primary producers are able to produce quickly enough after being consumed which allows the entire ecosystem to maintain its structure.
In the marine environment, we can observe that the biomass of primary producers are relatively small. How can this ecosystem sustain itself if there is little energy to be transferred between primary producers and primary consumers?
50
New cards
As energy gets transferred between levels, only \~10% of the energy actually makes it to that next level. In longer food chains, more energy is lost between level which explains for the less energy efficiency. Shorter food chains do not experience this type of energy loss between each level, so the transferred energy is more efficient in this case.
In terms of trophic energy transfer, explain how long food chains are less efficient at using primary production than shorter food chains.
51
New cards
There is a critical process called “The Microbial Loop”, where bacteria repackage and reincorporate dead organic matter (DOM) back into the food web. This is reintroduced through consumption of the bacteria.
Describe how energy being reintroduced in food webs.
52
New cards
These environments are found in mid-ocean gyres, where the producers are less prevalent than the decomposers. Unlike the latter, nutrients are locked into the surface waters and are less likely to be lost to the deep sea. There is also a tendency for there to be a longer food chain due to the locked nutrient situation.
How do oligotrophic environments differ from eutrophic environments?
53
New cards
These environments can be found in areas of upwelling and experience larger producer biomass relative to bacterial biomass. Nutrients are not locked into the surface waters and can be lost through fecal pellets of the organisms. There is also a tendency for there to be a shorter food chain due to the abundance of producers in the area.
How does eutrophic environments differ from oligotrophic environments?
54
New cards
Any population will reach a maximum population size that can be sustained indefinitely by the environment. This concept can be better represented using a logistics graph. Assuming that we introduce grazers to a population of phytoplankton at carrying capacity, we would expect there to be a decrease in the maximum population with fluctuations overtime.
Define carrying capacity and make a prediction about the population size of phytoplankton before and after the introduction of grazers.
55
New cards
Between trophic levels, the energy transfer decreases which determines the ideal population size a population can sustain with those resources. As we increase the trophic level, we are able to notice a decrease in population size due to the loss in energy.
Using this list of calculations from N2 = E\*N1, make an inference about the population size of organisms and energy transfer between trophic levels
* Dinoflagellates = (0.70)(1000) = 700
* Copepods = (0.30)(1000) = 300
* Filter feeders = (0.10)(1000) = 100
* Arrow worms = (0.30)(1000) = 300
* Sea lion = (0.03)(1000) = 30
* Orcas = (0.01)(1000) = 10
* Dinoflagellates = (0.70)(1000) = 700
* Copepods = (0.30)(1000) = 300
* Filter feeders = (0.10)(1000) = 100
* Arrow worms = (0.30)(1000) = 300
* Sea lion = (0.03)(1000) = 30
* Orcas = (0.01)(1000) = 10
56
New cards
What we are observing is an example of bottom-up control of a food web. The key detail is to track the size of the primary producer population and the chemical and physical processes that influence it. Subsequently, the abundance of the population on higher trophic levels.
Nutrient run-off from the land influences the growth rate of epiphytes and results in an increase in epiphytes abundance. Additionally, the abundance of herbivores is influenced by the increase in food sources and will see a change in their population size. In response, the predators will change their population size as well.
57
New cards
What we are observing is an example of top-down control of a food web. The key detail to track is the size of the top predator population and its influences on the populations for subsequent levels.
The overhunting of sea otters resulted in an increased abundance of sea urchins due to the lack of natural predators. As a result, the urchin population grazed heavily on the giant kelp population reducing the amount of kelp cover for an ecosystem. What is this an example of? Describe a marine example of a top-down control of the food web
58
New cards
What we are observing is an example of a trophic cascade. The key detail to track is not only the food chain between sea otters and giant kelp is affected, but other species are (both directly and indirectly)
We observed the large sea urchin population overgrazing and reducing the size of kelp forests, we also noticed a decrease in fish populations due to a lack of shelter and other things. What is this an example of?
59
New cards
The different conditions from this type of upwelling creates an ecosystem with large plankton becoming more prevalent in offshore areas. This can result in the occurrence of different fish species who specialize in consuming these organisms.
Describe how wind-stress curl influences the distribution of organisms in a coastal marine ecosystem.
60
New cards
The different conditions from this type of upwelling creates an ecosystem with large plankton becoming less prevalent in offshore areas. This can result in the occurrence of different fish species who specialize in consuming these organisms.
Describe how coastal boundary upwelling influences the distribution of organisms in a coastal marine ecosystem.
61
New cards
This type of upwelling experiences multiple areas of upwelling that restores nutrients in offshore locations. The atmosphere also experiences stronger wind, facilitating this type of upwelling. This prolongs the amount of nutrients available to an ecosystem and extend the range of phytoplankton blooms.
Describe the significance of wind stress curl upwelling and how it differs from coastal boundary upwelling.
62
New cards
This type of upwelling is common for most of the California coast. The atmosphere experiences wind with equal speeds and form one area of upwelling. There is no regenerating occurring offshore and the nutrients dissipate as a result. This shortens the range of phytoplankton blooms.
Describe the significance of coastal boundary upwelling and how it differs from wind stress curl upwelling.
63
New cards
A model is “some representation of reality” that provides a starting point for hypotheses with no precise simulation of reality. They can address questions that considers: theoretical, heuristic, and predictive
Define a model and identify the types of questions they can address.
64
New cards
Models are good to help answer hypotheses but they are not precise and can be considered “wrong” because they leave out a factor
What is a flaw for all models?
65
New cards
Shelled organisms in the intertidal zone can experience weakened carbonate shells and increase their vulnerability to both abiotic and biotic factors.
Why are low pH levels from upwelling zones a danger for organisms living in the intertidal zone?
66
New cards
This can help us quantify processes and fluxes to build synthetic landscapes and explore scenarios that help identify flaws in hypotheses that can be detailed in the future.
Why do we model marine ecosystems?
67
New cards
A model that predicts the phytoplankton, zooplankton, and nutrient stock size in the marine environment. They help quantify processes and fluxes (growth rate and death rate). The physical model can be run simultaneously with an NPZ on a spatial and temporal scale. Physical models tell us the mathematics of the system and the NPZ model applies the biological aspects (connection of math).
Describe the NPZ model of the food web. Why is it useful for biologists? How does an NPZ model connect to physical models?
68
New cards
Occurs when wind runs down the coast and pushes water perpendicular away from the direction of the wind. It breaks down the water and mixes the thermocline (disruption), causing the SST to decrease. The nutrients from remineralization is brought up by deep waters, facilitating the growth of phytoplankton. In response to the increased abundance, more zooplankton will show up and consume phytoplankton.
Describe wind-driven coastal upwelling and how it affects ocean productivity nearshore. Be sure to include a discussion of the thermocline in your answer and a description of what happens to nutrients, temperature, light, phytoplankton, and zooplankton.
69
New cards
10
The average trophic transfer efficiency in the ocean is ____%
70
New cards
light
The yearly productivity pattern in polar oceans is driven by the availability of ____
71
New cards
Nutrient Uptake - Mortality of Phytoplankton - Grazing
Describe each of the variables for the Change in Phytoplankton equation from the NPZ model
72
New cards
Growth Efficiency \* Grazing - Mortality of Zooplankton
Describe each of the variables for the Change in Zooplankton equation from the NPZ model
73
New cards
Nutrient Uptake + Mortality of Phytoplankton + Mortality of Zooplankton + Growth Efficiency + Grazing
Describe each of the variables for the Change in Nutrients equation from the NPZ model
74
New cards
This term describes the maximum population size that an environment can realistically sustain over time. This is typically represented by a logistics model.
What is carrying capacity and what type of graph is used to model it?
75
New cards
Predict the population growth of fish to estimate surplus for each fishing season. Using the knowledge of fishing sciences in a precedent fashion
What are the two challenges for sustainable yield?
76
New cards
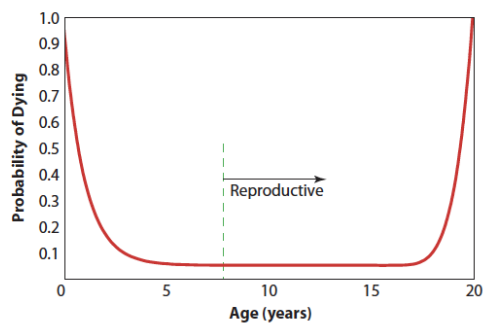
At a very young age and old age, the death rates for individuals are very high (both ends of the curve)
Using this survivorship curve for fishes, identify a point(s) on the curve where the death rates for individuals are high

77
New cards
Most of the fish’s life after recruitment and before old age (\~5-15 years) experiences a low death rate
Using this survivorship curve for fishes, identify a point(s) on the curve where the death rates for individuals are low
78
New cards
People will continue to invest directly into the fishery or components used to facilitate the fishery’s success. This act becomes popular through both the public and government until the fish population becomes unsustainable to live off of.
Aside from declining fish size, the fiscal optimism for a fishery is a telling sign that a fishery will collapse. how does fiscal optimism lead to this effect?
79
New cards
Roughly 2.7 billion metric tons of fixed carbon are lost from the ocean via fishing
85 million metric tons of marine fish that are caught each year represents how much of the fixed carbon lost from the ocean?
80
New cards
We need \~17% of this productivity
Based on the amount of fixed carbon is taken from the ocean via fish biomass, how much of the ocean’s sustainable productivity do humans require?
81
New cards
They can be established too late and fail regardless of the effort put into it.
Establishing landing limits can be a great example to control fisheries to provide an opportunity for fish populations to reestablish themselves. However, what problem can they encounter?
82
New cards
ENSO are irregular oceanic events that occur every 2-10 years that lasts from 12-18 months.
What is the El Nino Southern Oscillation (ENSO)? How often does this event occur.
83
New cards
A pattern of change in the Pacific Ocean's climate that occurs over decades.
Describe Pacific Decadal Oscillation (PDO)
84
New cards
The west Pacific cools down and the east Pacific warms up
Describe the warm phase of PDO
85
New cards
The west Pacific becomes warm and the east Pacific cools down
Describe the cold phase of PDO
86
New cards
The duration of PDO is measured within a few decades, roughly 20-30 years. It shifts phases using this scale.
Describe the frequency and duration of PDO.
87
New cards
We would expect a deeper thermocline that leads to weaker upwelling near the California coast. This results in the decreased presence of salmon, rockfish, and seabirds. Anchovies are less frequent and sardines are more frequent. This phase is also associated with low primary productivity
For PDO, describe the spatial patterns of warm water in the Pacific and the effect on the ecosystem.
88
New cards
We would expect a shallower thermocline that leads to stronger upwelling near the California coast. This results in the increased presence of salmon, rockfish, and seabirds. Sardines are less frequent and anchovies are more frequent. This phase is also associated with higher primary productivity
For PDO, describe the spatial patterns of cool water in the Pacific and the effect on the ecosystem.
89
New cards
PDO is bound above 20 N
What are the latitudes that bound PDO?
90
New cards
No, they’re not the same thing. They’re characterized by where these events are located. these two events can interact, and amplify or dampen their effects.
Are PDO and ENSO the same thing?
91
New cards
Rising temperatures can lead to a permanent El Nino event, that creates a long-term suppressed event of primary production (in theory)
What is a predicted effect of climate change on El Nino?