econ unit 11 ppt
1/36
There's no tags or description
Looks like no tags are added yet.
Name | Mastery | Learn | Test | Matching | Spaced | Call with Kai |
|---|
No analytics yet
Send a link to your students to track their progress
37 Terms
Externalities
1. Fundamental Welfare Theorems — Background for Externalities
__ Welfare Theorem
In perfectly competitive markets, with ideal conditions, the market outcome is ___.
“Efficient” = maximizes total surplus.
first, efficient
___ Welfare Theorem
Any efficient allocation can be achieved by:
___ wealth first
Then letting markets operate ___
Meaning: equality concerns ≠ efficiency concerns.
second, redistributing, freely
BUT these theorems depend on unrealistic assumptions:
All markets must be perfectly ____
– No market power, monopolies, or strategic behavior.All agents have ____ information and beliefs
– No misinformation, uncertainty, or asymmetric information.No externalities
– People only affect __
When any of these fail → markets can be inefficient.
competitive, perfect, themselves
2. What Are Externalities?
Externalities are the ___ of an economic choice that affect others who did not make the decision.
Positive externalities → third-party benefits
Negative externalities → third-party costs
Externalities occur in both production and consumption
Production: ____, bee pollination, R&D spillovers
Consumption: ___, congestion, Christmas lights
Externality = external effect.
consequences, pollution, noise
3. Examples from Daily Life (Slides 7–14)
“No man is an island” (John Donne, 1624)
Used to illustrate that: Individuals’ actions ____ affect others.
Negative Externalities
Congestion
Conflicting lawn maintenance
Household ___(Neve’s nasty nicotine addiction)
CO₂ emissions & climate change
Noise pollution
inevitably, trash
Positive Externalities
Christmas lights → neighborhood enjoyment
Education → societal productivity
____ → herd immunity
Employment → reduced crime
Flowers & bees → pollination
Network spillovers → social media value increases with more users
Graph example: CO₂ emissions vs. temperature (Slide 12)
CO₂ emissions rising from 1900–2025
Global temperature increases with emissions
→ Clear visual of negative externality: harm falls on everyone
vaccines
4. Externalities and Market Failure
Moral behavior vs. economic incentives
Ideally: people consider how their actions affect others
In reality: decisions are made based on ___ costs and benefits
→ Externalities are usually ___.
When externalities are ignored:
Private decision rule (selfish choice):
MC = MB
Social efficiency rule: MSC = MSB
MSC = MC + __
(Marginal Social Cost = Private cost + Marginal External Cost)
MSB = MB + MEB
(Marginal Social Benefit = Private benefit + Marginal External Benefit)
private, ignored, MEC
5. Negative Externalities (Slides 18–22)
Pollution
___ emissions
Traffic congestion
factory

Graph: Negative Externality (Slide 18)
Graph with Q (quantity) on x-axis and P (price) on y-axis.
Curves:
____ (private cost) = ___ curve ignoring external costs
MSC (social cost) = MC + external cost
→ lies ___*** MCVertical distance between MSC and MC = ____*** (external cost)
Producers do not bear the full cost → they overproduce
MC, supply, above, MEC
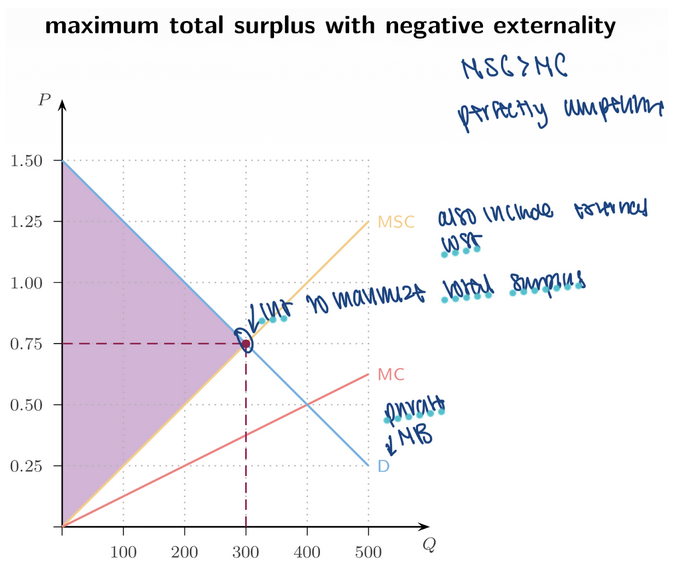
Socially Efficient Outcome (Slide 19)
Add the demand curve (D).
Efficient Q = intersection of ___ and D
Free-market Q = intersection of ___ ****and D
The efficient quantity is ____.
→ Society prefers ___ production than the market produces.
MSC, MC, lower, less
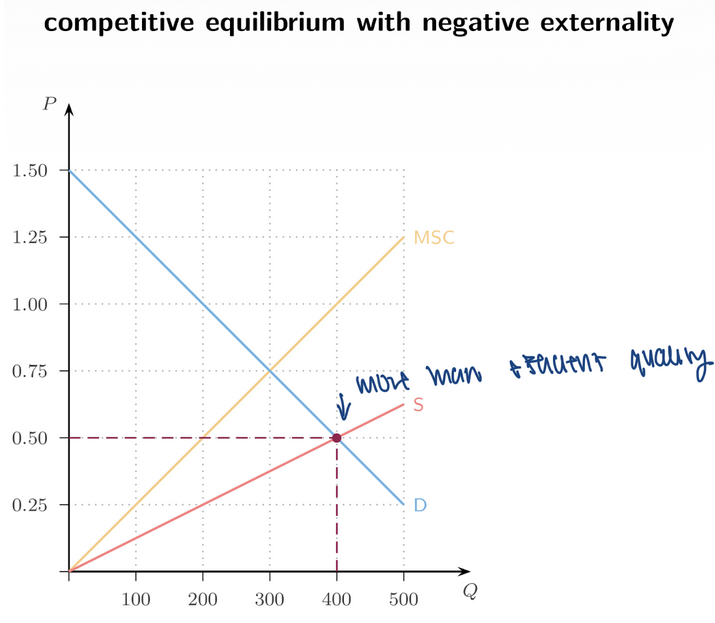
Competitive Equilibrium (Slide 20)
The market produces where: D intersects ___ (private supply)
→ Overproduction
MC

Negative Externality Summary
Free market results in:
___
Too ___ a price
___
overproduction, low, DWL
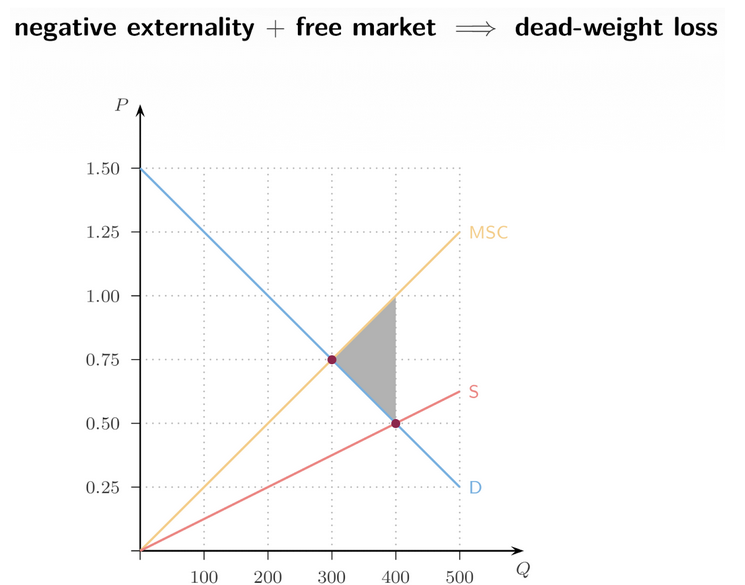
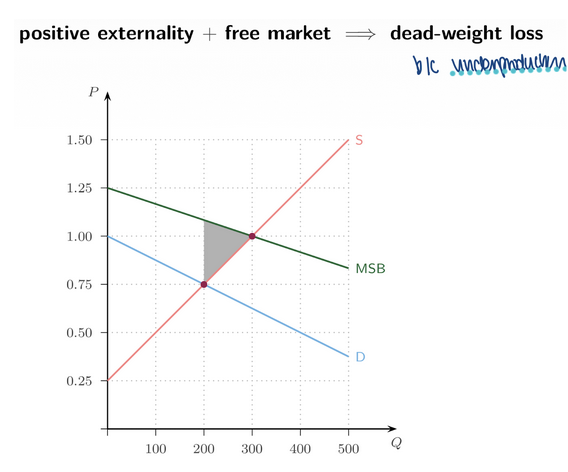
Graph: Deadweight Loss (Slide 22)
DWL = triangular area between:
__
__
__
between the efficient Q and the market Q.
MSC, MC, Demand

6. Positive Externalities (Slides 23–27)
Education
Vaccinations
R&D
Public __
Well-maintained lawns
art
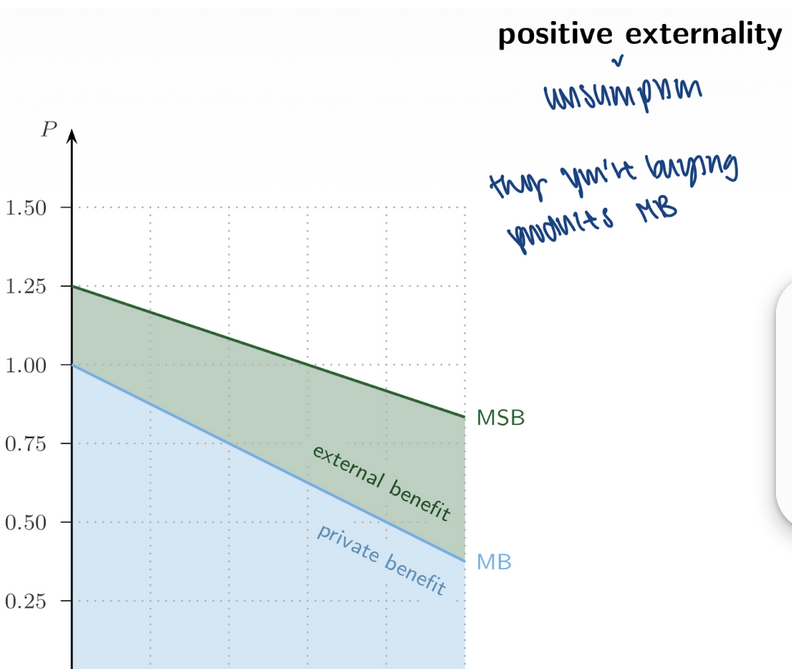
Graph: Positive Externality (Slide 23)
Curves:
MB (private benefit) = demand curve
MSB (social benefit) = MB + external benefit
→ lies above MB
Distance between MSB & ___ = MEB (external benefit)
MB
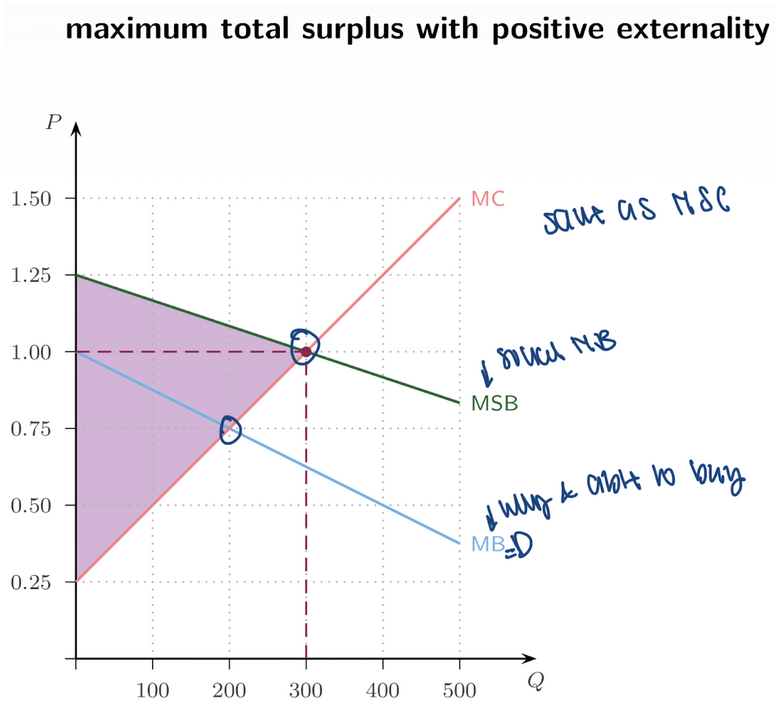
Efficient Outcome (Slide 24)
Efficient Q = intersection of: ____and ___
Market Outcome (Slide 25)
Market chooses: ___ intersects ___
→ __
MSB, MC, MB, MC underproduction
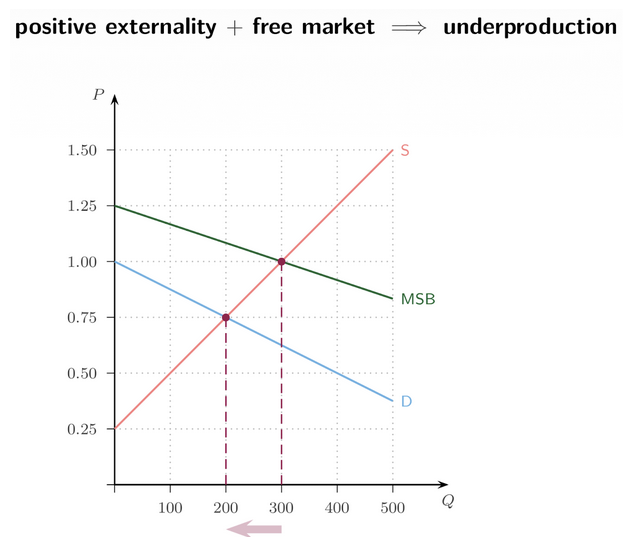
Market Outcome (Slide 25)
Market chooses: __ intersects __
→ __
MB, MC, underproduction
Positive __ Summary
Free market results in:
Underproduction
Too low a quantity
Deadweight loss
(DWL between MSB & MB between the two quantities)
externality
7. Why Markets Fail with Externalities
Competitive markets are efficient only if:
Every person is an ___ decisionmaker
No unintended ___ exist
But: In almost all real-world activities, externalities exist
→ Therefore, policy interventions can improve efficiency.
isolated, spillovers
8. Controlling Pollution (Slides 29–30)
Three major policy approaches:
1. Price Controls (bag fees)
Toronto considering $2 fee on plastic bags
Federal ban on single-use plastics (ongoing legal battle)
Effect: Raising price reduces __ = lower pollution.
QD
8. Controlling Pollution (Slides 29–30)
Three major policy approaches:
2. Quantity Controls (Quotas / Cap-and-Trade)
Canada drafting national cap-and-trade
Systems in: Quebec, California, EU, China
Mechanism:
Government sets a cap on total emissions
Firms receive or buy ___
They can trade permits → ensures ___ reduction.
permits, least-cost
8. Controlling Pollution (Slides 29–30)
Three major policy approaches:
3. Pigouvian Taxes (___ Taxes)
Canada:
Federal carbon tax + ___ since 2019
BC + Quebec have provincial systems
Canada reached peak emissions in 2023
Purpose: Make firms/consumers pay the full ___ cost.
carbon, rebates, social

9. Pigouvian Taxes (Slides 33–35)
A Pigouvian tax is a tax set equal to the marginal external cost (MEC).
T = ____
Effect on price:
Price consumers pay becomes: ___ + ___ = ____ + MEC = MSC
The tax internalizes the external cost
Market outcome becomes efficient again.
Assumptions (important for exams):
Government must be able to:
Accurately measure __
Have correct incentives (not use tax as cash grab)
MEC, P + T, MC, MEC
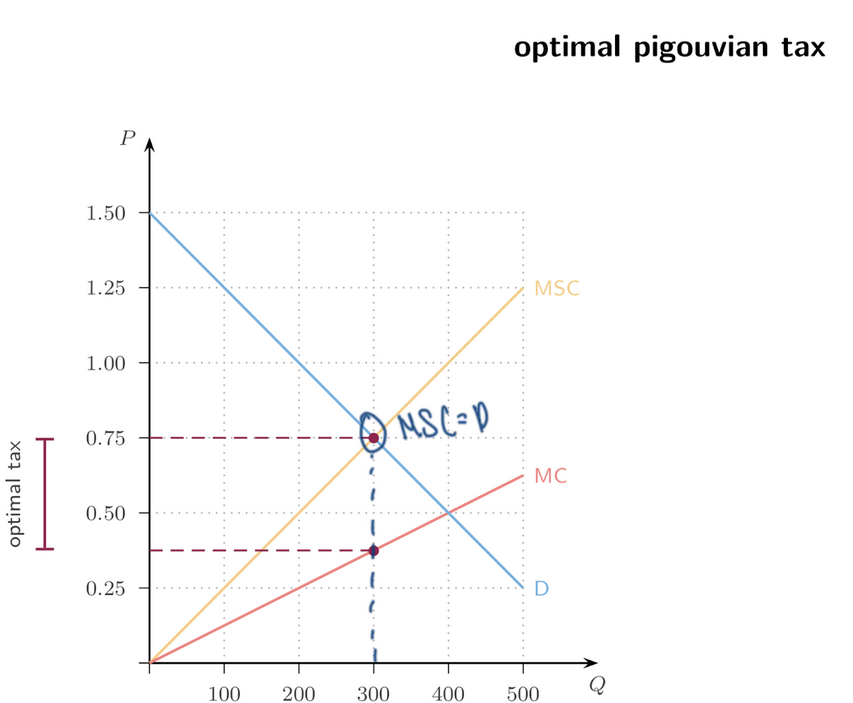
Graph: Optimal Pigouvian Tax (Slide 34)
Curves:
MC = private supply
MSC = MC + __
Demand
The tax vertically shifts supply upward until: New supply intersects demand at the efficient quantity
tax

Graph: Efficiency Restored (Slide 35)
New supply = supply + tax
Intersection with __ = efficient Q
No deadweight loss → maximized total surplus
demand
10. Are Carbon Taxes Good? (Slide 36)
Benefits
Increase ___
Increase efficiency
Reduce pollution
Political skepticism
People perceive it as a “cash grab”
Public concern: ___
Despite rebates where 70–90% of households get back more than they pay.
Economist consensus
Large majority support carbon pricing:
Canadian open letter
American open letter
Global expert surveys
revenue, inflation
11. Producing Knowledge (Slides 37–39)
Knowledge production has positive externalities, so markets underproduce it.
Policies to promote knowledge:
1. Public __
Public universities (including Western University)
Western’s revenue:
54% tuition
33% government
13% other sources
provision
11. Producing Knowledge (Slides 37–39)
Knowledge production has positive externalities, so markets underproduce it.
Policies to promote knowledge:
2. Subsidies / Vouchers
Work like negative Pigouvian taxes
Reduce the price to consumers
Vouchers = more consumer ___
Provinces offering vouchers: AB, QC, MB, SK (some extent)
choice
11. Producing Knowledge (Slides 37–39)
Knowledge production has positive externalities, so markets underproduce it.
Policies to promote knowledge:
3. Intellectual Property Rights
Patents
Copyrights
___
These give creators temporary ___ profits → incentive to __.
trademark, monopoly, innovate
12. Coase and Transaction Costs (Slides 40–42)
Coase (1988) Quote - Markets exist to reduce ___ costs.
Coase’s Theory of the Firm
Why do some transactions occur ___ firms instead of in markets?
Because of:
Search __
__ frictions
Incomplete contracts
Contract enforcement problems
Misaligned ___
Firms exist to reduce these costs.
transaction, inside, frictions, information, incentives
Property Rights & Externalities
Assigning property rights can ___ externalities.
Patent owners can license ___
River owner can sell pollution ___
Knowledge creators earn ___ profits
Effectiveness depends on:
__ costs
___ costs
Sometimes:
Private regulators work best
Sometimes government is needed
internalize, innovations, rights, monopoly, enforcement, transaction
13. Public Goods (Slides 44–46)
Rival vs Nonrival
Excludable vs Nonexcludable
Rival good - Consumption by one person reduces ___ for others.
Food
Fish in a river
Underground __
Nonrival good - One person’s consumption ___ reduce availability.
__
Streaming services
Pathways
availability, water, doesn’t, knowledge
Excludable good - ___ to prevent someone from using it (through ___ or access).
___
Concert ticket (ERA’s tour)
Nonexcludable good - Cannot prevent ___ from using it.
Public ___
Clean air
__
Law enforcement
Carbon capture
possible, price, house, nonpayers, parks, firefighters
Public Goods Grid (Slide 46)
Rival | Nonrival | |
Excludable | House, food | ERA’s Tour (___) |
Nonexcludable | Fish in rivers, water | Firefighters, law, carbon capture, pathway, social media |
Key idea: Public goods → nonrival + nonexcludable → free rider problem → underprovided by market.
concert
Externalities
MEC, MEB
MSC = MC + MEC
MSB = MB + MEB
Negative Externalities
___
price too low
DWL on __ side
overproduction, right
Positive Externalities
Underproduction
Price too low
DWL on ___ side
Pigouvian Tax
T = ___
Makes MC → MSC
Eliminates __
Cap-and-Trade
Fixed quantity
___ permits
Achieves efficient allocation
left, MEC, DWL, tradable
Public Goods
Nonrival + nonexcludable
Free rider problem
Underprovided by markets
__ Theory
Property rights internalize externalities
Works best when transaction costs low
coase