Unit 7 - Sampling Distributions
1/16
There's no tags or description
Looks like no tags are added yet.
Name | Mastery | Learn | Test | Matching | Spaced | Call with Kai |
|---|
No analytics yet
Send a link to your students to track their progress
17 Terms
parameter
# that describes some characteristic of the population
statistic
# that describes some characteristic of a sample (taken from a sample)
symbols for statistics (proportion, mean, SD)
p̂, x̄, s
symbol for parameters (proportion, mean, SD)
p, μ, σ
!!! sampling variability: the value of a statistic varies in a repeated random sampling
Population must be 10x larger or more than sample (10% Condition)
NEVER ASSUME NORMALITY -> always check 10% (can find SD) and large counts condition (can use approx. Normal distribution and find probability) for sample proportion/sample mean (LCC is np ≥ 10 and n(1-p) ≥ 10 for sample proportion; n ≥ 30 for sample mean)
Interpret answer by using context
usually give statistic + sample, look at bigger picture to find parameter + population
p̂ = X/n (sample proportion = count of successes in sample over sample size) (proportion is the proportion of successes out of a sample. Think fraction or decimal)
statistic likely to be off from parameter if n is low/small
sampling distribution
the distribution of values of a statistic of all possible samples of the same size from the same pop.
^difficult to do, so a simulation is appropriate ex: 30 samples of size n
^each point is a statistic collected from a sample of the same size. take statistic from EACH SAMPLE for many many samples. shows all possible values that the statistic can take and how often it occurs / take data from sample of size n from population many many times. plot each statistic from each sample
population distribution
gives the values (data points) of the variable for all the individuals in the pop. (data/numbers of population)
^ex: every U.S. income; the U.S. Census (info abt every citizen)
distribution of sample data
shows the values of the variable for all the individuals in the sample (data/numbers from sample)
^ex: the incomes from the sample of 200 Americans
unbiased estimator
a statistic used to estimate a parameter
-IF the mean of its sampling distribution equals the true value of the parameter being estimated (ex: sample mean, sample proportion, SD; NOT median) (aka if in many samples, the values of the statistic are centered at the value of the parameter)
-ex: can use x̄ if the expected value of the sampling distribution (mean of many means of many samples) equals μ
variability of a statistic
described by the spread of its sampling distribution
^incr sample size -> more data/info abt population -> less variability/spread of the distribution of the sample statistic (+more precise estimates)
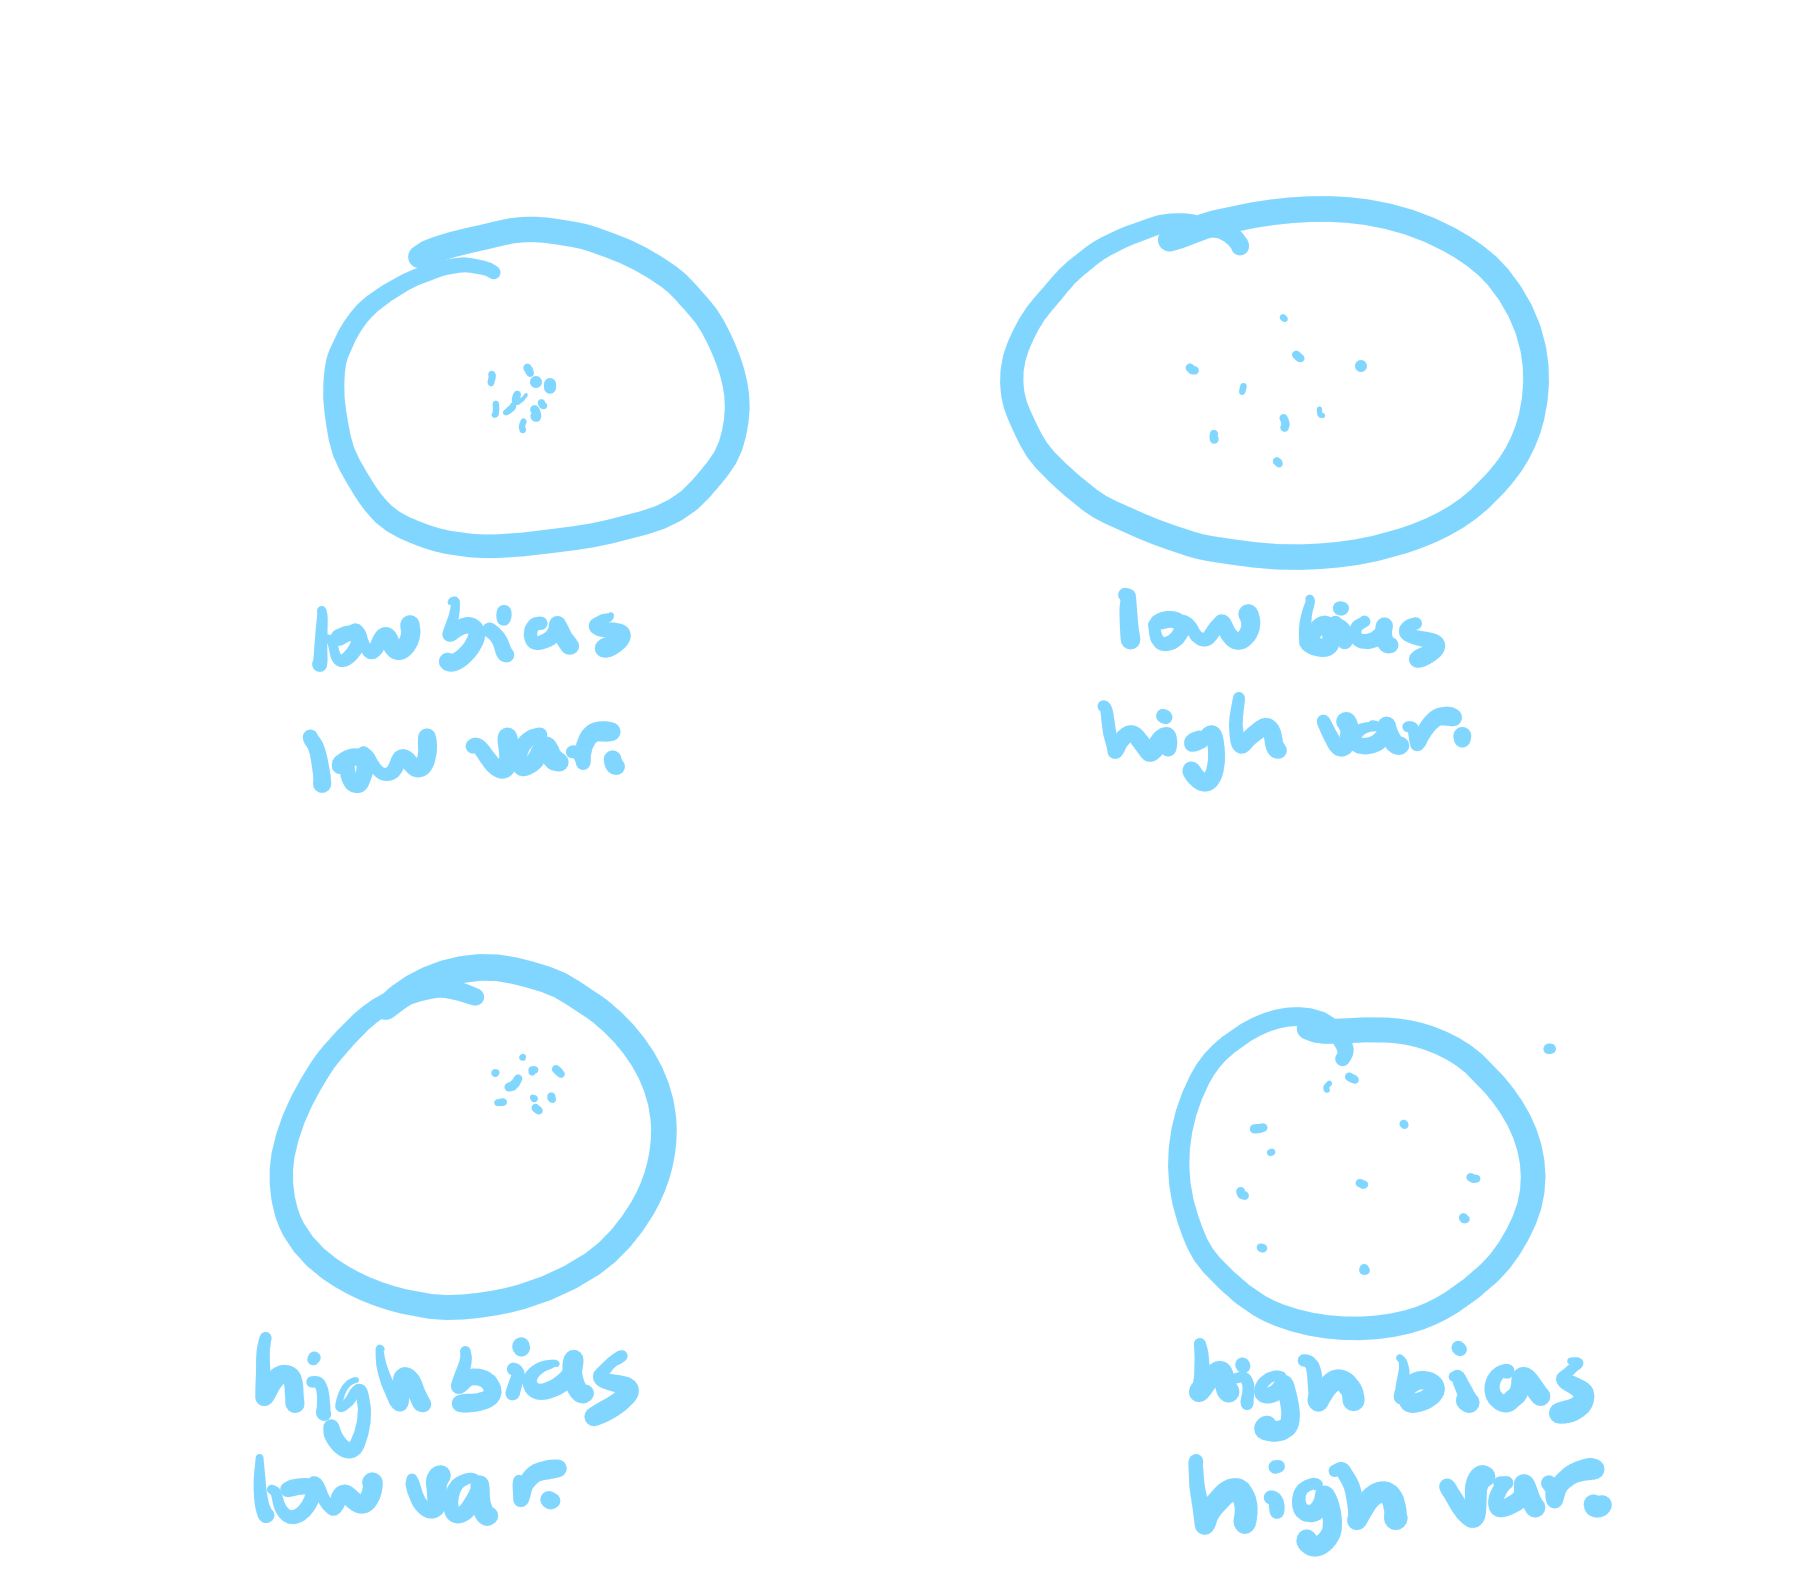
bias
variability
aim is off consistently
how scattered/close it is (similar results or not?)
!best estimate → want low/no bias (close to actual parameter), low variability (data close tgt & less spread out)!
about sample proportion distributions
SHAPE: can be approx normal (depends on n sample size and p population proportion, large counts condition)
CENTER: μp̂ = p (b/c p̂ is an unbiased estimator of p)
SPREAD: incr n (sample size), decr σp̂ (sample spread) (σp̂ depends on n and p)
*n changes, variability changes (don’t look at N)
Sampling distribution of a sample proportion (choose SRS of size n from population size N w/ proportion p of success, let p̂ be the sample proportion of successes)
μp̂ = p
10% condition before find SD → n ≤ 1/10*N (use words if given n but not N (can assume N is large))
σp̂ = √ [p(1-p)/n]
check large counts condition: np ≥ 10 and n(1-p) ≥ 10 → then can find probability and use normal curve shape
*state the # of ppl needed to assume the SD
^as n incr, sampling distrib. becomes approx normal
as n changes, what happens to shape, center, and spread? (for sample proportion & sample mean)
shape approx same (normal) (decr n slightly less normal, incr n appears to look more normal)
same center
SD changes
incr n, decr SD
decr n, incr SD
if change n by a factor of k (from OG to final size n), then SD changes by a factor of √(1/k)
!!! ask for parameters/statistics -> make sure to give #s and use symbols! ^parameter from population, statistics from sample
avoid absolutes (prob wrong if says 'exactly Normal')
good estimator → see if sampling distrib. mean of the statistic matches parameter (ex: sampling distrib. mean of mean temperatures matches parameter mean temp.)
^what is it centered around?
^find mean by adding all values (ticks, make sure to include if multiple of the same #) then dividing by the # of dots
^n is the sample size!!!
-
SAMPLING DISTRIB OF MEAN
-SD will decr if sample size incr
-SD is a measure of the variability of the sample mean among repeated samples
-sample mean is an unbiased estimator of the true population mean (also, sample proportion is unbiased estimator of the true population proportion)
-sampling distribution show how the sample mean will vary in repeated samples
Sampling distribution of a sample mean (suppose x̄ is the mean of an SRS of size n drawn from a large population with mean μ and SD σ)
μx̄ = μ
10% condition before find SD → n ≤ 1/10*N (use words if given n but not N (can assume N is large)) (overlook independence violation)a
σx̄ = σ/√n
if shape of population distribution is normal, then shape of sampling distribution of x̄ is also normal (no matter the size of n) → can find probability
if shape of pop. distrib. is NOT normal, then shape of sampling distribution of x̄ is normal if n ≥ 30 → can find probability
central limit theorem
when n is large (n ≥ 30), sampling distribution of the sample mean x̄ is approx normal
^no matter the shape of the population distribution (even if shape is not normal!)
*incr n, incr shape look normal (think incr n, decr SD, data closer tgt and more centered)
*given population has a finite SD