Stats 200 midterm
1/53
There's no tags or description
Looks like no tags are added yet.
Name | Mastery | Learn | Test | Matching | Spaced |
|---|
No study sessions yet.
54 Terms
Categorical variable
represent types of data which may be divided into groups
Quantitative Variable
outcomes can be measured on a numerical scale
what can you use to show Categorical data
freqeuncy tables
contingency tables
marginal distributions
conditional distrbutions graphical displays
bar charts
pie charts
Frequency (relative) tables
displays all categories of a single categorical variable with associated (relative) frequences
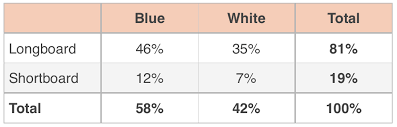
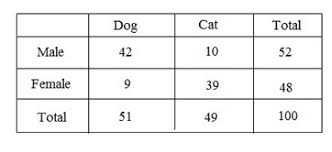
Contingency tables
Used to display the relationship between two categorical variables, showing the frequency counts for each combination of categories.
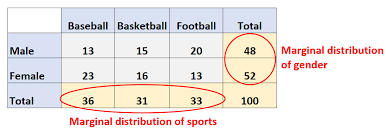
marginal distributions
displaying distribution of one of the two variables only
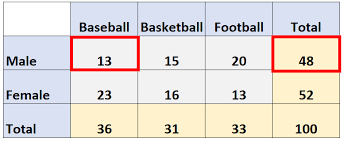
Conditional distributions
displaying distribution of one variable satisfying a condition of another variable
why can’t you compare counts on a table but instead %?
counts aren’t normalized but percentages are
bar charts
used to show categorical data
pie charts
used to show categorical data
is a good choice when you want to show that one variable is more or less frequent than the others
simpson’s paradox
a statistical phenomenon where a trend that appears in different groups of data disappears or even reverses when the groups are combined
what can you use to show Quantitative data
graphical displays
histograms
stem and lead displays
boxplots
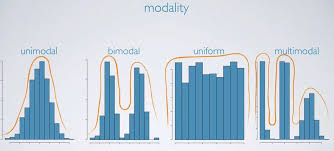
modality of histrograms
number of peaks:
unimodel
bimodel
multimodel
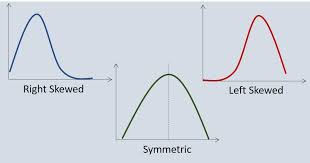
Symmetry of histograms
symmteric
skewed to the right (with a long right tail)
skewed to the left (with long left tail)
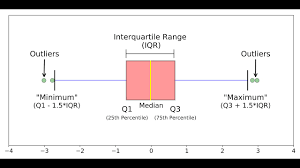
boxplot parts
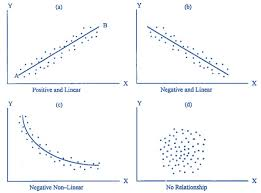
scatterplots
helps visualize possible relationships between 2 quantitative variables
Types of scatterplots:
Direction:
Positive
Negative
Form:
Linear
Non-linear
How scattered are the points?
Strong
Weak or no relationships (when data is randomly scattered)
Outliers?
What is ploted on x and y axis of scatter plot
Explanatory variable should be plotted on the x-axis
Response variable should be plotted on the y-axis
Correlation and types
The degree of linear association between 2 quantitative variables
Positive correlation:
Large values of x’s are linearly associated with large values of y
Negative correlation:
Large values of x are linearly associated with small values of y
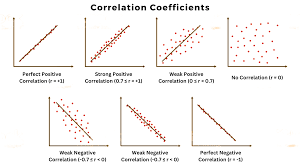
Correlation coefficient (r ):
A measure of strength of a linear association between 2 quantitative variables
Properties of the Correlation coefficient r:
If the two variables are positively correlated, r will be positive
If the two variables are negatively correlated r will be negative
R has a alue between -1 and 1 inclusive; and have no units
R = -1 for perfect negative correlation
r= +1 for perfect positive correlation
R close to 0 implies a weak or no linear relationship between the 2 variables
As the degree of positive correlation increases, r becomes closer to 1
As degree of negative correlation decreases, r becomes closer to -1.
Swapping x and y variables does not affect the value of r
The value of r does not change if all values of either variable are added a constant or multiplied by a positive constant
R is sensitive to outliers, so it may not be a reliable measure of strength of a linear relationship when there are outliersIf the two variables are positively correlated, r will be positive
Lurking variable
a third variable that associates with both x and y
Regression line
the relationship between two variables x and y
The line will pass through the mean-mean point
Residuals
is defined as the difference between the observed value y and the predicted value y hat.
The sum of residuals is equal to zero
The linear model, also called the least squares regression line, is obtained by minimising the sum of the squared residuals
Residual plot
plots the residuals against the data of the explanatory variable, if the model is appropriate, the residual plot should show no pattern.
Always keep outliers unless
1. Entries errors
2. Don’t fit the population you are looking at
Influential points
data points that greatly change the regression model, so they are removed.
Extrapolation
refers to the prediction about a response variable y for values of an explanatory variable x that lies outside the observed range, once you leave the range the relationship you observed may not hold anymore so the data may not be accurate, so DO NOT EXTRAPOLATE
Population
the complete collection of individuals under a study
Census
provides a means to obtain complete and accurate information about a population interest → sometimes is impossible because your population is too big, so a sample is taken instead
Sample
a subset of individual selected from a population, can provide relabile information about the population but it will be biased.
Bias
means that is has errors since the sample isn’t represented well.
Parameter
refers to a numerical summary of a population.
Statistic
amount/number you get from a sample.
Things that matter when making a sample
Randomization
Usually gives samples that have similar characteristics to a population
Sample size
A large size is better but the sample should also be representative else it is a bad sample no matter what
Sampling Frame
the list of individuals from which the sample is drawn. One must define clearly what or who the population is to include.
Sampling variability
the difference in characteristics from sample to sample
sampling methods
Simple random sampling (SRS)
N individuals sampled at random from a population
Each individual has an equal chance of being picked
Has a lot of variability
Stratified sampling
First the population is divided into a strata, then a simple random sample is drawn within each strata
Has smaller variability, so the results are more reliable
Makes sure each group is proportionally represented.
Proportional allocation: the size of SRS is proportional to the size of the stratum in the population.
Clutter sampling
Divides the population into different clusters and a simple random samples from certain clusters
Used for convenience, practicality, and cost-efficiency
Multistage sampling
Involves one or more stages of sampling procedure to get a sample
Ex. 2 stage cluster sampling
Systematic sampling
Selects every kth individual from a sampling frame
Should not contain any hidden order
Biases in sampling
Undercoverage
When a sampling procedure completely excludes or underrepresents a certain kind of individual from the population.
Convenience sampling
Uses a convenient way of sampling for you to get a sample but its not a good sample.
Voluntary response bias
If the participation is voluntary, then the individuals who respond usually have stronger opinions than those who do not.
Nonresponse bias
People who don’t respond to a survey may have different opinions than those who do.
Ex. those who work during the day may not be able to answer a phone call survey.
Response bias
A subject’s response is influenced by how a question or phrase is asked.
Observational study
two variables whole association is to be examined; has not deliberate human intervention
Control group
baseline group for comparison
Retrospective study
data that we are collecting has already happened
Prospective study
collecting data over a period of time while classes are on going
experiment different from observational study, since there is planned intervention (the researcher can manipulate the variables)
Confounding variable
One variable doesn’t cause the other, but is known
Random treatment assignment
a study subject tends to balance the different treatment groups with respect to all variables expect the condition of exposure
Factor
the effect of an explanatory variable
Levels of a factor
refers to a particular value or category of the factor.
Principles of experimental design
Randomize:
Helps ‘average out’ the effects of extraneous variables that may be present
Experimental units are not always selected at random which may be a limitation
Replicate:
The comparison between different treatment groups will not be reliable unless we look at moe individuals receiving each treatment
One replicate may happen in another setting with a different group of individuals
Blocking
Controlling variables that are not factors but can effect the results
Ex. blocking an experiment by dividing individuals by male and female
Gender is the blocking variable