Geography - Hydrological Cycle
1/149
Earn XP
Description and Tags
Pearson Edexcel Geography A-Level Water Cycle
Name | Mastery | Learn | Test | Matching | Spaced | Call with Kai |
|---|
No analytics yet
Send a link to your students to track their progress
150 Terms
distribution of Earth’s water (x4)
3% = freshwater (97% saline)
70% of freshwater is locked up in the cryosphere
0.3% of surface water
87% of surface water is lakes
fluxe amount of oceans → atmosphere
evaporation = 400,000km3
precipitation = 370,000km3
fluxe amount of land masses → atmosphere
evaporation = 60,000km3
precipitation = 90,000km3
fluxe amount of land masses → oceans
run-off = 30,000km3
aquifer
a rock unit that stores water
why is water demand increasing (x2)
growing population (sixfold in last century)
rising living standards as use 2x more water than someone 100 years ago
hydrological cycle
how water is exchanged through Earth’s land, ocean and atmosphere
why is the hydrological cycle a closed system
water is transferred instead of being gained or lost
condensation
a change in physical state from an atmospheric gas to a liquid (water vapour) due to cooling
dew point
the point at which air temperature drops allowing condensation (moves up and down)
sublimation
the process by which a solid transforms into a gas without passing through the liquid phase
surface runoff
water moving across the surface of the ground when
rain cant soak quickly enough into the ground
very heavy rainfall
soil is saturated so infiltration cannot occur
percolation
water entering deeper layers of soil and rock (bedrock) from surface layers
water table
the physical boundary signifying ground water (moves up and down)
cryosphere
all the global frozen water in ice, snow and permafrost
through flow
water moving downhill through the soil layers (generally very slow)
infiltration
the transfer of water from the land surface into the soil due to gravity
interception
precipitation that is caught and stored by the leaves of vegetation, stopping it from reaching the ground
groundwater
underground water in soil and rocks
surface water
water on the surface of the ground
stem flow
directs precipitation down off of branches and stems
evapotranspiration
water reaches the atmosphere by liquid surface water changing state into vapour and plants losing water from their stomata
evaporation
water changing from liquid to gas
surface storage
total volume of water held on the Earth’s surface in lakes etc.
uptake from roots
water entering trees etc. from the water table
precipitation
water deposited on the ground as a liquid or solid e.g. rain, hail, snow, fog etc.
residence time
the amount of water in a reservoir divided by either the rate of addition of water to the reservoir or the rate of loss from it (oceans = 000s of years vs water vapour = 10 days)
reservoirs
places where water is “stored” or where it stays for some period of time e.g. oceans, glaciers etc.
non-renewable stores
areas that are not getting replenished by the water cycle
fossil water
water that has been contained in some undisturbed space, usually groundwater in an aquifer that is non-renewable
inaccessible water
e.g. Antarctica (glaciers, ice caps etc.) and deep underground water
convectional rainfall process (x4)
the sun heats up the ground due to insulation, warming soil moisture
the ground heats the air above that has water vapour
warmer air rises
the air reaches the dew point and so the moisture in the air cools and condenses, forming cumulonimbus clouds
relief rainfall process (x6)
warm, moist air travels towards the obstacle/mountain
it is forced to rise due to the obstacle blocking its path
forced to cool and condense as it rises (meets the dew point)
precipitation occurs due to condensation on west side
heavy air is forced over the obstacle so begins descending, heats up as close to the ground so high pressure
produces a rain shadow region as warm air can’t rise up due to dense, cool air sinking over obstacle
frontal rainfall process (x3)
warm air is a lighter air mass than dense, dry and cold air
the warm air is forced to rise over the cool air (air masses don’t mix)
the warm air cools and condenses leading to precipitation on the front
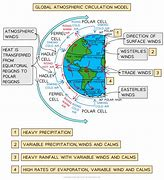
global circulation model
drainage basin
any area of land that collects precipitation into a common outlet e.g. river (all precipitation that falls within the watershed will drain downslope due to gravity)
climate impacting hydrological cycle (x3)
INPUTS → high evaporation with warmer temperatures = air rises = more rain + higher convectional rain as sun heats the ground
FLOWS → soil moisture evaporated into atmospheric moisture when sunny, higher temps reduce infiltration and more precipitation = more runoff
OUTPUTS → high temps mean high evaporation + transpiration → cold air sinking = no evaporation
soil impacting hydrological cycle (x3)
INPUTS → peaty + sandy soil = warms up quicker so higher convectional rainfall and high retention of moisture
FLOWS → peaty = high moisture so more flows vs clay = less percolation and flows when dry as hard rock so higher surface runoff
OUTPUTS → peaty + sandy = high evaporation as warms quickly
vegetation impacting hydrological cycle (x3)
INPUTS → high precipitation when high vegetation due to higher evapotranspiration
FLOWS → high stem flow + interception due to high vegetation, less flows in winter + less surface runoff as more obstacles
OUTPUTS → higher evapotranspiration
geology impacting hydrological cycle (x2)
FLOWS → porous rock = permeable so higher infiltration and less surface run-off
OUTPUTS → less resistant rocks widen channel so more channel flow etc.
relief affecting hydrological cycle (x3)
INPUTS → upland areas = higher levels of relief rainfall and more condensation
FLOWS → steeper = higher surface run-off due to gravity + less time for infiltration etc.
OUTPUTS → less evaporation and evapotranspiration when steep as no vegetation + precipitation flows too quickly
urbanisation impacting the water cycle (x4)
¼ all places that experience flooding are in settlements
crazy paving = turning front gardens into car parking spaces (car ownership increasing) as over 1 million gardens converted in London alone (22x Hyde Park)
WHY? avoidance of public transport, lack of on-street parking (e.g. Chelsea = 40,000 permit holders but 27,000 spaces), convenience of low-maintenance gardens, fashion + increasing house values
impermeable surfaces = faster flows
deforestation impacting the water cycle (x5)
England deforests more trees than it plants
higher tree + vegetation cover = higher evapotranspiration and higher interception
soil layer reduced by erosion so holds less water
grazing animals compact soil so doesn’t infiltrate
precipitation flows faster as can’t infiltrate
land-use change affecting the water cycle (x2)
approximately 35% of the world’s wetlands were lost between 1970-2015 and the loss rate is accelerating annually
huge quantities of water are using in food production which redistributes water away from natural pathways
reservoirs affecting the hydrological cycle (x4)
close to 5000km3 of water - nearly 12% of the total annual river runoff are presently stored in large reservoirs
between 9-12% of the earth’s land area is presently cultivated and around 17% of this farmland is irrigated
nearly 7% of the global annual river runoff is evaporated from both irrigated fields and reservoirs each year
stores water where it is not naturally kept, disrupting natural flows
over-abstraction of groundwater affecting the hydrological cycle (x3)
54% of India’s groundwater wells are decreasing (taking out too much water too often)
can cause sinking ground e.g. Mexico City as layers in the ground compact, causing layers above to collapse
salt water intrusion = in order to balance out seawater and groundwater, salt water comes inland in areas where there is too little groundwater e.g. South Florida
soil moisture budgets
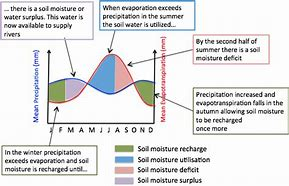
soil moisture surplus
precipitation > potential evapotranspiration so soil water store is full which gives a surplus of soil moisture for plant use and run-off into streams
soil moisture use
potential evapotranspiration > precipitation so plants must rely on stored water which is gradually used up
soil moisture deficiency
plants must have adaptations to survive for long periods or land must be irrigated
soil moisture recharge
precipitation > potential evapotranspiration so the soil water store starts to be recharged (filled up)
field capacity is reached = soil water store is full
river regimes
show annual variations in discharge
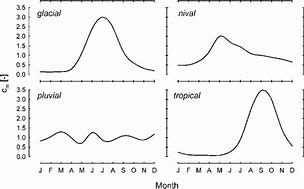
Why do river regimes change? (x5)
size of river (number of confluences)
climate (high pressure areas = lower precipitation and higher evapotranspiration)
nearby features e.g. glaciers = high discharge in summer months due to increased meltwater
dams
altitude
perennial rivers
rivers that flow all year round
seasonal rivers
rivers that dry up during the dry seasons
ephemeral rivers
rivers that only flow during a short period of time when there is rain e.g. deserts
storm hydrographs
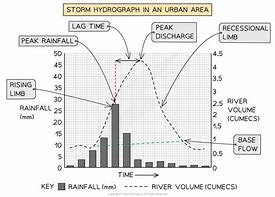
river discharge
the amount of water in the river passing any given point at any given time
lag time
the interval between peak rainfall and peak discharge (due to most rain falling on valley sides so takes time to reach the river)
base flow
the normal river flow
peak discharge
the highest river level after a storm
peak rainfall
the highest amount of rainfall
physical factors affecting hydrographs (x10)
size of catchment
shape (circular = concentrate water quicker)
drainage density
rock permeability
soil
relief e.g. 2004 Boscastle flood = very steep topography
vegetation
weather (intense storms etc.)
seasons
tides
human factors affecting hydrographs (x3)
land-use e.g. deforestation (densely packed crops = higher interception, reduced vegetation reduces interception + ploughing increases runoff)
urbanisation
water management e.g. dams/reservoirs to regulate flow
antecedent conditions
conditions before a hazard that influence the onset and magnitude of a hazard and its consequences e.g. basin already saturated from previous rain means water table is high so low infiltration
drought
abnormally low precipitation for an extended period of time (weeks, months or years)
meteorological drought
when the amount of precipitation received in a specific area is less than the average
hydrological drought
when reduced precipitation impacts water supply e.g. lower streamflow, soil moisture, groundwater and lake levels
agricultural drought
when the meteorological and hydrological droughts impact agricultural activities e.g. low soil moisture for irrigation
normal conditions of ENSO
trade winds blow in a westerly direction, pushing warm surface water toward the western Pacific (near Asia + Australia) causing colder, nutrient-rich water to rise to the top of the ocean near the coast of South America
El Nino (x4)
trade winds weaken and reverse
warm surface currents reverse
less cold water upwells on the coast of South America
= drought in Australia + SE Asia with heavy rainfall and flooding in South America
La Nina (x
stronger trade winds push warm water even further west
cold water dominates the Eastern and central Pacific with more upwells of of South America
= flooding in SE Asia and Australia and drought in South America
general impacts of ENSO cycles (x5)
impacts fishing industry as fish migrate to cold, nutrient-rich waters + a decline in plankton in El Nino conditions (so decreased marine life as feed off of this)
vast impacts on agriculture as drought on one side limits food growth
risk of forest fires
coral bleaching in El Nino due to warmer waters
changes in climate increase spread of diseases such as malaria in tropical regions where wetter conditions provide breeding grounds for mosquitoes
over-extraction of surface water and groundwater aquifers causing drought (x5)
exacerbates drought conditions due to depleting water resources
surface water → less available for drinking/agriculture and no water to fill → impacts aquatic ecosystems
groundwater → use of infrastructure tp access water from water table (high cost) and recharge very slow or FOSSIL WATER
may cause salt-water intrusion → degrading water quality further
desertification causing drought (x4)
exacerbates severity and duration of drought + increasing vulnerability of area to future droughts
caused by high levels of soil erosion from overgrazing/over-cultivation + deforestation as land cannot absorb and store water effectively
slow groundwater recharge
drought accelerates desertification whilst desertification worsens drought conditions (loss of vegetation etc.)
urbanisation causing drought
links to land-use changes as rapid growth of cities and urban areas equal a higher demand for water, meaning the same volume is less likely to meet the needs of all players
climate change causing drought
natural process exacerbated by anthropogenic actions (e.g. air pollution from fossil duels changing atmospheric circulation)
global warming increases both severity and frequency of drought (influencing the resilience of ecosystems)
Australian case study of drought in the Murray-Darling basin (x5)
‘Big Dry’ of 2006 affecting more than half the farmlands in this agricultural heartland (producing 50% of exports including food, wool, wheat + meat)
reservoirs fell to around 40% capacity, severely impacting Adelaide as extract 40% drinking water from River Murray (no longer reaches the mouth)
Warragamba dam provides water for Sydney and its disrupted natural water flows due to high demand
70% land arid or semi-arid due to unsustainable agriculture
2018-19 = 1.8 million hectares of vegetation removed
Sahelian drought case study in Sahel regions of Africa (x4)
drought sensitive as occupies a transitional climate zone (85% rainfall in summer)
660,000km3 in groundwater reserves but over-extracted leading to depleting sedimentary aquifers and degradation by salt-water intrusion
future predicts more irregular and unpredictable rainfall
4000-5000km3 deforested per year for fuel wood (used by 80% population for cooking, heating and building) or overgrazing by nomadic tribes (increase animals up to 40%)
impacts of drought on forest ecosystems (x5)
SW America droughts between 2000 - 2010s caused significant die-off (up to 90%) of Pinan pines due to being more susceptible to pine bark beetle attacks
stunted growth/die-back impacts resilience e.g. rainforests generate 70% of their own rainfall so prolonged periods impact amount of rainfall
ecosystem shift → savannah (incredibly difficult to reverse + changing biodiversity)
arid forests may have adapted to drier conditions e.g. oak species in Australia + California have deep-root systems and drought-tolerant leaves
invasive species e.g. Kudzu in SW USA (outcompete native vegetation)
impact of drought on wetland ecosystems (x4)
more dependent upon a consistent water table in terms of wildlife and vegetation
impacts on food chain/cycle
areas of open water dry up so wetland loss
oxidisation of organic soils release carbon into the atmosphere
Ovakango basin case study (wetland ecosystem) (x7)
in Botswana + 2019-2020 drought
water supply from seasonal rainfall in highlands of Angola which is channeled to delta
some species of bird forced to either delay, shorten or change their traditional migration routes for more suitable habitats
loss of aquatic and semi-aquatic animals e.g. waterfowl + fish
invasive species e.g. water hyacinth covers over 100km2, crowding out native plants
risk of wildfires e.g. 2020 = 2 million hectares of land
seasonal river regimes exacerbated by climate change as reduced time between unpredictable rainfall events allowing less time for the ecosystem to recover
human impacts of drought (x3)
agricultural industry uses 70% of global water so deficits have significant impacts as decreases volume of food grown and number of animals
largely LICs and NEEs that rely on the industry meaning these nations are impacted more than HICs that rely on tertiary and quaternary sectors
LICs less likely to have high-tech areas that use irrigation systems, relying on rain-fed farming so HICs may be able to survive drought better
meteorological causes of flooding (x4)
prolonged low pressure systems causing intense storms, flash flooding and monsoons (months worth of rain within days) e.g. Asian monsoon rainfall
inter-tropical convergence zone = belt of converging trade winds and rising air = low pressure as sun is over top so heavy rainfall and thunderstorms
latent-heat transfer = heats surrounding particles into water vapour which then rise and cause the cycle of storms
E.G. Bangladesh = multiple of large rivers (Ganges, Parma and Meghna) which flood due to snowmelt from Himalayas and summer monsoon season
how does urbanisation increase flood risk
impermeable areas of tarmac (crazy paving) + irrigation of agriculture = saturated land - low infiltration and shorter lag times
how does deforestation increase flood risk
low interception and worse soil structure meaning lag times is decreased e.g. Boscastle - vegetation was removed through selective logging for agriculture which was attributed to severe flooding in 2004
how does ploughing soil + grazing animals compact the soil
lower interception and infiltration rates
how does river mismanagement increase flood risk (x3)
channelisation = human process of straightening and deepening rivers with the primary focus of making the river less likely to flood → displaces river downstream so different locations overwhelmed by higher discharge e.g. Mississippi River = prevent flooding in New Orleans but downstream levees failed due to increased discharge
dams = construction of large infrastructure that control the water passing through it → blocks the flow f sediment down a river so reservoir gradually fills up with silt
river embankments = can fail when a flood exceeds their capacity and so scale of flooding is much greater
causes of Storm Desmond (x3)
series of storm events that created intense heavy rainfall and widespread flooding
involved very low air pressure - 946 millibars with its fronts bringing exceptionally prolonged and heavy rainfall as air was forced to rise across the high ground of the Lake District
antecedent conditions of saturated ground combined with convectional and relief rainfall
environmental impacts of Storm Desmond (x7)
flood water up to 3ft meaning debris spread across roads, rivers and surface land
some sewage over spilled from overcapacity drains into the streets
petrol and oil from stranded cars washed into the streets
saturated soils led to decomposition of dead plants + animals giving off noxious gases whilst other poisons entered food chain
floods disrupted normal drainage
several landslides triggered
leaching of nutrients from soils
socio-economic impacts of Storm Desmond (x5)
19,000 homes flooded across N. England
2 fatalities with 60,000 power outages and 3000 families required emergency accommodation
£1.3 billion economic damage
significant flooding in Keswick, Carlisle, Lancaster + Appleby (£520-662 million estimated insurance flood lost)
hospitals forced to run off generators and routine appointments cancelled
how does climate change impact the hydrological cycle (x7)
Antarctica losing ice 6x faster than 25 years ago + 8% species at risk of extinction
risk of winter flooding in UK increased by 4 + ½x
risk of summer drought in UK increased by 3x
increase severity of weather events
larger change in precipitation intensity in Northern hemisphere with a 40% reduction in runoff around equator
sea level rise by between 0.4 and 1m by 2100
every 1 degree increase = 7% increase in moisture
how is California impacted by climate change (x4)
droughts are normal but in 2014, the Sierra Nevada region = 3x more normal number of wildfires due to extremely dry ground
predicted intense ‘mega-droughts’ and decade long dry periods (2015 marked the 4th year of continuous drought)
increasing temperatures reducing flows (e.g. 30m lower groundwater levels between 2011 and 2015) and reservoir levels (e.g. Lake Cachuma down at 9% capacity)
meltwater provides 1/3 of California’s water
how is the Sahel region impacted by climate change (x4)
‘re-greening’ = conversion of dry landscapes to productive farmland
‘Farmer-Managed Natural Regeneration’ = planting trees and bushes alongside land management schemes
natural regeneration of water (more retention), low cost reforesting, water-harvesting techniques used e.g. Burkina Faso’s farmers build stone lines or dig improved planting pits
since 1996, there have been several wet years in between droughts
water security
the capacity of a population to safeguard sustainable access to adequate quantities of acceptable quality water for sustaining livelihoods, human wellbeing and socio-economic development, for ensuring protection against water-borne pollution and water-related disasters
continentality
where rain is dropped closer to the coast as there is more evaporation from the sea, increasing air moisture e.g. East Coast of America receiving more rainfall than states further inland
physical factors affecting water insecurity (x7)
continentality
relief rainfall as areas on opposite side of mountainous regions receive much less precipitation
drainage density (larger = more secure)
geology and aquifers e.g. California Central Valley aquifer as a source
ocean currents as warmer = wetter as higher evaporation from the sea
ENSO cycles leading to unreliable patterns of rainfall
salt-water enroachment means contamination of viable freshwater
how does water quality affecting water insecurity (x3)
water quality e.g. China = 1/3 of all rivers, 75% of major lakes and 25% of coastal zones classified as highly polluted + eutrophication causing the ‘green revolution’ of algae growth
worldwide 137 million people in over 70 countries have some signs of arsenic poisoning from drinking water
poor quality = less water available to meet needs
how do dams affect water insecurity (x3)
stop animal migration (Yangtze River Dolphin extinct)
traps pollution as accumulation of sediment carrying pollutants
reduce flow downstream e.g. Give 3 dam reduced river flow to downstream e.g. Lake Turkana causing indigenous people to struggle on Omo River
how does over-extraction affect water insecurity (x2)
over-extraction reduces water available in stores, especially if not replenished e.g. Coca Cola caused water levels to drop by almost 10m over 5 years in Kaladera or Rajastan, India
causing Mexico City to sink due to liquefaction (as built on lake bed) since exacerbated by over-extraction