APES 3.1-3.5 quiz
1/50
Earn XP
Name | Mastery | Learn | Test | Matching | Spaced |
|---|
No study sessions yet.
51 Terms
live in a large range of conditions
niche generalists
live in a small range of conditions
niche specialists
niche generalists examples
raccoons, black bears
niche specialists examples
pandas, koalas
list the factors used to compare reproductive strategies
maturity time, gestation length, litter size, # of reproductive events, parental care, competition among offspring
k selected species have a ___ growth rate
low
k species populations are generally ______
consistent (low fluctuations, carrying capacity)
k-selected species— maturity
slow
k-selected species— gestation period
long
k-selected species— litter size
small
k-selected species— reproductive events
few
k-selected species— parental care
high
k-selected species— competition among offspring
less
what does the survivorship curve of a k-selected species population look like?
stays consistently high and then drops with old age (type 1)

examples of k-selected species
humans, elephants
r-selected species have a ___ growth rate
high
r-selected species often have …
big population booms and die offs
example of r-selected species
rabbits, cockroaches
most invasive species are __-selected species
R
survivorship curve, x axis=
age/time
survivorship curve, y axis=
# of survivors
what does the survivorship curve of an r-selected species population look like?
starts high with an immediate die off and then levels out at the end (type 3)
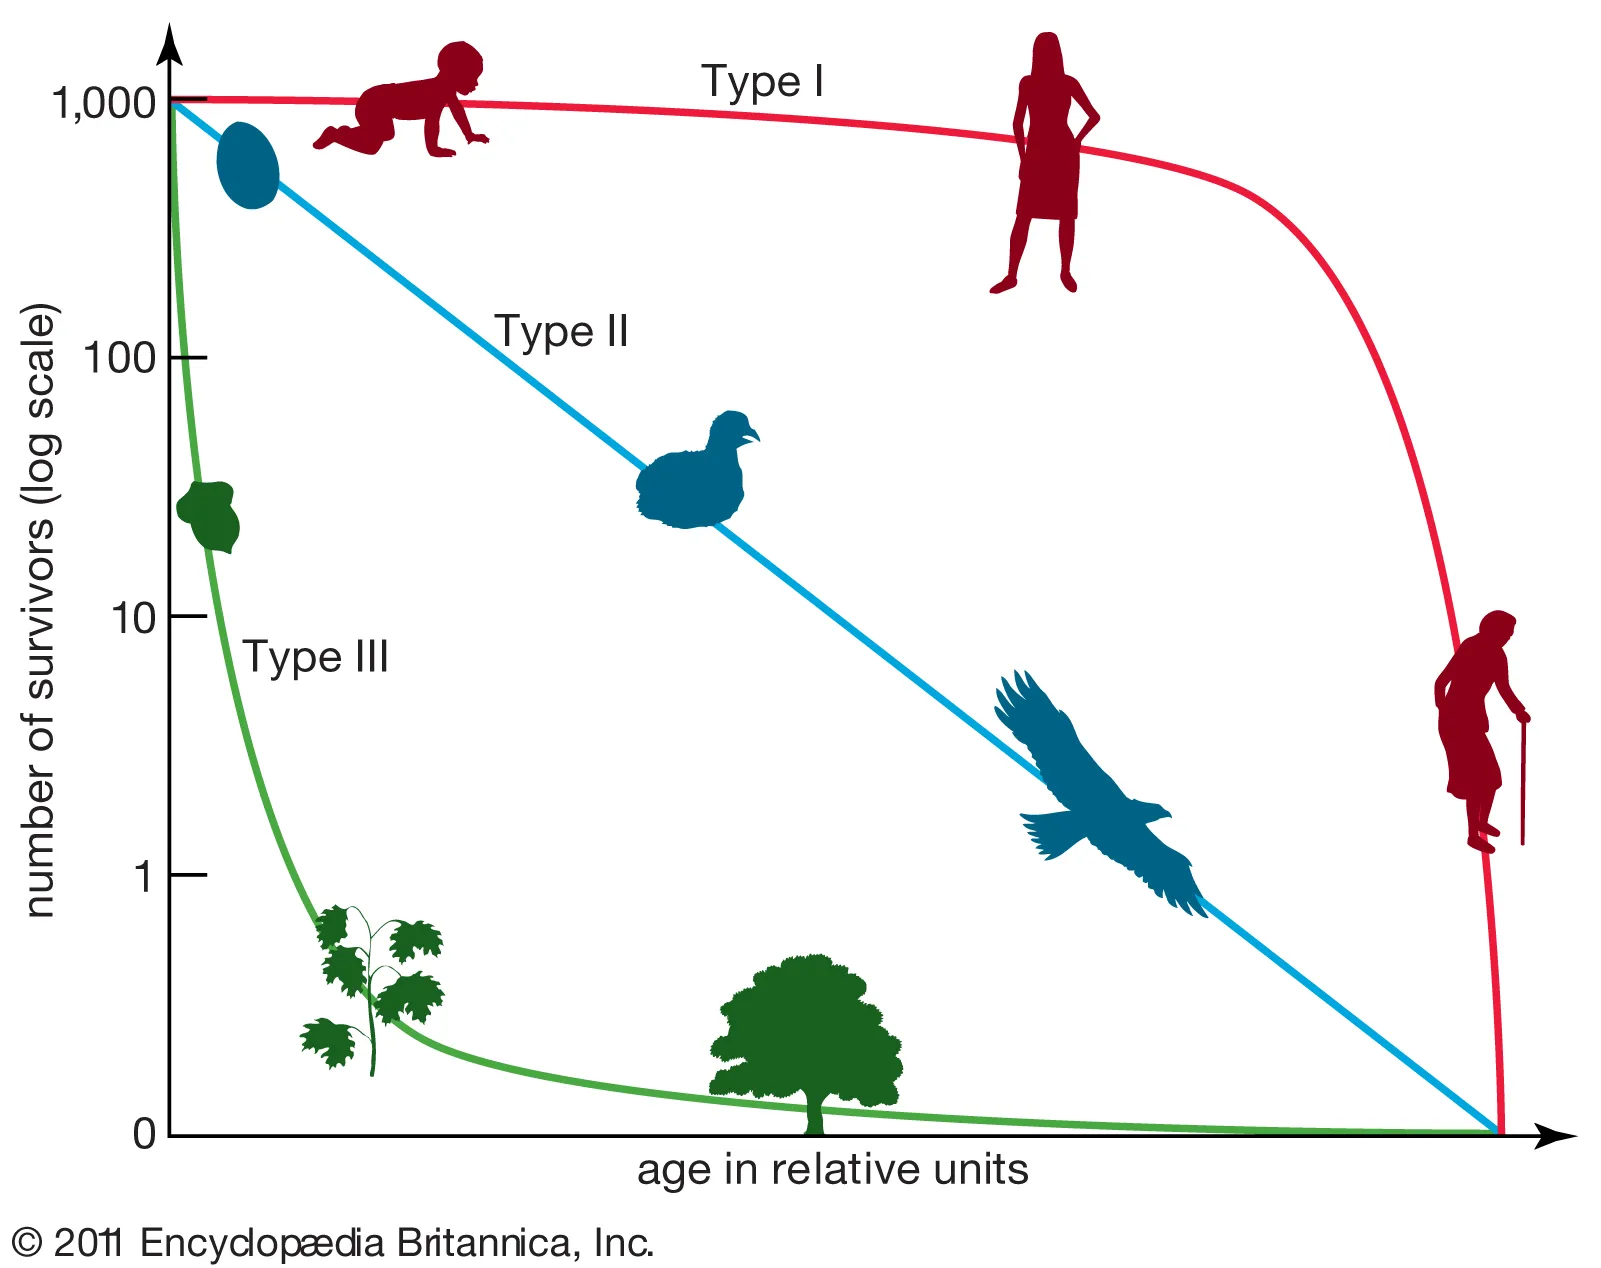
there are _ types of survivorship curves
3
survivorship curve— type 1
high survival rates, consistent, die off as they get old
(commonly k-selected species, humans, elephants)

survivorship curve— type 2
constant decline throughout their entire lives
(squirrels, corals)

survivorship curve— type 3
low survivorship at young age, few who reach adulthood live a while
(commonly r-selected species, mice, frogs)

limit to the # of organisms an environment can sustain
carrying capacity (k)
number of kids an animal can produce in a certain time period
minus
the deaths of the kids or the animal during that same time
population growth rate
the growth rate of a population under ideal conditions
intrinsic growth rate (r)
r-selected species experience extreme ___ ____ (_) when conditions are good
intrinsic growth (r)
factors that influence an individuals probability of survival/reproduction that depends on the population size
density-dependent factors
factors that influence an individuals probability of survival/reproduction regardless of the population size
density-independent factors
examples of density dependent factors
competition, disease
examples of density-independent factors
weather, human activities (deforestation, pollination)
which 2 models are used to predict population size
exponential and logistic
logistic and exponential models are examples of ___ ___ models
population growth
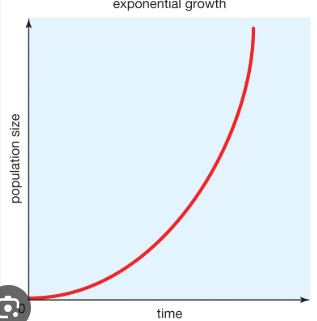
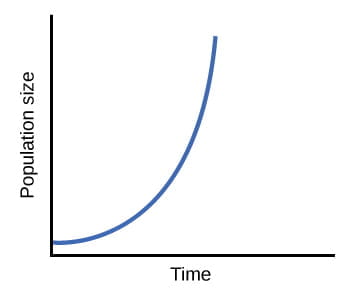
populations with rapid growth, not limited by resources
exponential growth model
exponential models create a ….
j shaped curve
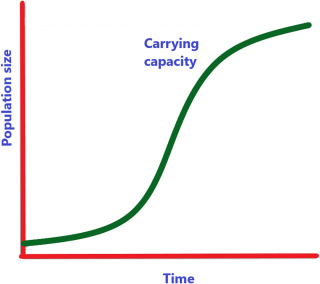
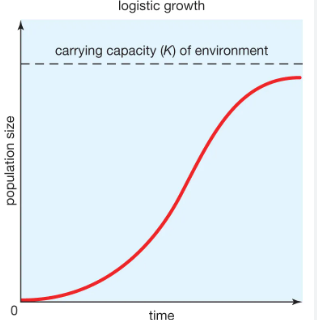
initial growth is rapid but slows as population reaches K (carrying capacity)
logistic growth model
logistic models create an …
s shaped curve
exponential models show
density-independent growth patterns
logistic models show
density-dependent growth patterns
something that a population cannot live without
limiting resource
total number of individuals in an area during a specific time
population size (N)
number of individuals per unit area
population density
how individuals are spaced within an area
population distribution
ratio between male and females
population sex ratio
how many individuals fit into specific age cohorts
population age structure
3 types of population distribution
random, uniform, clumped
growing populations tend to have ___ bases
wide
age group of females from 0-14 on a graph are known as ____ _____
pre-reproductive females