inferential stats tests
1/17
There's no tags or description
Looks like no tags are added yet.
Name | Mastery | Learn | Test | Matching | Spaced | Call with Kai |
|---|
No analytics yet
Send a link to your students to track their progress
18 Terms
descriptive statistics
techniques such as calculating percentages, graphs, measures of dispersion and central tendency
inferential statisitcs
techniques used to analyse a set of data to measure if there is significant difference or correlation between them
significance
the difference or correlation between 2 sets of data is greater than what could occur by chance i.e. its a meaningful result
3 criteria for selecting a statistical test
difference or correlation (what the hypothesis predicts)
is experimental design used related (repeated measures, matched pairs) or unrelated (independent groups)
level of measurement/ data collected (nominal, ordinal, interval)
criterial for choosing a stats test- hypothesis
H1 is the alternative hypothesis, reflects the researchers prediction
H0 is the null hypothesis, states there’s no effect or relationship between variables
H1 and H0 cant both be true, researchers make decisions on what must be retained and rejected using an inferential stats test
does the hypothesis predict difference or correlation/relationship, eg there will be a significant difference between IV and DV
criterial for choosing a stats test- related or unrelated
related designs- participants are the same or similar across conditions
unrelated designs- participants are different and not matched across conditions
levels of data- nominal data
each item can only appear in one category, there is no order
eg favourite colour
levels of data- ordinal data
data in the form of scores, collected on an ordered scale but intervals aren’t equal so a score of 8 isn’t 2x a score of 4, data lacks precision as its based on subjective opinion
eg rating something from 1 to 10
levels of data- interval data
data in the form of scores based on numerical scales with units of equal, precisely defined size
eg any public unit such as time, temperature or counting observations in observational studies, 8 tallies is 2x as many as 4
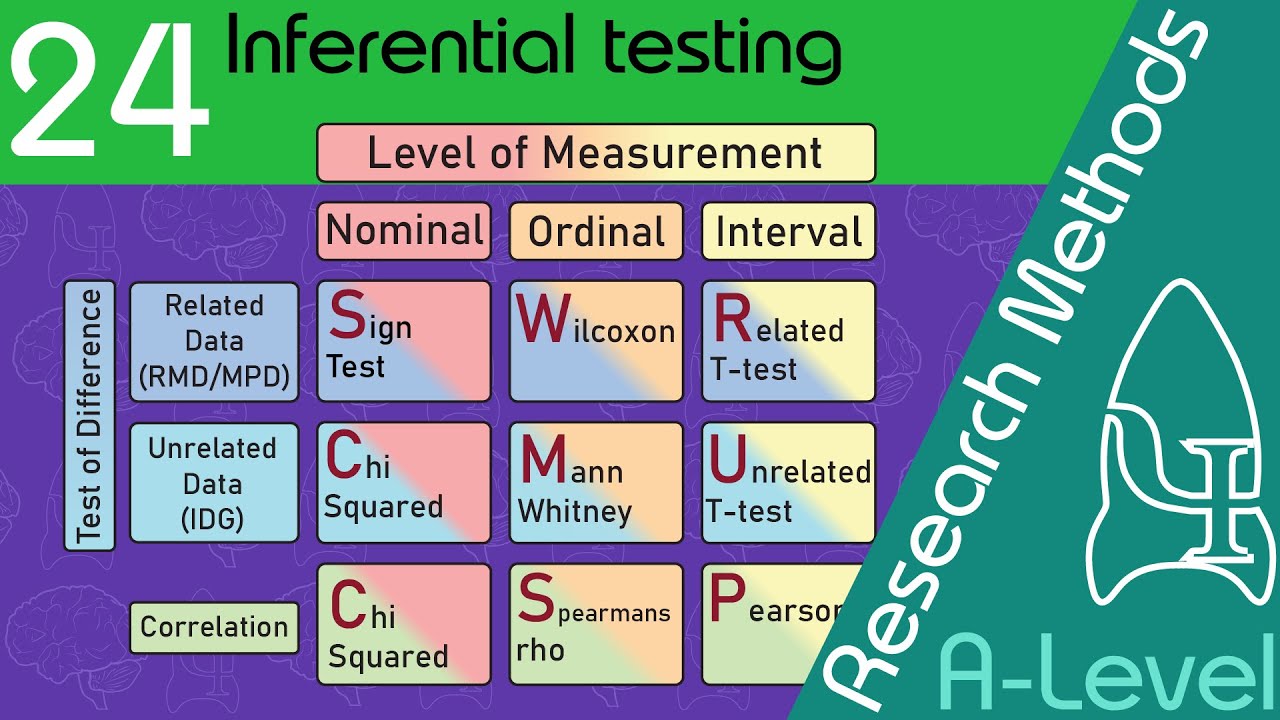
how are stats tests chosen?
use the 3 criteria and find the suitable test from the table
how to conduct the sign test
enter pairs of related data in a table
for each pair, the score from condition B is subtracted from condition A to produce the sign of difference- plus, minus, equal
participants who achieved the same in both are deducted from the N value
calculated value (S) is the total of less frequent sign
compare calculated value with critical value using the critical value table
if S is less than or equal to the critical value, then it is significant and the null hypothesis is rejected and the alternative hypothesis accepted
type I error (false positive)
the null hypothesis is rejected even though its actually true
concluding there is a significant difference or correlation when there actually isn’t, optimistic error
cause by using a significance level that is too lenient eg 0.5
type II error (false negative)
the null hypothesis is accepted when in reality the alternative hypothesis is ‘true’
concluding there is no significant difference or correlation when in reality there is one, pessimistic error
caused by using a significance level that is too stringent eg 0.0005
calculated values
a value achieved by carrying out an inferential stats test that represents data from an investigation
critical value
a value taken from a statistical table which, when compared with calculated value, tells us if results are significant
how is critical valued identified?
direction of the hypothesis- one tailed (directional) or two tailed (non directional)
amount of data collected- number of participants (N) or degrees of freedom (df), df always given
significance level chosen by the researcher- usually 0.05 or 5%, means there’s a 5% chance the results occurred even if there was no real difference in the population, very occasionally 0.01 or 1%
how do you check for statistical significance?
the calculated value is compared with the critical value in a table of critical values based on probabilities
based on the test the calculated value needs to be greater than or less than the critical value to achieve significant results, says at bottom of the table
relationship between significance and hypothesis
if the stats test is not significant, the null hypothesis is accepted
if the stats test is significant, the alternative hypothesis is accepted