PSY Tests & Measurements Exam 1
1/126
There's no tags or description
Looks like no tags are added yet.
Name | Mastery | Learn | Test | Matching | Spaced |
|---|
No study sessions yet.
127 Terms
What is a psychological test
a procedure or instrument that measures a construct or behavior to make interferences about human attributes, traits or characteristics
why might items on two IQ tests be quite different?
because the test developers defined IQ differently based on their varying theories of intelligence
what were the first published tests of mental ability?
the Binet-Simon scale
What is the Flynn Effect?
the trend that the average IQ score increases with each new generation
what do self report tests require test takers to do?
to report or describe their feelings, beliefs, opinions and/or mental states.
Key assumptions of Psychological Tests
An individual’s behavior and, therefor,e test scores will typically remain stable over time
Psychological tests measure what they say they measure
test takers will report accurately about themselves
Test items are understood the same way
what is not an assumption that test users make about psychological tests?
test scores are 99.9% accurate with little or no error
What is race norming?
ranking a minority test taker higher than a White test taker with the same test score
What type of tests are the Rorschach Inkblot Test and the Thematic Apperception Test?
Projective tests
Binet’s psychological tests were designed to evaluate
Children
What do all psychological tests have in common?
Using evidence to reach conclusions
Three defining characteristics of good tests
Representatively sample the behaviors thought to measure a construct
Behavior samples are obtained under standardized conditions (test must be administered the same way to all people)
Have rules for scoring to ensure consistency
Maximal Performance
classification of test by behavior
test takers perform well defined task (eg IQ, driving tests) and try to do their best
Behavior Observation
classification of test by behavior performed
involves observing people’s behavior in a particular context, often without them knowing
Self report
classification of test by behavior performed
test takers describe their own feelings, beliefs, or opinons
Standardized tests
classification of test by standardization
administered to a large group a standardization sample) to create norms for score comparison
specific directions for administration and scoring
Nonstandardized tests
classification of tests by standardization
more informal, often for single administration (i.e: do not have standardization sample)
Objective tests
classification of test by scoring method
have predetermined correct answers and require little subjective judgment to score.
structured formates like MC, T/F, or rating scales
Projective tests
classification of test by scoring method
test takers respond to ambiguous stimuli (i.e: Rorschach inkblots, Thematic Apperception Test)
scores involve subjective judgment
Achievement tests
by dimension measured
measures previous learning in a specific academic area
Aptitude tests
by dimension measured
assess potential for learning or ability to perform in a new situation
Intelligence tests
by dimension measured
assess the ability to cope with the environment at a broad level
Personality tests
classification of test by dimension measured
measures human character or disposition
Interest inventories
classified by dimension measured
assess interests to help with career decisions
Psychological assessment
broad process of gathering information about an individual using multiple methods, including interviews, observations, and psychological tests
one tool in this process: psychological test
Measurement
process of assigning numbers to attributes accroding to specific rules
broader concept than a test
Survey
focuses on group outcomes and reports results at the question level (such as percentages) P
Psychological test
focuses on individual outcomes and provides an overall derived score or scaled scores
What are some key historical developments of creating psychological test?
created to screen emotional instability during war
IQ test for children (Binet-Simon Scale)
developed Army Alpha (literate recruits) & Army Beta (non-literate/non-english speaking) during WWI
What are some major controversies of psychological tests during it’s development
discrimination against racial, economic or cultural groups
nature v.s nurture: IQ; be different tests because developers defined IQ differently based on theories
Within-group norming: race norming
Flynn Effect
Flynn Effect
observation that average IQ scores have been increasing with each new generation
due to changes in how new generations think (“mental artillery”)
Race Norming
within group norming
practice of administering the same test to every test taker but scoring test differently according to race of the test taker
Outlawed by Civil Rights Act of 1991
Nominal measurement
numbers are used as labels for categories of data; just naming
statistical analysis to use: Frequency, Mode, Chi-square
ex: 1= democrat, 2= republican
Ordinal
numbers are used to rank order data, but the interval between the ranks ARE NOT equal or can vary
statistical analysis to use: median, percentile, rank-order correlation
i.e, class rank, Likert scales, grade equivalents
Likert scales are seen and treat as what measurement and why?
Ordinal or interval but are treated as interval scales assuming that each point on the rating scale represents an equal distance or amount of the construct being measured
Interval measurement
numbers are rank ordered with equal distances between them, but there is no absolute zero
statistical analysis to use: mean, standard deviation, correlation, t-test, ANOVA
Ratio measurement
numbers are rank ordered with equal distances between them but there is a true meaningful zero point
statistical analysis to use: all parametric analyses
Frequency distributions
orderly arrangment of scores showing the number or percentage of observations within a range/category
displayed as histogram sometimes
Normal (Bell) Curve
symmetrical bell shaped theoretical distribution where most scores cluster near the middle (mean)
shaped determined by mean and SD
With a smaller standard deviation what would the normal curve then look like?
narrow and tall
measures of central tendency
describes middle of a distribution
mean, median, mode
mean
μ or xˉ
average, best for symmetrical distributions ,but is impacted by outliers
unusually high or low scores
median
middle score when all scores are ordered
not impacted by outliers and better for skewed distributions
mode
most frequently occurring score in a distribution
measures of variability
describes how spread out the scores are
range, variance, standard deviation
range
highest score in a distribution minus the lowest score
variance
σ²
indicates whether individual scores tend to be similar to or substantially different from the mean
standard deviation
σ
most commonly used measure of variability
square root of variance
allows us to understand how scores are distributed around the mean in a normal curve
when the tail of a bell curve is to the right side
it is positively skewed
median is smaller than mean
when the tail of a bell curve is to the left side
it is negatively skewed
median is higher than mean
approx. 68% of scores fall within ± __ SD of the mean
± 1 SD
approx. 95% of scores fall within ± _ SD of the mean
± 2 SD
approx. 99.7% of scores fall within ± _ SD of the mean
± 3 SD
measure of relationship
describes distributions of test scores
must have at least two sets or distribution of scores to calculate this
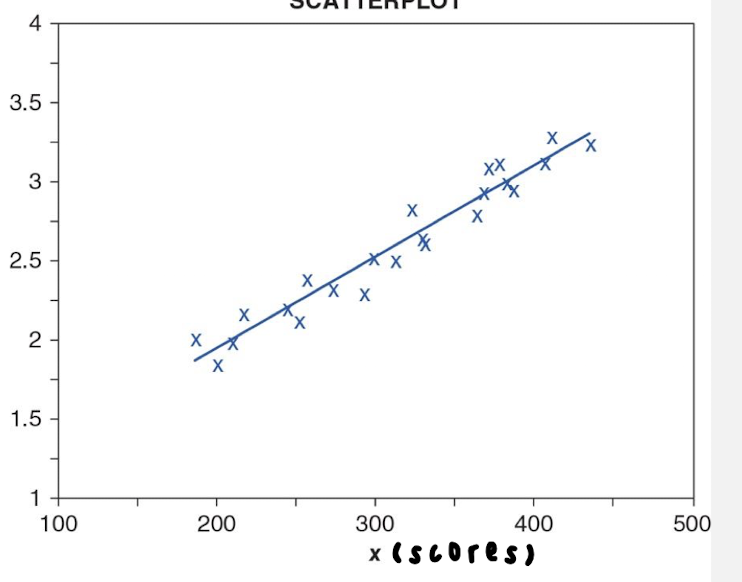
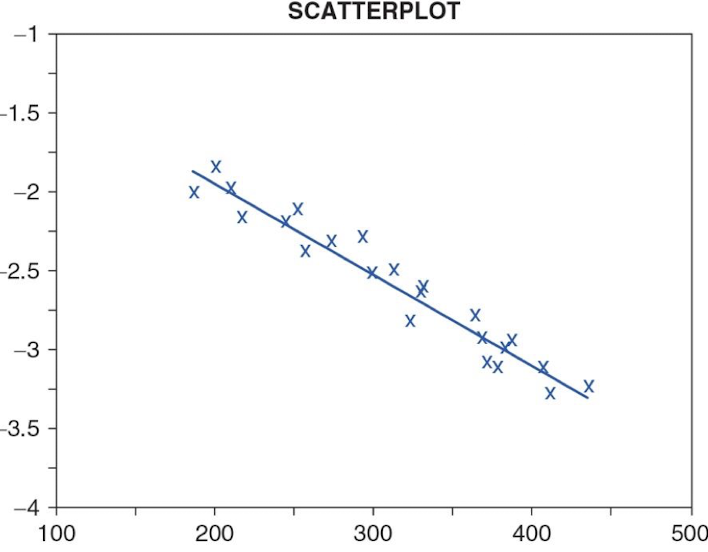
correlation coefficient
correlation coefficient
describes r/s between two or more distribution of scores
whether the same individuals scored similarity on two different tests
measured on interval or ratio scale
-1.0 to +1.0
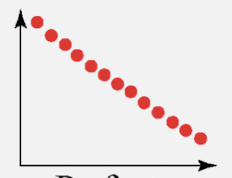
positive correlation coefficient
r > 0
one score increases the other tends to increase
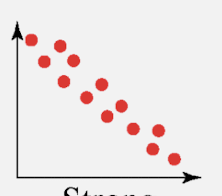
negative correlation coefficient
r < 0
as one score increases, the other tends to decrease
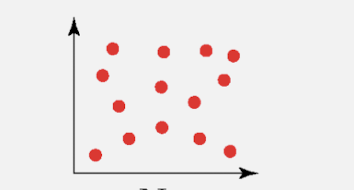
zero correlation coefficient
r = 0
no relationship
perfect positive correlation
strong positive correlation
weak positive correlation
weak negative correlation
strong negative correlation
perfect negative correlation
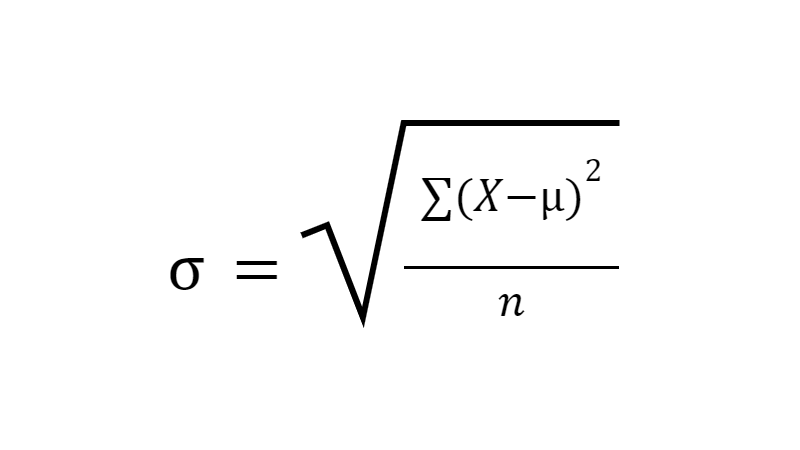
what is the formula for standard deviation (for a population)?
find deviation o each score from the mean (x-µ)²
sum the squared deviations ∑(x-µ)²
divide by N to get variance (σ²)
take square root of variance
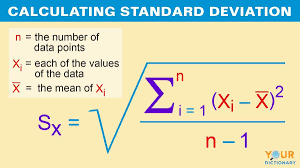
what is the formula for standard deviation (for a sample)?
reliability
consistency of test scores
essential standards for determining how trustworthy data derived from a psychological test are
trust to measure each person and construct in approximately the same way every time it is used
contains some errors
what can impact a person’s measured score?
measurement errors such as mistakes of test taker or test administers, response bias, changes in environmental conditions, flaw or inaccuracy in measuring instrument etc
what makes test reliable?
measures each person in approximately the same way each time it is used
produces consistent results when applied multiple times times or in different circumstances
Classical Test Theory
every observed score (X) is composed of a true score (T) and a random error score (E)
X = T + E
error will create normal distribution
what are the two types of error score (measurement error)?
random error
systematic error
random error
variability in test scores that is due to unpredictable and uncontrollable factors which lowers reliability of test
normally distributed & uncorrelated with true score
environmental conditions, temporary distractions, fluctuations in individuals’ performance
systematic error
when a single source of error consistently increases or decreases the true score by the same amount
can be difficult to identify which distorts the real score
A bathroom scale that always reads 3 lbs higher
three main categories of methods to estimate reliability/precision of the test
test-retest method
alternate forms method
internal consistency methods
test-retest method
test developers gives the same test to the same group of test takers on two different occasions and compared using correlation from the first and second administration to examine the stability of test scores over time
limitations: practice effects
practice effects
test takers benefits from taking the test the first time due to practice which enables them to solve problems more quickly and correctly the second time
alternate- forms method
test developers create two different forms of the test to be as alike as possible to the same people to measure the equivalence of the forms
scores are compared using correlation
overcomes practice effects but has order effects
order effects
changes in scores resulting from the order the test were taken
avoid this by having half test takers receiving form A and the other form B
internal consistency methods
A single test administration is used to see how related the items (or group of items) on the test are to one another
How a person answered one item on the test would give you information that would help you correctly predict how they answered another item on the test
coefficent alpha
coefficient alpha
Cronbach’s alpha = internal consistency coefficient
it items are truly the same construct naturally should be correlated with one another
only appropriate for homogenous test (measuring one trait or characteristic)
ranges 0.00-1.00 (perfeclty relaibile)
higher value = greater consistency
median: .85
how can the test itself influence reliability?
being poorly designed
ambiguous questions
poorly written questions
require a higher reading level than the level of test takers
how can the test administration influence reliability?
when directions are not followed
misread instruction for length of time
answer participant questions incorrectly
allow test environment to be hot, cold or noisy
display a negative or uncomfortable attitude
how can the test scoring influence reliability?
not conducted accurately
e.g: WAIS similarity test item what the words apple and orange have in common?
how can the test takers influence reliability?
contribute to test error
fatigue
illness
exposure to the test questions or research questions before the test
social desirability
what are the steps of test development?
Define the testing universe, target audience, and test purpose
develop a test plan
compose test items
write administration instructions
conduct a pilot test
conduct item analysis
revise the test
validate the test
develop norms and identify cut scores
compile test manual
Testing universe
body of knowledge or behaviors that the test represents
developer prepares working operational definition of the construct the test will measure
target audience
group of individuals who will take the test
purpose
what the test will measure and how scores will be used
normative
criterion approach
normative approach
compares test taker’s performance to other test takers
eg: academic achievement test where the highest score gets a scholarship
criterion approach
approach that compares a test taker’s performance to a specific set of criteria or a standard
what does developing a test plan entail?
specific construct’s operational definition, content to be measured, question format and administration and scoring of test
what are some scoring models?
cumulative, categorical, and ipsative
cumulative
assumes that the more a test taker responses in a particular fashion, the more the test taker exhibits attribute being measure
total number of correct answers becomes raw score
categorical
used to place test takers in a particular group or class and typically yields nominal data
a personality test
Ipsative
forced choice format where a test taker’s preferences are compared to themselves rather than normative group.
total score will be exactly the same for everyone
how many items should test developers write when developing a test?
twice as many as the final version
objective formats
one response that is designated as correct
MC, T/F,
incorrect MC = distractors
subjective formats
do not have single responses designated as correct and require judgment to score
essay, interviews, projective techinques
Response set/bias
patterns of responding that can result in false or misleading information
social desirability
tendency for some test takers to provide or choose answers that are socially accepted or present them in a favorable light