Research Methods
1/155
There's no tags or description
Looks like no tags are added yet.
Name | Mastery | Learn | Test | Matching | Spaced | Call with Kai |
|---|
No analytics yet
Send a link to your students to track their progress
156 Terms
Aim
General statement to describe what the study intends to investigate
Variables
Any object, characteristic or event that varies in some way within the experiment
Independent Variable
The variable chosen by the investigator to be manipulated
Dependent Variable
The variable that is chosen by the investigator to be measured
Operationalisation
The act of putting the independent and dependent variables into practise by making them measureable
Extraneous Variables
Any variable that may randomly affect the dependent variable if left uncontrolled
Demand Characteristics
When participants percieve the demands of the study and consequently alter their natural behaviour accordingly
Experimenter Effects
When some characteristic of the experimenter distracts participants or causes them to behave unnaturally
Hypothesis
Precise testable statement that predicts the findings of an experiment
Null Hypothesis
Predicts there will be no difference or correlation between the conditions
Null Hypothesis (Difference)
There will be no difference between (condition a) and (condition b)
Null Hypothesis (Correlation)
There will be no correlation between (condition a) and (condition b)
Directional Hypothesis
Predics the direction of the results (how the DV is affected)
Directional Hypothesis (Difference)
Participants in (condition a) will be (iv) more/less than in (condition b)
Directional Hypothesis (Correlation)
There will be a positive/negative correlation between (condition a) and (condition b)
Nondirectional Hypothesis
Does not predict how, but suggests the DV will be affected
Nondirectional Hypothesis (Difference)
There will be a difference between participants in (a) and (b)
Nondirectional Hypothesis (Correlation)
There will be a correlation between (a) and (b)
Laboratory Experiment
Controlled enviornment
Extraneous variables can be contolled
IV is directly manipulated
Participants can be randomly allocated
Laboratory Experiment Strengths
Easily controlled variables
Easy to replicate
Easy to establish cause and effect
Laboratory Experiment Weaknesses
Low mundane realism
High demand characteristics
Field Experiments
Carried out in a natural enviornment
Extraneous variables can not be controlled
IV is directly manipulated
Participants can be randomly allocated
Field Experiment Strengths
High mundane realism
Low demand characteristics
Field Experiment Weaknesses
Can not control extraneous variables
Lack of informed consent
Natural Experiments
Either natural or controlled enviornment
Extraneous variables may be controlled
Naturally occouring event
Participants can not be randomly allocated
Natural Experiment Strengths
Ethical research
High external validity
Natural Experiment Weaknesses
Difficulty with cause and effect
Lack of research opportunities
Quasi experiment
Can be natural or controlled enviornment
Extraneous variables may be controlled
Naturally occouring trait
Participants can not be randomly allocated
Quasi Experiment Strengths
Can be same as any other type of experiment
Quasi Experiment Weaknesses
Can be like any other experiment
Repeated Measures
Participants experience all conditions of an experiment
Repeated Measures Strengths
Individual differences less likely
Fewer participants required
Repeated Measures Weaknesses
Order effects
Demand characteristics
Independent groups
Completely different participants are used in each condition
Independent Groups Strengths
No order effects
Fewer demand characteristics
Independent Groups Weaknesses
Individual differences
More participants required
Matched Pairs
Different but similar groups will be used in each condition
Matched Pairs Strengths
No order effects
Fewer demand characteristics
Individual difference less likely
Matched Pairs Weaknesses
Time consuming to match
No identical participants
Random Allocation of Participants
Minimising experimenter bias
Minimises extraneous variables as everyone has equal chance of either condition
Standardisation
Minimises extraneous variables
Standardising enviornments and instructions
Control groups
Baseline for comparison to increase accuracy and validity
Single Blind Technique
Minimises demand characteristics
Participants are not aware of which condition they are placed in
Double Blind Technique
Minimises experimenter bias
Neither participant nor experimenter know the aims of the experiment
Counterbalancing (ABBA)
Balances order effects
Data is analysed as a whole
Randomisation (AB or BA)
Coin flip to decide which condition comes first
Data is analysed as a whole
Pilot Studies
Small scale trial
See any extraneous variables, save time and money, get participant feedback
Random Sampling
Randomly selecting participants in an unbiased way
Each member of the target population has equal chance of selection
Stratified Sampling
Identifying relevant characteristics and selecting a reflecting ratio
Participants randomly drawn from lists until required ratio is met
Systematic Sampling
Selecting every nth participant from a list
Opportunity sampling
Participants take part based on availability
Researcher asks if they want to take part
Volunteer Sampling
Participants self-select or volunteer to take part
Researcher advertises and selects those who respond
Random Sampling Strengths
More likely to be representative
Low experimenter bias
Random Sampling Weaknesses
can be unrepresentative
difficult and impractical
Stratified Sampling Strengths
More likely to be representative
Low experimenter bias
Stratified Sampling Weaknesses
Can be unrepresentative
Impractical and time consuming
Systematic Sampling Strengths
More likely to be representative
No experimenter bias
Systematic Sampling Weaknesses
Can be unrepresentative
Impractical
Opportunity Sampling Strengths
Practical
Easy to gain informed consent
Opportunity Sampling Weaknesses
Likely to be unrepresentative
High experimenter bias
Volunteer Sampling Strengths
Practical
Willing participants
Volunteer Sampling Weaknesses
Low population validity
High volunteer bias
Mean
Arithmetic average
Mean Strengths
Most sensitive/representative measure
Mean Weaknesses
Can give peculiar outcomes
Easily distorted by extreme scores
Median
Central score from a rank ordered list
Median Strengths
Less distorted by extremes
Median Weaknesses
Less sensitive
Mode
Most common score
Mode Strengths
Not distorted by extreme scores
Mode Weaknesses
Less sensitive
May not be appropriate for small data sets
Range
Shows the spread of scores
Range Strengths
Very easy to calculate
Range Weaknesses
Less sensitive
Easily distorted by extreme scores
Standard Deviation
Calculated from scores distance from mean
Standard Deviation Strengths
Most precise measure of dispersion
Standard Deviation Weaknesses
Hard to calculate
Distribution
Type of histogram that shows the frequency of a characteristic
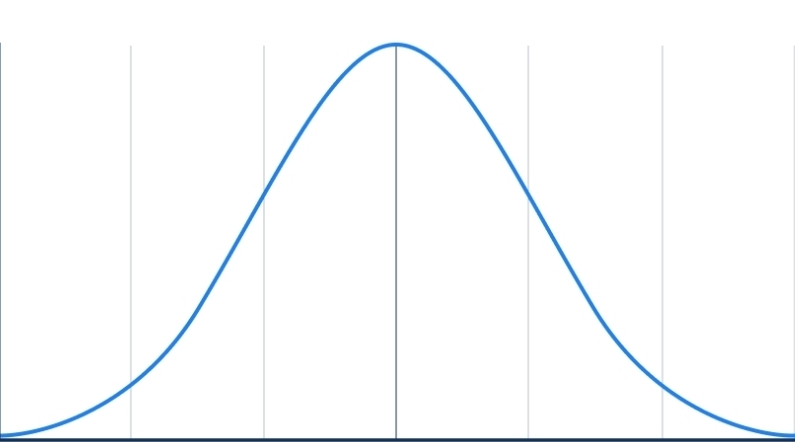
Normal Distribution
Majority of scores clustered around the mean
Data is roughly symmetrical
Mean, median and mode are same/similar
Data forms a normal distribution curve
Normal Distribution
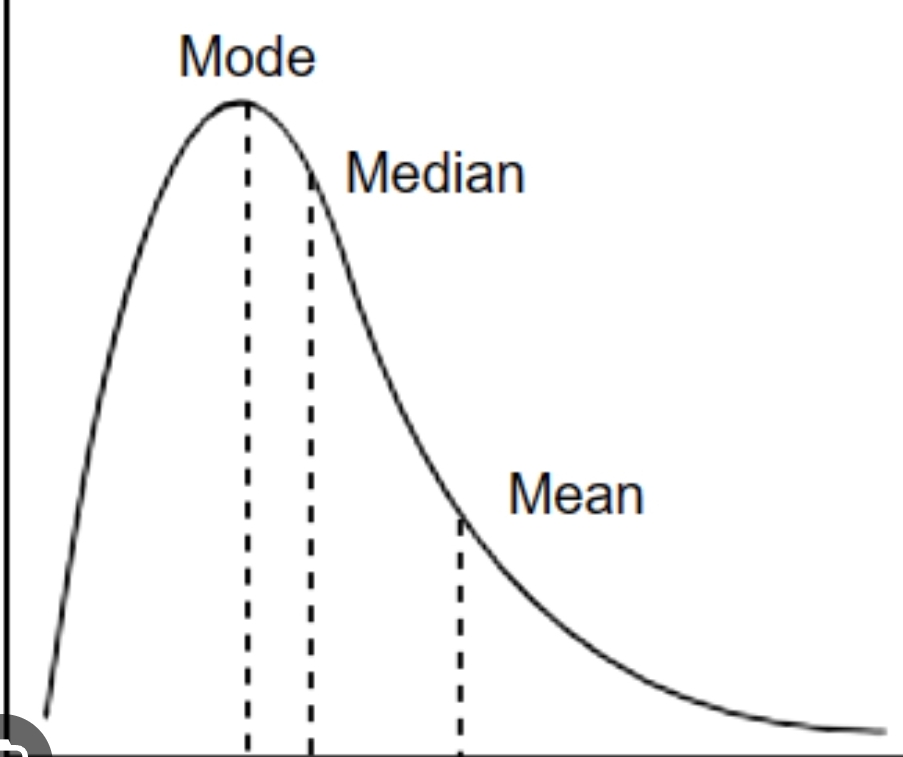
Positively Skewed Distribution
Cluster of scores on the lower end of the data set
Curve has a tail on the right
Mean is higher than the median and mode
Most scores are below the mean
Positively Skewed Distributions
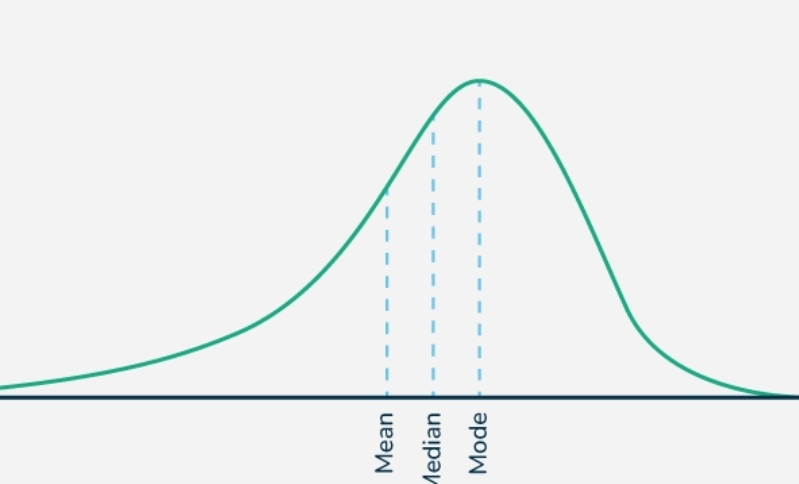
Negatively Skewed Distributions
Cluster of scores on the higher end of the data set
Curve has a tail on the right
Mean is lower than the median and mode
Most scores are above the mean
Negatively Skewed Distributions
Deception
Participants have a right not to experience deception
When deception is acceptable
No alternative
Minor deception
When scientific benefits outweigh negatives
Dealing With Deception
Debriefing
Gaining prior general consent
Informed Consent
Agreeing to take part in reserach being aware of the full aims and procedures
Must Be Known To Be Informed
Aim
Procedure
Probable findings
Rights
Dealing With Informed Consent
Presumptive consent
Prior general consent
Harm
Participants have a right not to experience harm (lasting, psychological or physical)
Dealing With Harm
Debriefing
Privacy and Confidentiality
Participants have the right to be kept anonymous, and their personal details not shared
Dealing With Privacy And Confidentiality
Informed consent
Right To Withdraw
Participants have a right to remove themselves and their data at any point during research
Dealing With Right To Withdraw
Debriefing
Reminders of right
Case Studies
In depth and detailed study of an individual or group. It is often used to study unique examples of phenomena
Phineas Gage
Metal rod through the head after an explosion
Afterwards experienced a personality shift, becoming impulsive and irresponsible
Strengths Of Case Studies
Can ethically investigate rare behaviours
Rich qualitative data
Limitations Of Case Studies
Little control over extraneous variables
Can not generalise findings