4.5 Summary of Curve Sketching
1/24
There's no tags or description
Looks like no tags are added yet.
Name | Mastery | Learn | Test | Matching | Spaced | Call with Kai |
|---|
No analytics yet
Send a link to your students to track their progress
25 Terms
RECALL
So far we have been concerned with some particular aspects of curve sketching: domain, range, and symmetry in Chapter 1
limits, continuity, and asymptotes in Chapter 2
derivatives and tangents in Chapters 2 and 3
and extreme values, intervals of increase and decrease, concavity, points of inflection, and l’Hospital’s Rule in chapter 4
TIME TO PUT EVERYTHING TOGETHER
In the next section we will graph functions by using the interaction between calculus and graphing devices. In this section we draw graphs by first considering the following information.
The following checklist is intended as a guide to sketching a curve y=f(x) by hand. Not every item is relevant to every function.
Guidelines for Sketching a Curve
Checklist:
A. Domain
B. Intercepts
C. Symmetry
D.Asymptotes
E. Intervals of Increase or Decrease
F. Local Maximum and Minimum Values
G. Concavity and Points of Inflection
H. Sketch the Curve
Domain
Determine the Domain- Find all x- values for which the function is defined.
Look for restrictions, such as denominators that equal zero, even roots, logarithms.
How to find the Domain
Domain It’s often useful to start by determining the domain D of f , that is, the set of values of x for which f (x) is defined.
Intercepts
The y-intercept is f (x) and this tells us where the curve intersects the
y-axis.
To find the x-intercepts, we set y 0 and solve for x.
How to find the intercepts
X-intercepts Set f(x)=0 and solve for x.
Y-intercept
Evaluate f(0), if defined.
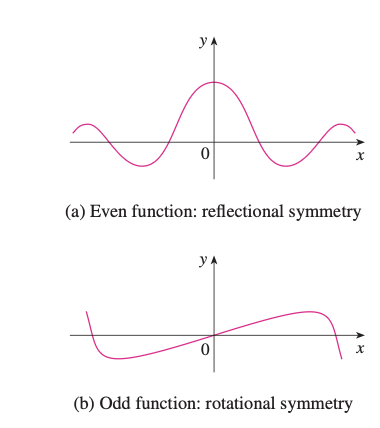
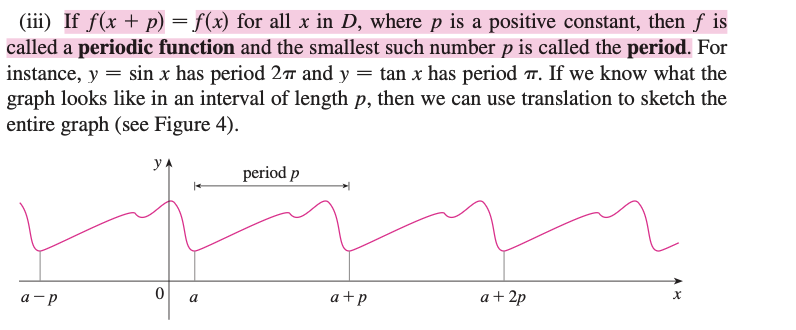
Identify Symmetry
Check whether the function is:
Even: f(−x)=f(x) → symmetric about y-axis
Odd: f(−x)=−f(x) → symmetric about origin
Neither
How to find if a function has symmetry
To find if a function has symmetry in calculus, use algebraic tests by replacing
x with −𝑥 to check for even symmetry (f(−x)) = (f(x))
by replacing both x with −x and
f(x )with −f(x) to check for odd symmetry (f(−x)) =−f(x)
.
Periodic Period
I
Definition: For a periodic function, the period is the length of the interval it takes to complete one full cycle of its repeating pattern.
f f(x+p)=f (x) for all x in D, where p is a positive constant, then f is
called a periodic function and the smallest such number p is called the period.
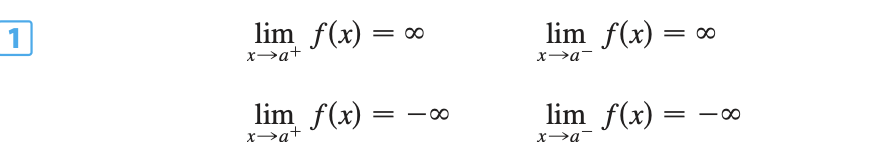
Asymptotes
An asymptote is a line that a curve approaches but never touches, becoming arbitrarily close to it.
These lines can be horizontal, vertical, or slant (oblique) and are often visualized as dotted lines on a graph.
Vertical Asymptotes
Look where the function is undefined and limits → ±∞
The line x=a is a vertical asymptote if at least one of the following is true
Horizontal Asymptotes
x→+∞limf(x) , x→−∞lim f(x)
If the degree of the numerator is less than the degree of the denominator, the horizontal asymptote is y=0
If the degree of the numerator is equal to the degree of the denominator, the horizontal asymptote is the ratio of the leading coefficients (the coefficients of the highest degree terms).
Slant Asymptotes
A slant (oblique) asymptote is a linear asymptote of the form y=mx+b.
When do Slant Asymptotes occur ?
that occurs when:
The degree of the numerator of a rational function is exactly one greater than the degree of the denominator.
deg(numerator)=deg(denominator)+1
How to find a Slant Asymptote
Step 1: Check the degrees
If the numerator’s degree is exactly one more than the denominator’s degree → a slant asymptote exists.
Step 2: Divide the polynomials
Use polynomial long division (or synthetic division if appropriate).
Step 3: Identify the quotient
The quotient (without the remainder) is the slant asymptote.
Intervals of Increase or Decrease
Intervals of increase or decrease describe where a function is going up or down as you read the graph from left to right.
Intervals of increase and decrease describe the segments of a function where its y-values are either rising or falling as x-values increase. You can find these intervals by examining the function's graph or by using its derivative
How to Find the Intervals of Increase or Decrease
Find the first derivative: Differentiate the function, f(x), to find its first derivative, f′(x).
Find the critical numbers: Find the x-values where the first derivative is either equal to zero or undefined.
Create a sign chart: Use the critical numbers to divide the x-axis into intervals. Place the critical numbers on the number line and create a sign chart to test the sign of the derivative in each interval.
Test intervals: Choose a test value within each interval and substitute it into the first derivative, f’(x)
Identify intervals of increase and decrease:
Local Maximum and Minimum values
Local maximum and minimum values are the highest and lowest points of a function within a specific interval, respectively.
You can find them by taking the first derivative of the function, setting it to zero to find critical points, and then using either the first derivative test or the second derivative test to classify these points.
How to find local max and min values ( Local extrema)
Find the first derivative
Find the critical points
Classify the critical points
The Second Derivative Test
Find the second derivative, f′′(x)
Plug each critical point, c into the second derivative.
Local Maximum: If f′′(c) is negative.
Local Minimum: If f′′(c) is positive.
Find the local maximum or minimum values
Substitute the x-values of the local maxima and minima back into the original function, f(x), to find the corresponding y -values.
Concavity and Points Of inflection
Concavity describes the curvature of a function's graph (concave up or concave down
An inflection point is where this curvature changes, such as from curving up to curving down.
How to find the Concavity
To find the concavity of a function, first find its second derivative, then identify where the second derivative is positive or negative.
Find the Second Derivative
Set the second derivative equal to 0 and solve for x to find the infection points
Test intervals
Determine Concavity
If f′′(x) is positive for an interval, the function is concave up on that interval.
If f′′(x) is negative for an interval, the function is concave down on that interval.
If the concavity changes at a point, it is an inflection point.
Sketch the Curve
Using the information in items A–G, draw the graph. Sketch the asymptotes as dashed lines. Plot the intercepts, maximum and minimum points, and infection points.
Then make the curve pass through these points, rising and falling according to E, with concavity according to G, and approaching the asymptotes.