ap stats unit 12
1/10
There's no tags or description
Looks like no tags are added yet.
Name | Mastery | Learn | Test | Matching | Spaced | Call with Kai |
|---|
No analytics yet
Send a link to your students to track their progress
11 Terms
give the standard error of the slope in context
If we repeated the random assignment many times, the slope of the sample regression line would typically vary by about (SEb value) from the slope of the true regression line for predicting (context)
formula for confidence interval of slope B
b ± t*SEb
formula for standard error of slope B
SEb = s / (sx)√(n-1)
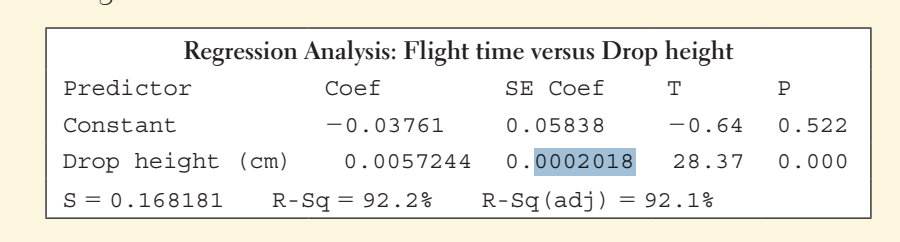
SEb
describes how far the sample slope typically varies from the population (true) slope in repeated random samples or random assignments
t* on calculator
4: invT
df = n-2
confidence interval: 2 tailed (divide by 2)
confidence interval for slope on calculator
STAT → TESTS LinRegTint
x values → L1
y values → L2
significance test for slope on calculator
STAT → TESTS → LinRegTest
x values → L1
y values → L2
power model transformations
^y =ax^(b)
plot y v.s. x^(p)
plot ^(p)√(y) v.s. x
plot log(x) v.s. log(y)
transformations of an exponential model
y^=ab^(x)
plot log(y) v.s. x
plot ln(y) v.s. x
Ho: B=0
Ha: B<0
Interpret the P-value
“if there is no linear relationship between the (x variable) and the (y variable), the probability of getting a random sample of (# in random sample) that yields a least-squares regression line w/ a slope of (slope) or less is (P-value)”
slope interpretation
for each one unit increase in x, y increases by (#) units