Psycstat exam #2
1/36
There's no tags or description
Looks like no tags are added yet.
Name | Mastery | Learn | Test | Matching | Spaced | Call with Kai |
|---|
No analytics yet
Send a link to your students to track their progress
37 Terms
probability (p)
likelihood of event occuring
specific outcomes/total outcomes
random sampling required
random sampling
equal chance of being selected
constant probability - sampling w/ replacement
role of probability in inferential statistics
determine if sample is likely or unlikely to occur by chance if null hypothesis is true
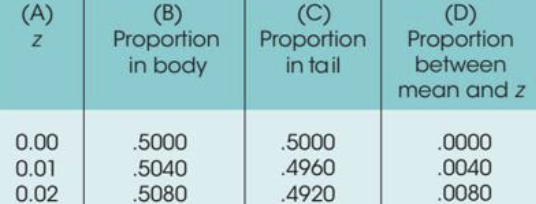
Unit Normal Table
used to find proportion (probability) corresponding to z-score
what makes a distribution of sample means normal
population samples obtained from is normal
sample size: n ≥ 30
sampling error
natural discreprenancy between sample statistic and population parameter
central limit theorem
rules for defining distributions for sample means
central limit theorem - shape
Nearly Normal (if n≥30 or population is normal)
central limit theorem - central tendency
Mean (μM) is equal to the population mean (μ)
central limit theorem - variability
Measures the average distance between a sample mean (M) and μ. '
Formula: σM=σ/n
alpha level (α)
significance level, defines “unlikely” (critical region) region
maximum probability of Type I Error
outcome of hypothesis test by alpha level (α)
p-val < α → reject H0
p-val > α → fail to reject H1
large α (.05) → lower standard → Higher chance of rejecting H0
small α (.01) → higher standard → Lower chance of rejecting H0.
Type I Error
false positive, rejecting a true null hypothesis
controlled by setting alpha value
ex: telling a man he’s pregnant
Type II Error
False negative, failing to reject a false null hypothesis
occurs when effect is too small to observe in small sample
ex: telling a pregnant woman she’s not pregnant
p-value
probability of obtaining observed sample result (or more extreme) if H0 is true
if p-val ≤ α, Reject H0
likelihood of committing Type I error when p = .05
5% when H0 is rejected
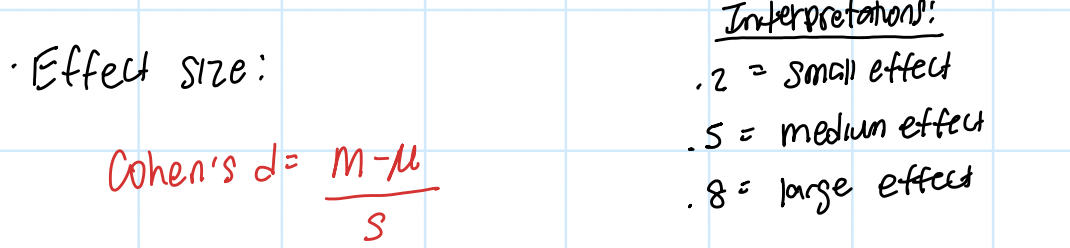
why calculate effect size (Cohen’s d or r²)?
calculate effect size in addition to statistical significance bc significant result might be too small to have any practical importance
Cohen’s d
mean difference in standard deviation units
influenced by SD (σ)
larger SD (σ) = more variability → decrease d
no influence by sample size (n)
Statistical power
probability of correctly rejecting false Null Hypothesis
factors that influence statistical power
effect size (larger effect = more power)
sample size (larger n = more power)
alpha level (larger α = more power)
direction vs. non-directional hyp (Directional hyp. concentrates α on one side, increasing power)
when to use t-test vs. z-score
t-test: when population SD (σ) is UNKNOWN
estimate σ using sample SD (s)
t-test
use sample data to test hypothesis about diff between sample mean & pop. mean
test hyp. for unknown pop. (both μ & σ UNKNOWN)
requires sample & reasonable hyp. about μ
assumptions of t-test
interval or ratio scale
randomness → randomly sampled from pop.
homogeneity of variance → similar variability of data in each group
normality → sample pop. normally distributed
independence → independent observations
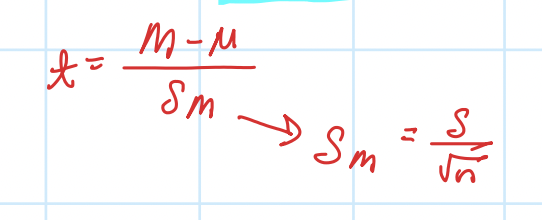
one-sample t-test
sample mean vs. pop. mean
top = diff between M and hypothesized μ (SIGNALl)
bottom = estimated standard error (NOSIE) → more variability
df = n -1
influence of sample size & variance on t-test (one sample)
larger sample size (n) → more normal t-distribution (more power)
smaller sample variance (s²) → larger t-stat (more likely to reject null hyp.)
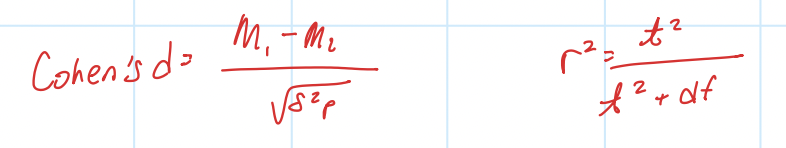
cohen’s d (effect size) - one sample
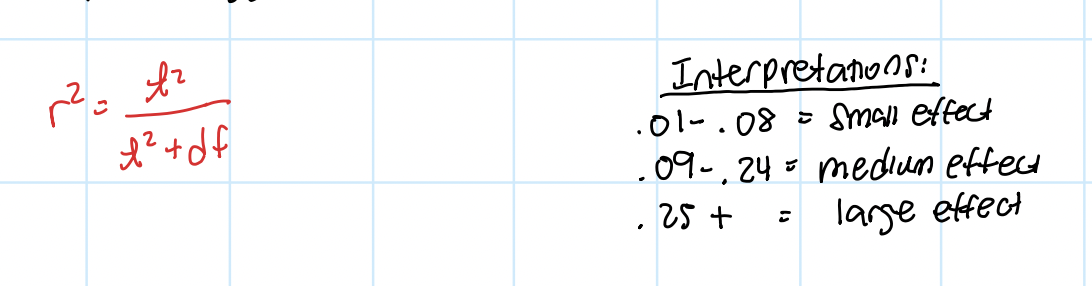
r²
percentage of variance accounted for by IV
SPSS output (one sample t-test)
Descriptive stats:
N = sample size
Sample Mean (M) - value compared against test value
Std. Deviation (s) - variability of scores in sample
Std. Error Mean (SM) - denominator of t-ratio - avg. distance between sample mean and pop mean
Inferential stats:
test value (μ0) - Hypothesized Mean - compare to sample mean (M)
t - t-statistic
df - N-1 - find critical value
Sig. (2-tailed) - p-val
Mean diff. - M−μ0 - diff. between sample mean & test value - used to find Effect Size
compare p-val (sig.) from table 2 to alpha level:
p-val ≤ α → Reject H0
p-val > α → Fail to Reject H0
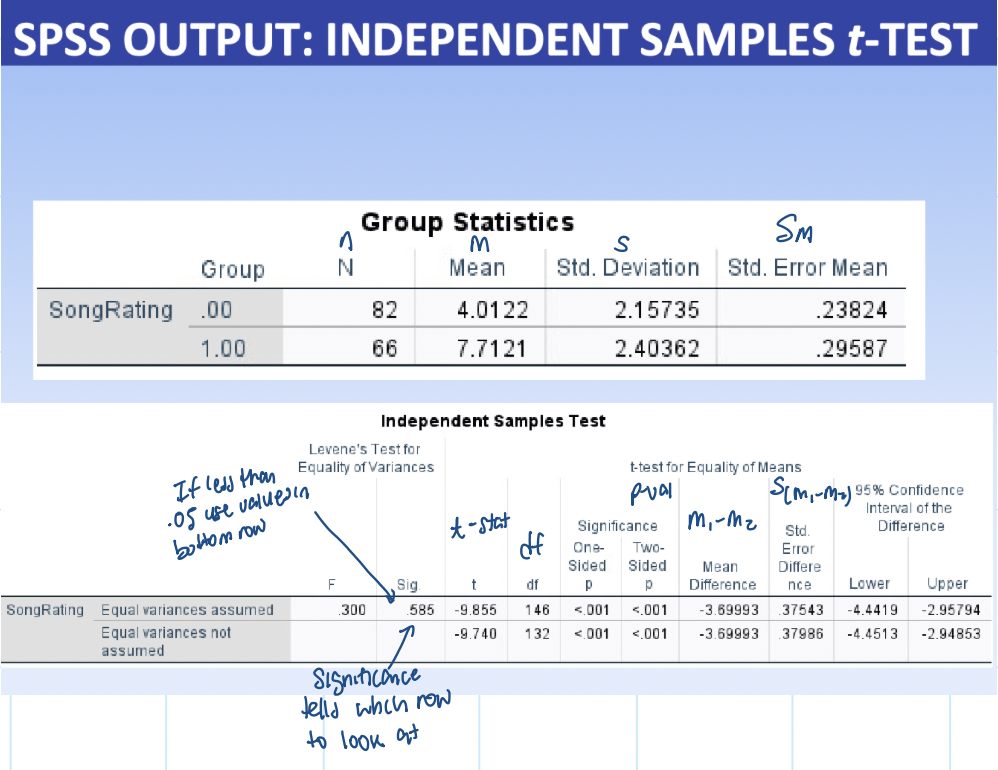
independent measures t-tests (independence samples)
two speerate & indepdent sample groups (ex: male vs. female)
determines whether sample mean diff indicates
real diff between pop. means
or obtained diff due to sampling error
repeated measures t-tests (dependent samples)
one group measured twice (ex: pre-test vs. post-test)
hypothesis for nondirectional two-tailed (independent-measures test)
H0: μ1 = μ2
H1: μ1 ≠ μ2
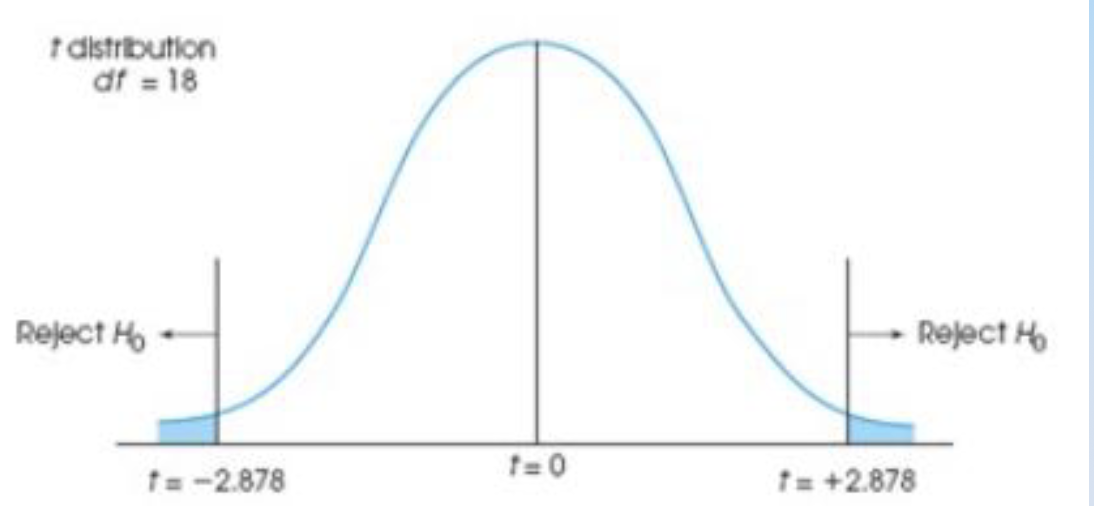
locating critical region (independent-measures)
df = (n1-1) + (n2-1)
look up corresponding val in t-distribution table
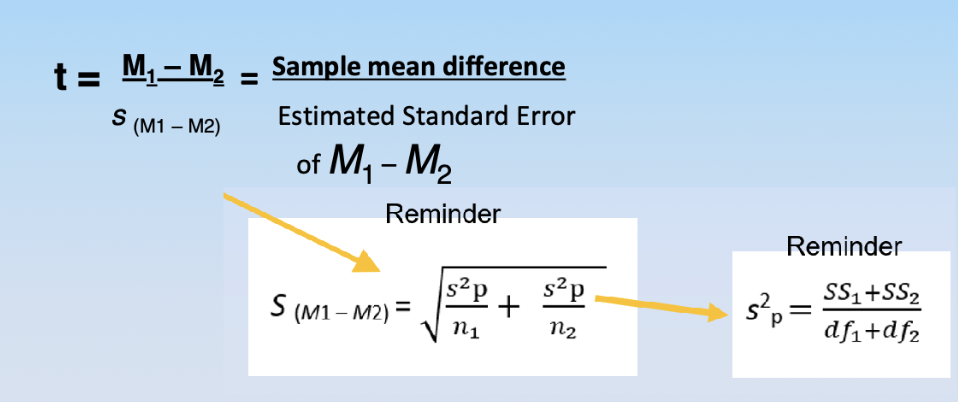
calculating t-stat (indepedent-measures)
making decision based on t-stat (indepdent-measures)
if t-value more extreme than critical val (i.e. p-val ≤ α)→ reject null hyp.
effect size (indepdent-measures)
assumptions of independent measures t-test
interval or ratio
randomness
homogeneity of variance: similar variance
normality
independence
SPSS output (ANOVA)