Measuring health and disease
1/31
There's no tags or description
Looks like no tags are added yet.
Name | Mastery | Learn | Test | Matching | Spaced | Call with Kai |
|---|
No analytics yet
Send a link to your students to track their progress
32 Terms
Rate
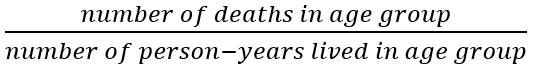
A measure that incorporates time
Crude rate
A rate that applies to a whole population
Specific rates
Rates that apply to a particular subgroup (age category, sex, etc)
Prevalence
Occurrence of a disease in a population or group

Prevalence proportion
Risk
The probability of an event occurring within a specific interval of time

Risk of disease
Incidence rate
The probability of new cases of a disease or probability of dying per unit of time

Morbidity incidence rate

Mortality incidence rate
Person-years lived
The calculation of the amount of time spent by persons in the group at risk of the event (combines periods of different people into a common base)
Age-specific death/mortality rate
Probability of death (qx) per age interval
Probability that someone aged x will die before age (x+1)
Probability of survival (px) per age interval
Probability that someone aged x will survive to age (x+1)
Central mortality rate (mx)
Proportion of individuals aged x dying by age x+1

Central mortality rate (mx)
Period life tables
Life tables that indicate the life expectancy, mortality, and survival of people in a specific time period
Cohort life tables
Life tables that track mortality and survival of each birth cohort
Bias
Systematic/constant error
What are life/mortality pyramids and what do they show?
They show events and the occurrence of death through time
How population mortality changes over time, course of mortality over the life cycle
They are a representation of death and survivorship at each age of life
Linked to ‘ideal’ populations free of effects of population size and features of age distribution resulting historical disturbances
They usually look at males and females separately as they usually have very different mortality patterns
Probability of survival (px) = 1 - probability of death (qx) per age interval
Life table equation
Life expectancy (ex) formula
Total number of years lived (Tx)/number of people alive (survivors) at age x (lx)
What are sources of error/bias in life tables?
Preservation bias, confounding factors, selection bias, and observation bias
According to Saracci (2010), what is the ICD?
The ICD is the International Classification of Diseases and Related Health Problems, the most widely used collection of disease definitions made by the World Health Organisation
According to Saracci (2010), how is the ICD organised?
It compares and groups diseases based on the site of disease and the nature and cause of the disease, covering five broad disease categories
These are then broken up into 22 more specific categories, and all diseases are denoted by a three-character code made up of one letter and two numbers
What was the purpose of Howell’s (1979) study?
Howell looks at !Kung mortality patterns to understand whether they fit the model life tables (based on agricultural society data) to see if they can be used for other hunter-gatherer groups with no data
What did Howell (1979) observe?
The observed age patterns of mortality shown in the graphs are relatively consistent with the patterns shown in the different model life tables, but the actual mortality levels for the groups differs significantly
What were sources of bias that Howell (1979) identified?
The researchers intervening, mothers exaggerating children’s ages at death, people being left out, an unusually healthy population (sick people leaving), or a small population could lead to bias
What does this graph show?
A life table (sort of) for the death rate of males based on age
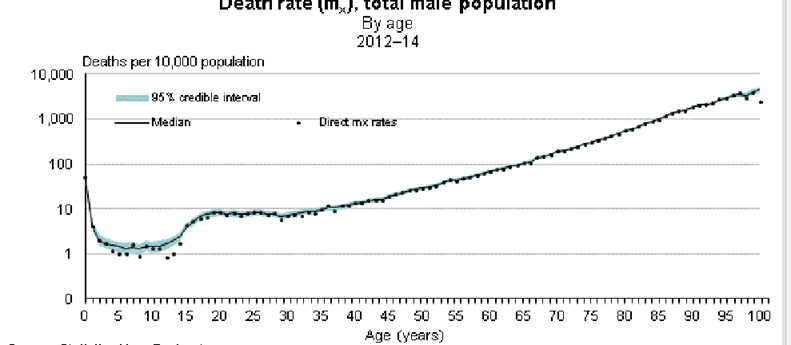
What does this graph show?
Life expectancy at birth for males and females based on their birth cohort
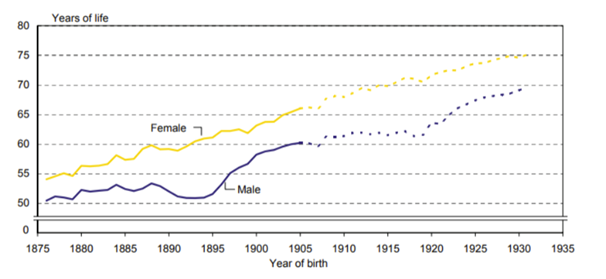
What do these graphs show?
The reduction in death rates by age for males and females of death cohorts relative to the 1876 birth cohort
What does this graph show?
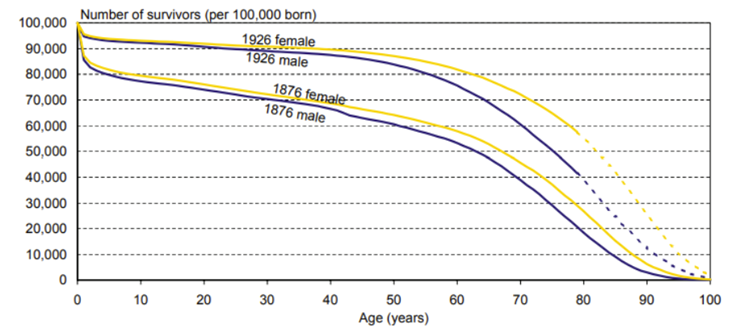
The number of survivors in each age group for the two cohorts by sex